

MARKETSCOPE : The Greatest Fool
February, 26 2024
The greater fool theory argues that prices go up because people are able to sell overpriced securities to a “greater fool,” whether or not they are overvalued. That is, of course, until there are no greater fools left.
Late To the Party Or the Trend Is Your Friend…?
Stock markets in the United States, Europe and Japan set record highs this week after Nvidia reported blowout quarterly earnings results and strong guidance. “Insatiable demand” for the company’s artificial intelligence chips lifted the stock more than 16%, leading the company to briefly surpass a $2 trillion valuation, and helped propel the broader market.
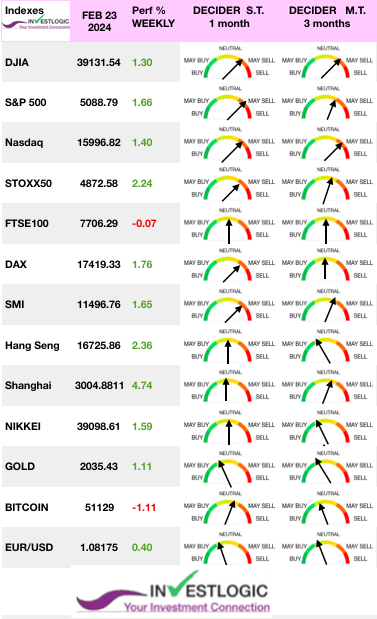 What rates? Investors have been walking back expectations for Federal Reserve rate cuts, which normally would be a headwind for the market. All would be well if the Fed were kind enough to lower rates before the summer. In the meantime, the 10-year yield is stabilizing at around 4.30%, with initial support at 4.07%.
In the Eurozone, early PMI data for February suggested that the economy could be stabilizing, helped by a recovery in the services sector.
STOXX Europe 600 Index climbed to a record level, ending the week 1.15% higher.
Japanese equities ended Thursday at a new all-time high, with the Nikkei 225 Index breaking the previous record set more than 30 years ago in 1989. See our Strategy &Asset allocation on July 2023.
Chinese equities rallied as recovery hopes rose following buoyant holiday spending during the prior week’s Lunar New Year holiday. The Shanghai Composite Index rose 4.85%.
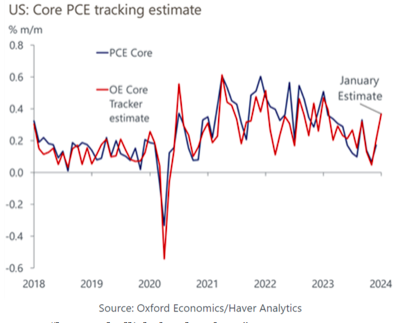
While the stock market has its eyes on AI, macroeconomic statistics are back in the spotlight this week. These include preliminary inflation data for Europe in February and January PCE inflation in the USA. The release is considered the Federal Reserve’s favored inflation gauge and could move the meter with interest rate expectations -see bottom “FED”-.
The pace of corporate earnings releases is slowing, but there’s still a few things in the calendar, including Salesforce and Broadcom.
Party Like It’s 1999
MARKETS : “Be Very Bullish, But Less Long”.
How quickly the narrative can change. A week ago we felt that this was bubble style early 2000 and now apparently it is not even 1999. Goldman’s traders says that the tech rally will continue in the near term.
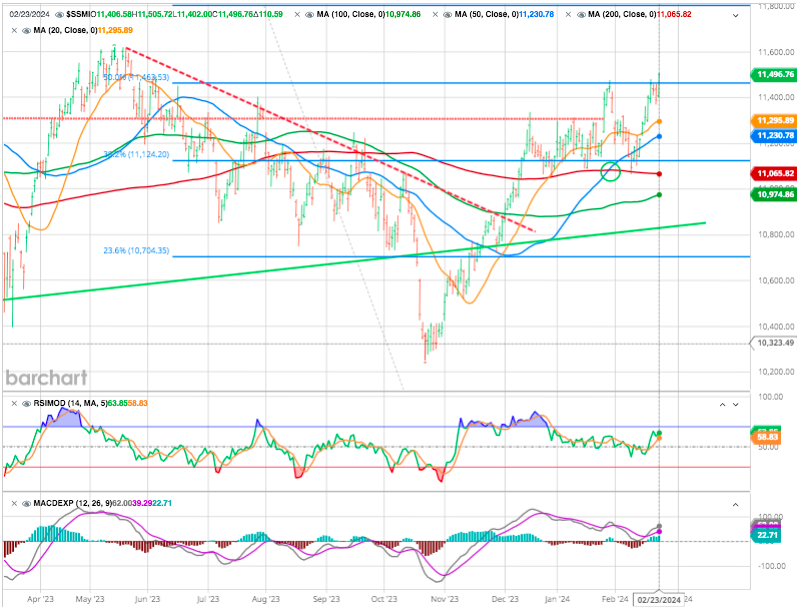
Let’s see : The rally continued this past week, spurred higher by Nvidia’s blowout earnings report Wednesday night. After a brief test of the 20-DMA, the market surged to new all-time highs on Thursday, confirming the ongoing bullish trend. As shown, the 20-DMA continues to act as crucial support for the market.
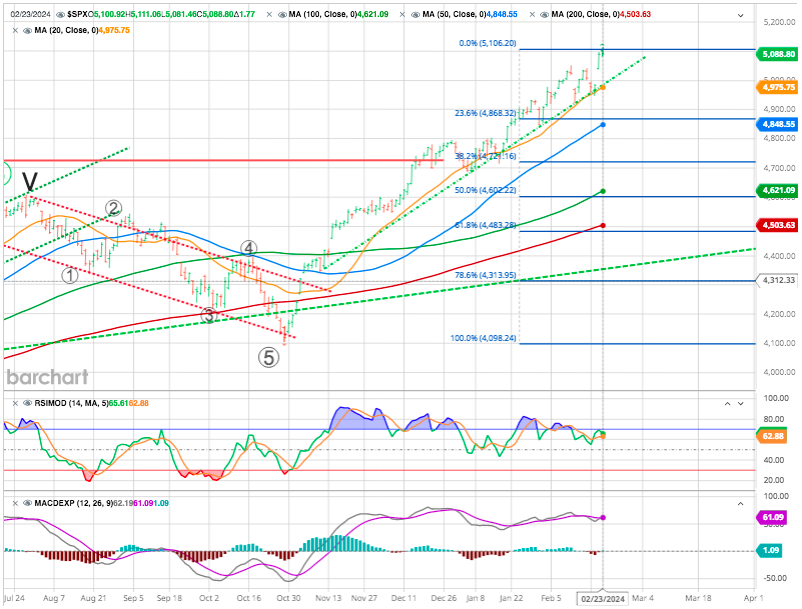
The negative divergence in both momentum (see lower RSI highs) continues to be of concern, suggesting a short-term correction is likely. As a prospective we indicates the potential Fibo retracements and the various support levels.
We don’t know what will eventually lead to a market correction, but one will ultimately occur to reverse the more extreme deviation to a 38.% Fibo retracement (4730).
With the bulk of earnings season behind us, the focus will return to the Fed and the economy.
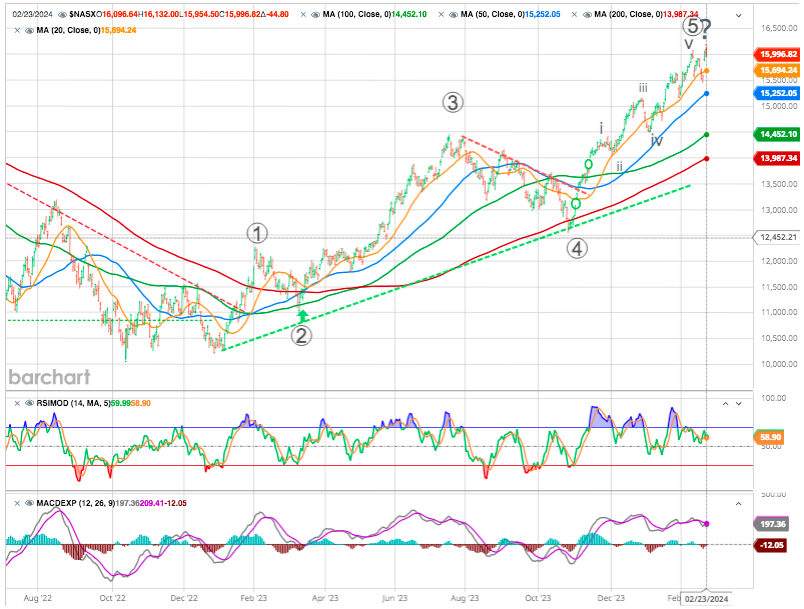
The Nasdaq tends to confirm this extreme over extension with a possible five-wave top !
Swiss stock market still has lots to recover compare to other European markets but heavy pharma and consumer companies are weighting on the index. It is now at the 50 % up move from the leg down from January 2022.
Japan and Nvidia: points of no return
Last but not least, to finalize the index section, today’s honorary mention goes to the Nikkei 225, which 35 years later hit a new all-time high. Check our review Rising Sun here
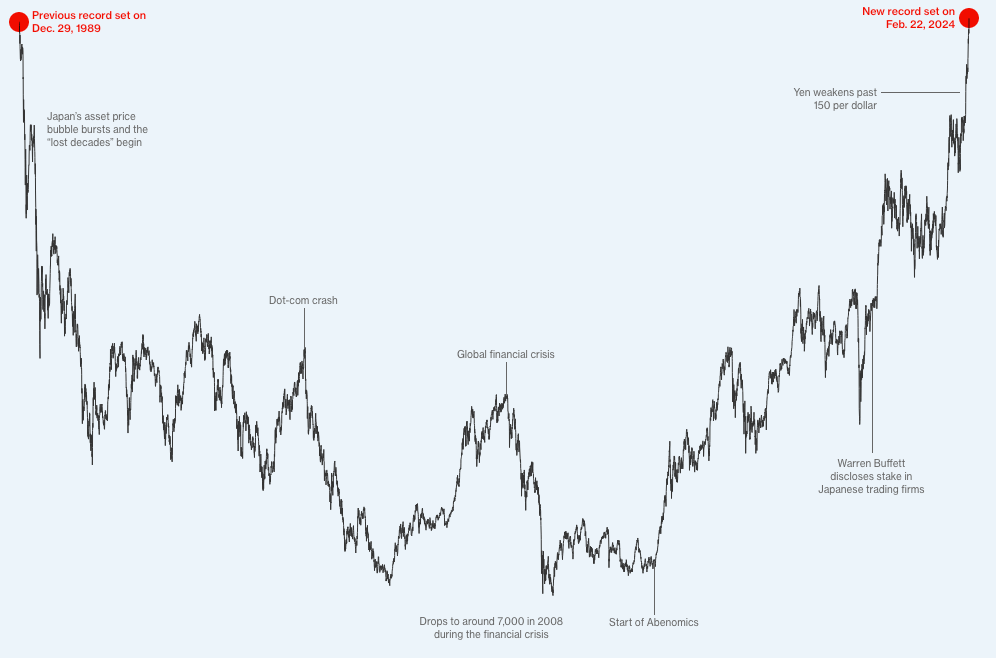
Source Bloomberg
Uhm : maybe one more ..
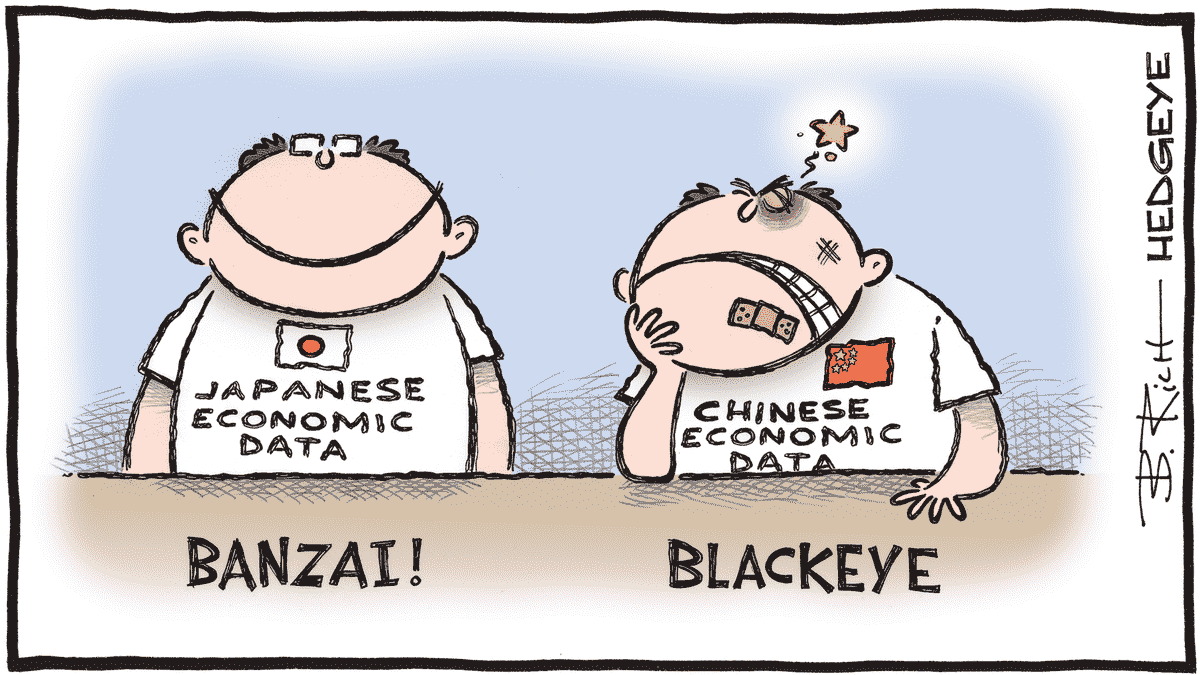
Just as you weren’t paying attention, Chinses stocks (CSI 300 are up more than 15% from the recent lows in a strong V-shape recovery ! (check our latest report on China here and our Chinese horoscope predictions)
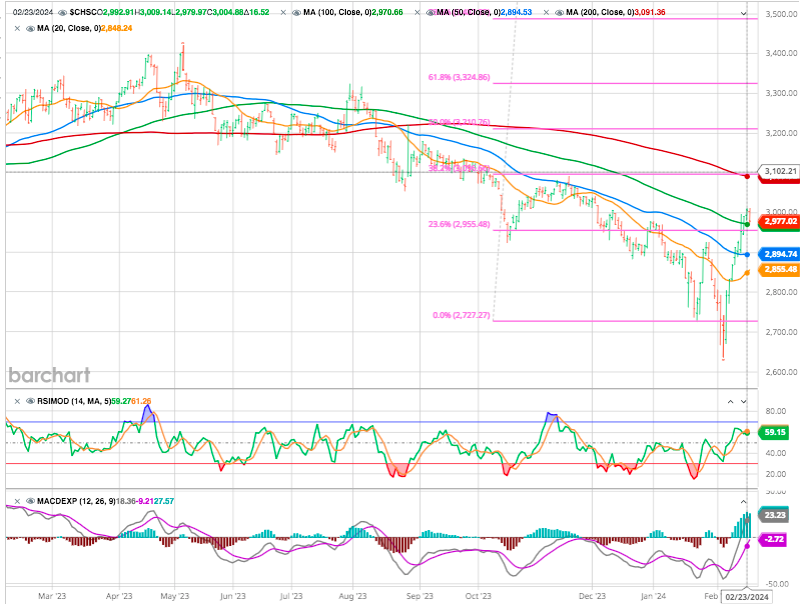
In case you missed it. Chinese stocks have now fully recovered from all year-to-date losses and are now green on the year. Admittedly, the index is still down 35% since last February, but we love the stealth moves were nobody is really paying attention because it has become uninvestable !!!
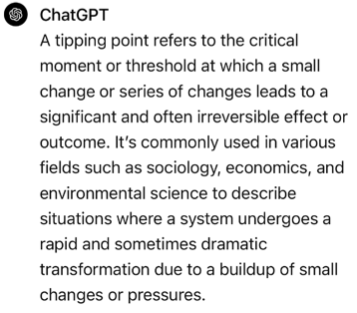
Nvidia : Tipping Point
As everybody else we cannot not to mention Nvidia and the spectacular (historical) move.
If as mentioned by CEO Jensen Huang “Generative AI has kicked off a whole new investment cycle, and would represent an annual market opportunity in the hundreds of billions, it might well be a new “Tipping Point” :
The company stock price has surged in recent weeks and this has lead the broader stock market higher!
The latest rally resulted in the biggest single-session increase for a U.S. company in history, with Nvidia adding $277B in market value. Putting it in perspective, the increase alone was larger than some of the biggest blue-chip firms, like Coca-Cola.
Nvidia’s profits have risen faster than its share price in recent years, share is trading at a P/E ratio of ~30. But of course, this is also due to the high margins.

Of course, there will come a time when Nvidia’s AI demand will slow down, and growth will become lower than expected, leading to worsening profits and a lower stock price. However, that time is not here yet, and when it will arrive, only time will tell. If they were to be disrupted at some point due to increasing competition, the low valuations would be over.
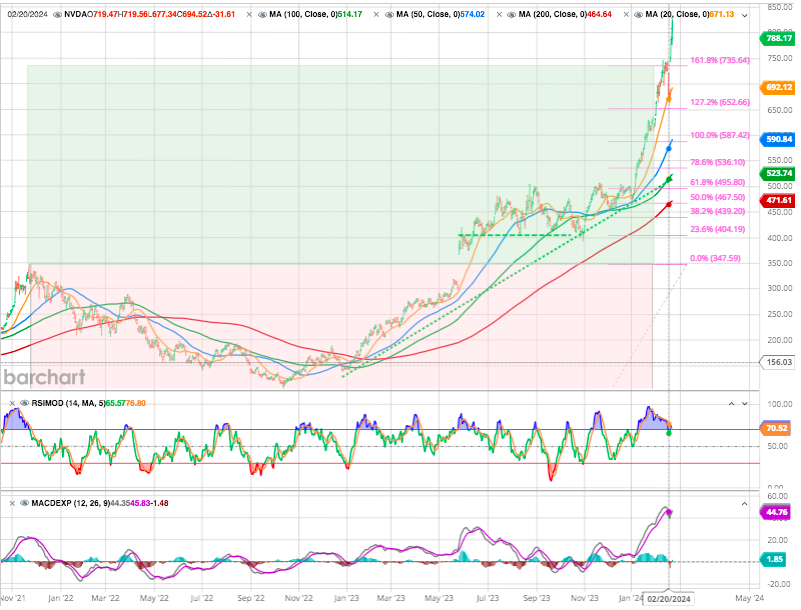
We can see that the latest up move the high flying NVDA daily hit and broke its 1.618 % Fibonacci extension level last week. Might this parabolic increase continue ?Any weakness would be a concern that any further selling might trigger a broader stock market correction.
Is This a Bubble?
As the world contemplates the phenomenal growth of Nvidia Corp., whose market worth has just surged by more than $275 billion in response to its ongoing surge in profits, thoughts turn not only to dot-coms but the Great Crash of 1929 and even the 49er Gold Rush.
Also check the excellent analysis by John Authers in Bloomberg
Current comparisons to the epic melt-up in dot-com stocks look reasonable.
A host of similarities between tech stocks now and previous bubbles suggest the Magnificent Seven is nearing — but not yet at — levels that may lead it to pop. It ain’t cheap, according to Bank of America strategist’s Hartnett, but true that bubble highs have seen dafter valuations.
Another mentioned metric is that the gains are smaller than other bubbles measured trough-to-peak. Since a low in December 2022, the Magnificent Seven has jumped about 140%. It’s not quite the 190% surge seen during the Internet bubble for the Nasdaq Composite or the 230% rally of FAANG stocks from Covid lows.
The chart below goes much further than that showing that this rally is still far more subdued than the great melt-up of 1999 and 2000. Which side of 99 are you on?
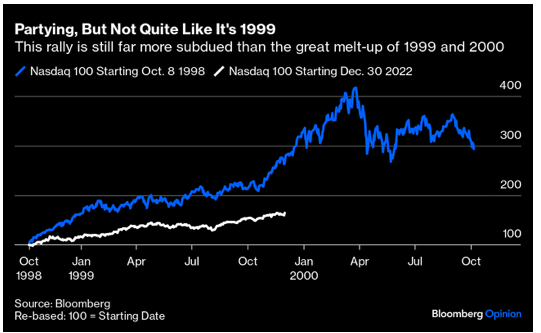
So, if 1999 is our benchmark, this definitely isn’t a bubble just yet. That could change if cheaper money is added to the classic pre-condition of an exciting new technology on which people don’t want to miss out.
Those who wish to try the dangerous job of timing a bubble probably have a while to do so.
Beyond judging how others will behave, though, piling in would imply confidence that the soft economic landing with lower rates scenario actually comes true, along with confidence that the biggest companies will carry on growing unimpeded. If that happens, there’s plenty more partying ahead… Just try not to think what would come after.
FED : No Rush To Cut Rates, Meeting Minutes Show
As questioned by Albert Edwards
“I’m sure there is an analogy with Jay Powell here but not entirely sure what it is. Is that Janet Yellen looking on in amazement?”
Fed is not in a hurry to cut rates. It’s as simple as that.
The market is once again buying into the Fed’s narrative of keeping interest rates higher for longer. The 10-year Treasury still yields more than a year ago, on the eve of a brief banking crisis. And amazingly, stocks are still prospering, in large part thanks to the Artificial Intelligence.
The Fed is likely to remain patient in cutting its key interest rate, currently at a 23-year high.
“Most participants noted the risks of moving too quickly to ease the stance of policy and emphasized the importance of carefully assessing incoming data in judging whether inflation is moving down sustainably to 2%,” the meeting minutes read.
Policymakers at the Federal Reserve are still worried that inflation could flare up again, and are in no hurry to cut its key interest rate.
Many investors will argue that the Fed has learned from history and will “pivot” quickly to creating more money out of thin air and slashing interest rates if and when the economy noticeably weakens.
But let’s look at the chart below it shows that Fed easing has not prevented major stock bear markets and recessions historically, once the economy is on a recessionary track and investor sentiment becomes fearful and risk adverse.
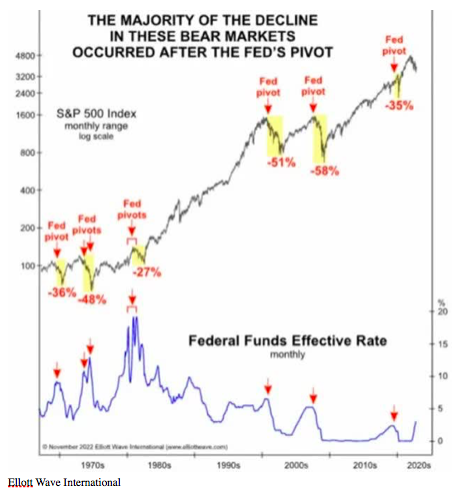
Ellott Wave International
If the central bank waits for clear signs that the labor market, or the broader economy, is deteriorating, it will be behind the curve. This could make a soft landing bumpy.
Since no one has a crystal ball, all we can do as investors is look to the past for clues about the future. The valuation, economic, sentiment and technical indicators we are seeing now are ominously similar to those seen in the 1929. As a result, investors should be aware of this and be prepared to protect their portfolio.
Happy trades
BONUS
Determining The Trend
The following chart shows the price of the S&P 500 since early 2023 (white line) and the price from August 1928 to the stock market crash of 1929 (red line). While charts like this usually seem to work until they don’t, it is striking how similar the price trend has been so far, with a correlation of 0.94.
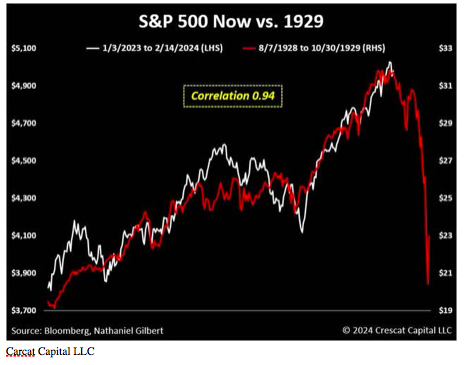
Source Carcat Capital LLC
We obviously cannot say there will definitely be a crash similar to 1929 in the coming months based on this chart, but given the similarity of current valuation levels, leading economic indicators and narrowness of the market to 1929, unfortunately a major stock bear market cannot be ruled out.