

What Are the Charts Telling Us ?
February, 28 2023

Lower for Longer
Check our previous What the charts are telling us.
As we have explained, (see our weekly MARKETSCOPE chronicles) data suggests the recent rebound in stocks and other risk assets has been at least partially driven by increased central bank liquidity that has offset the Federal Reserve’s stated goal of “tightening” monetary policy.
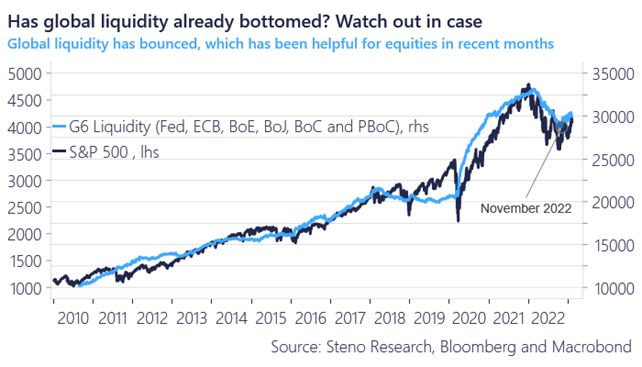
However, this trend likely isn’t sustainable, and we could see liquidity begin to reverse lower in the second half of the year.
That means the medium- to long-term outlook for stocks may ultimately depend on whether the Fed can pull off a so-called “soft landing” – a Goldilocks-type scenario where the economy slows just enough to bring inflation down but avoids falling into a recession.
Now, this scenario isn’t impossible. But it is doubtful.
Hard or soft, this metaphorical plane will land, and it remains our view that the risks facing today’s equity market remain more substantial and consequential than the tailwinds that are still supporting it.
In fact, the Fed has only achieved this feat once in its 100-plus-year history (in the mid-1990s).
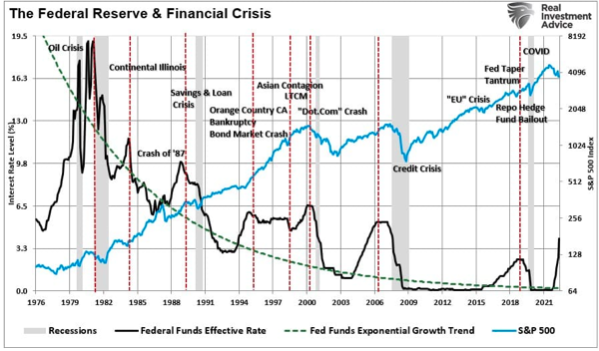
Every other Fed tightening cycle has ended with the economy falling into recession. And stocks could move significantly lower again if that is the case this time around.
FED : higher for longer ! Markets : Lower for longer
Let’s look to our favourite long term charts
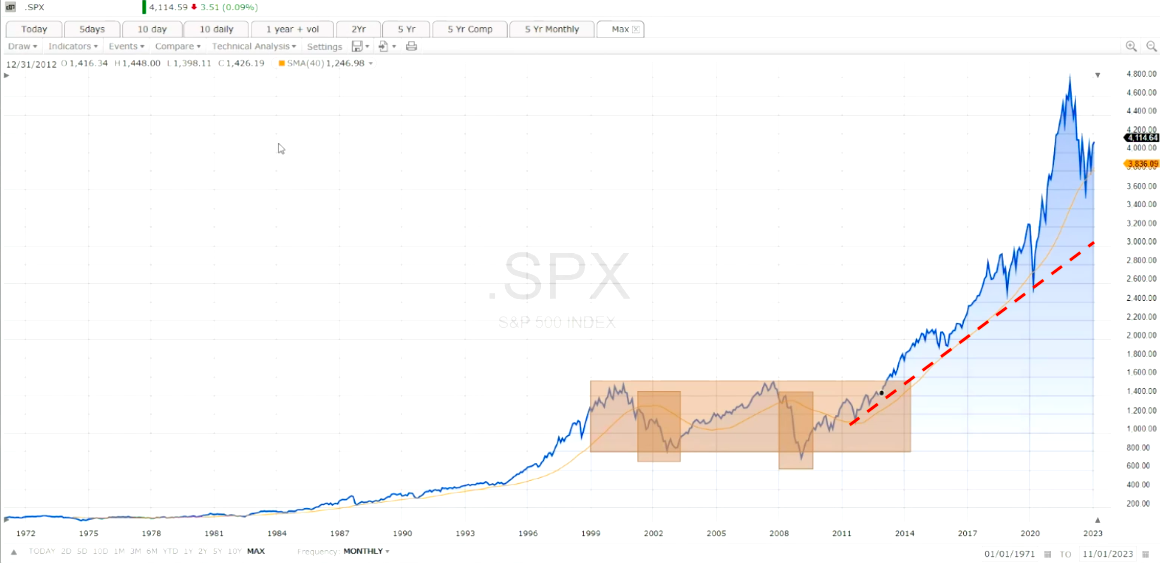
The monthly S&P chart from 1971 shows that the primary long term secular uptrend Starting 2009) is still in place (moving average 40 months and uptrend dotted line) with a major support at 3800, and ultimate at 3000.
On a weekly chart we can anticipate we will see a long sideway pattern in large range with manifestation of the FOMO/YOLO (you only live once) mood dominating markets. Obviously it will not be easy to trade and many will not survive.
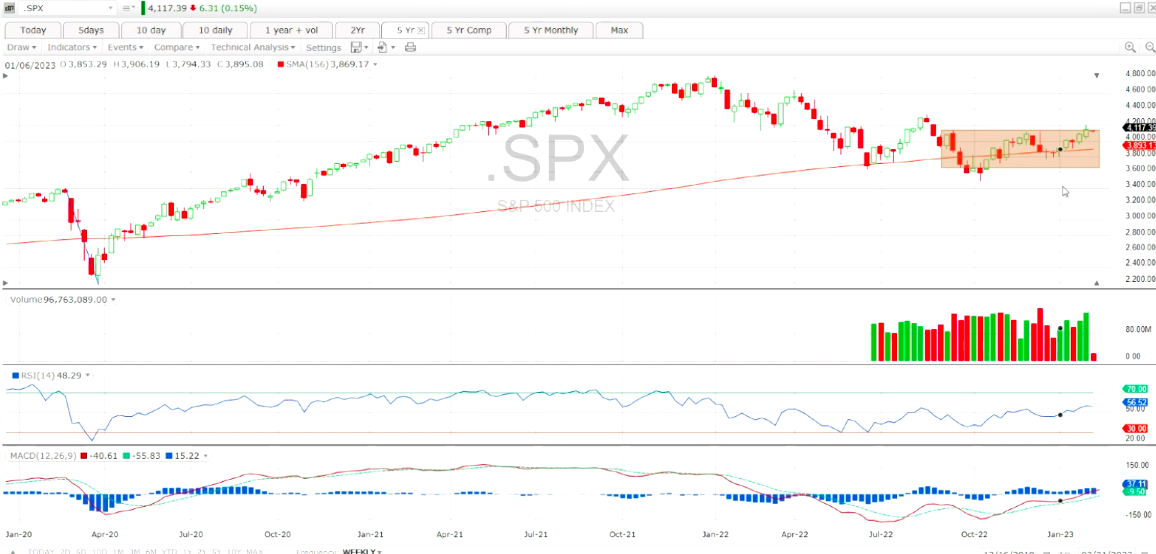 weekly
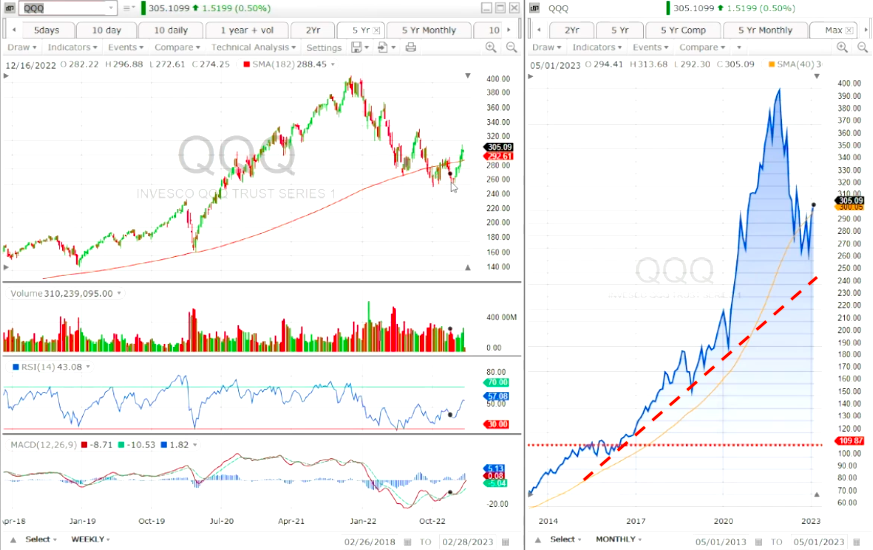
On the Nasdaq Index we remain cautious as the correction is underway. As it is true that cover needed tech, it is not the case today. As we shall see in different individual stocks.
 weekly monthly
So, we would still urge conservative investors not to get overly aggressive in tech stocks.
In addition to following our usual risk-management advice – including using risk-adjusted position sizing and trailing stops on every position – that means sticking primarily to the healthiest stocks in the market’s strongest sectors and generally avoiding most stocks in the weakest sectors.
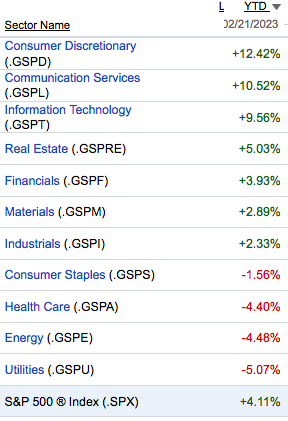
Although since the beginning of the year, the most hit sectors in 2022 have strongly recovered as the leaders were weaker:
The following table shows the current Oscilllator Distributions of each of the market’s eleven sectors.
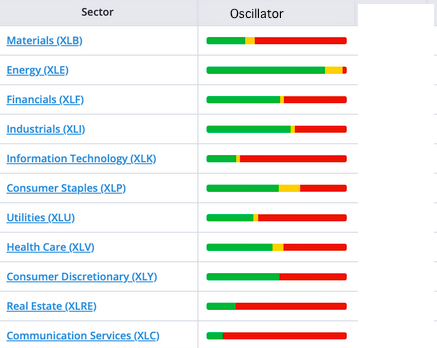
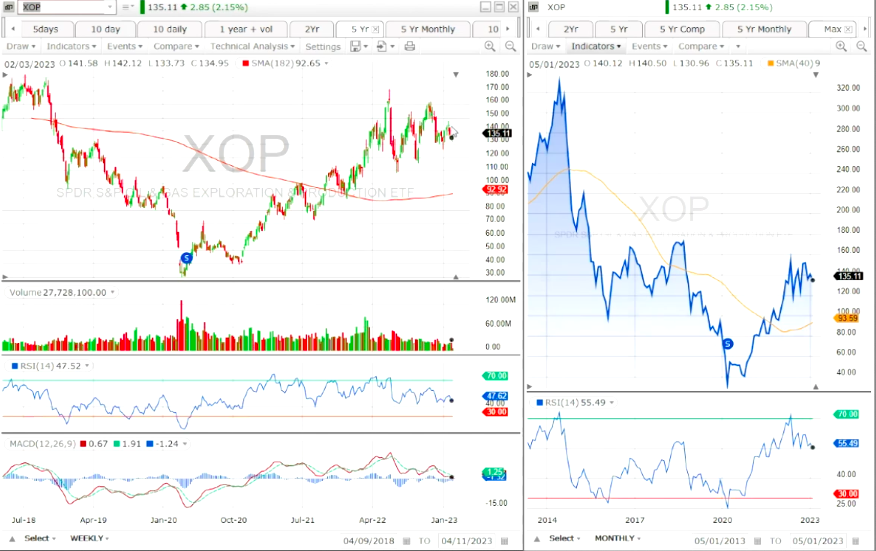
“Strongest” includes the two standout sectors of the past months – Energy (XLE) and Consumer Staples (XLP), both of which are in Green Zone today.
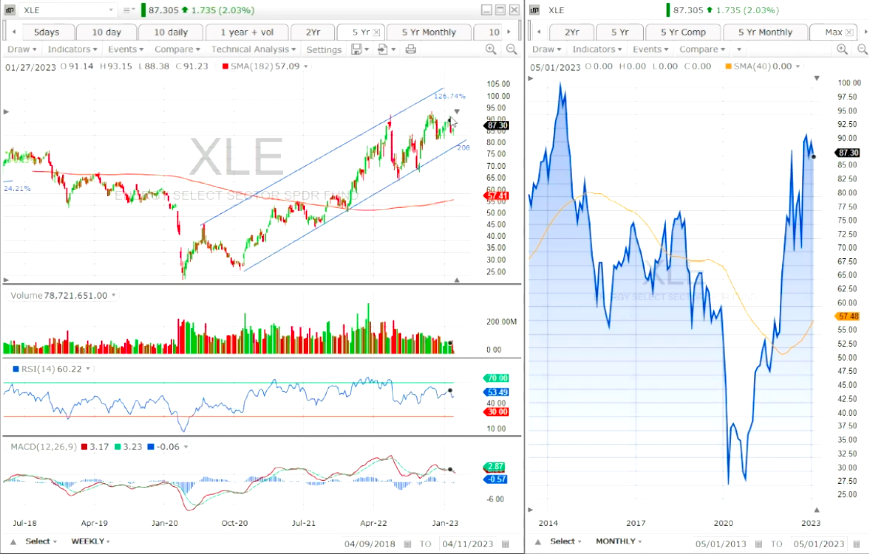
The sector still look OK. However we can see some slowdown in the trend as it did not renew a new high and the breath is turning lower. Maybe time to take some profits before challenging the historic highs.
ie Chevron
![]()
It is also true for Oil & Gas Exploration stocks which may be in danger short term.
Staples (XLP)
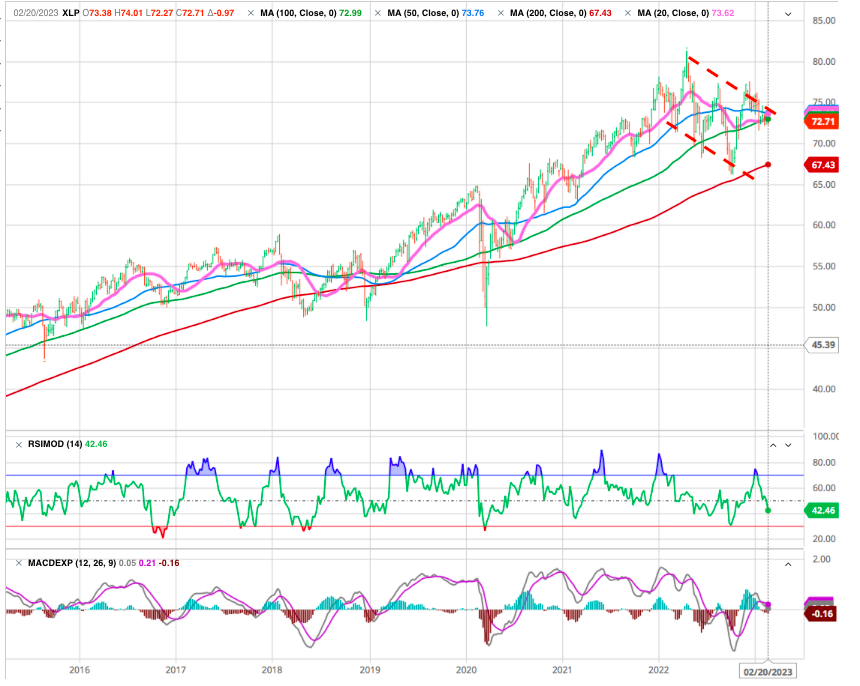
After a short term weaker trend due to the strong economy, we can expect a move upward as economic growth slows.
Industrials (XLI)
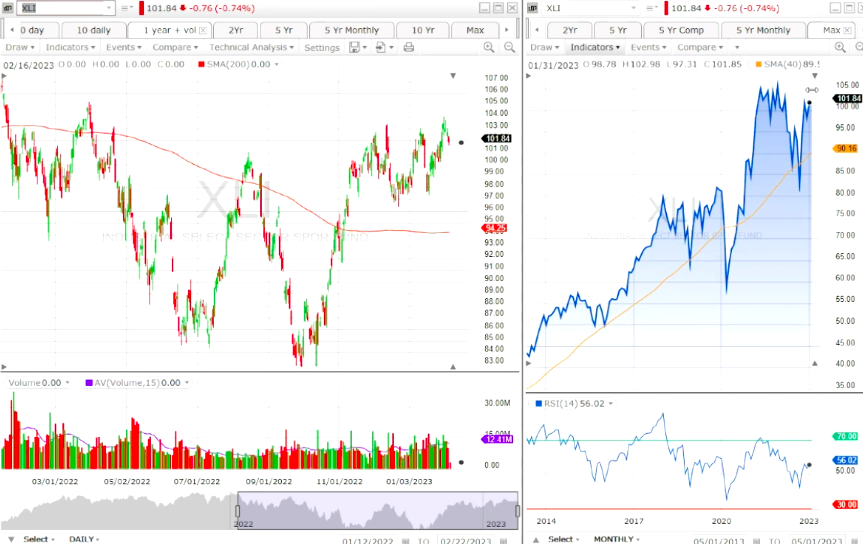
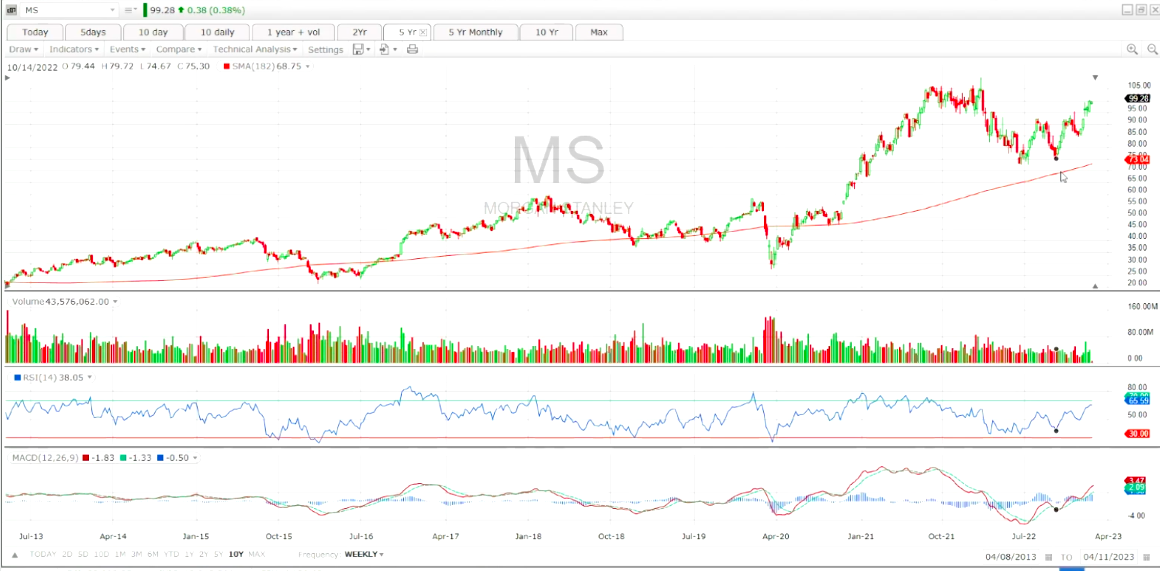
and Financials (XLF)
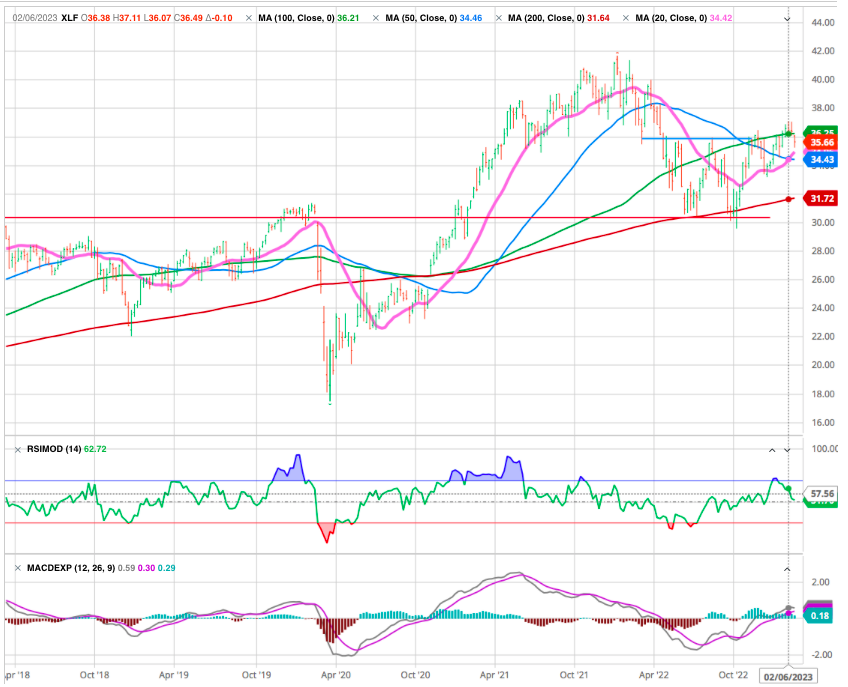
The group remains strongand is able to challenge its highs. In addition we have a strong long term support (red horizontal line) and the long term weekly 200 MA.
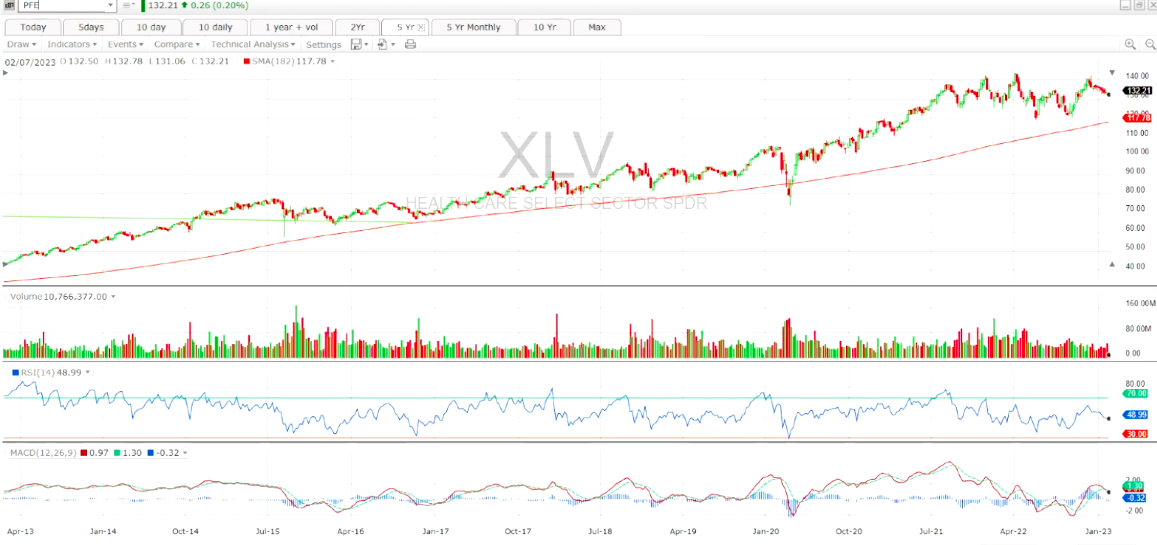
Several other sectors have also shown significant health improvements of late, including Health Care (XLV), still in an uptrend.
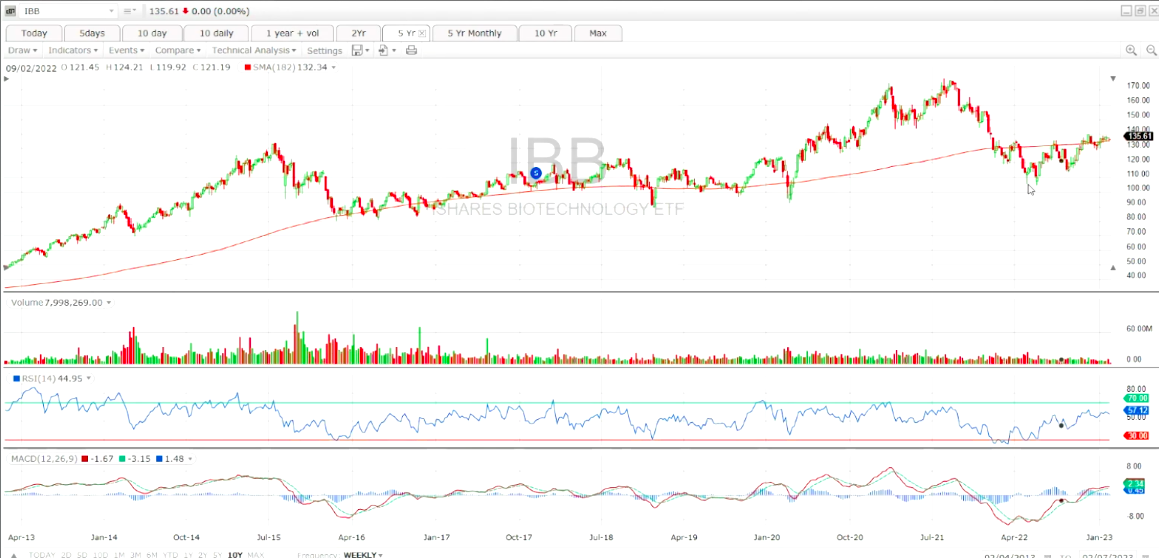
The large Biotech stocks could also become attractive if they can break the l.t. moving average resistance.
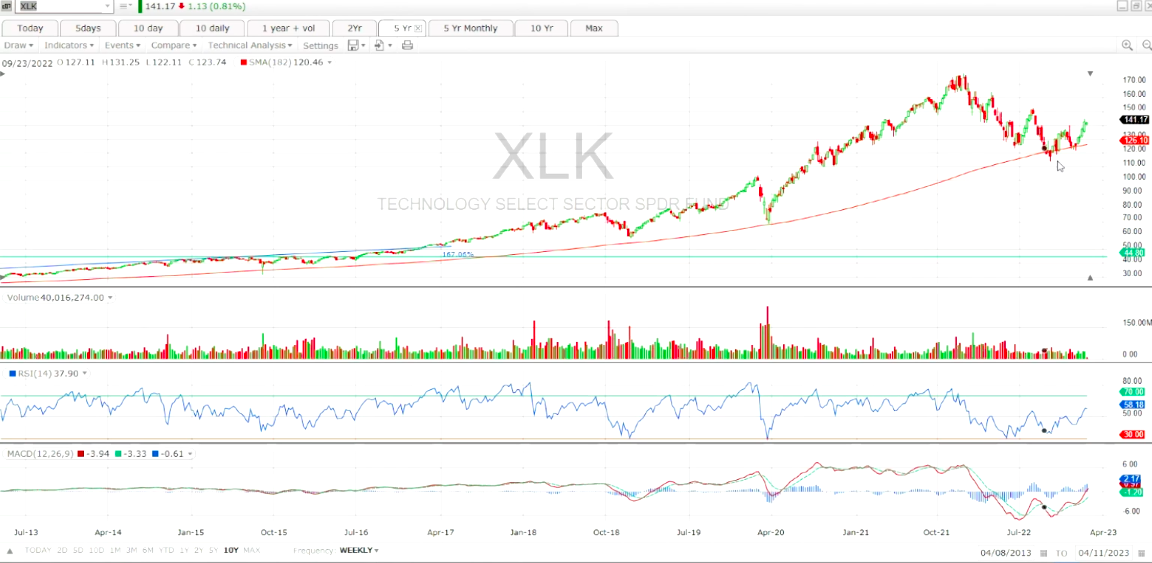
On the other hand, despite the improvement in the NASDAQ Index, the Information Technology sector (XLK) has yet to show much progress at all even tough it is holding the long term MA. As you can see in the Sector Oscillator table above
There are some exception with the Semiconductors
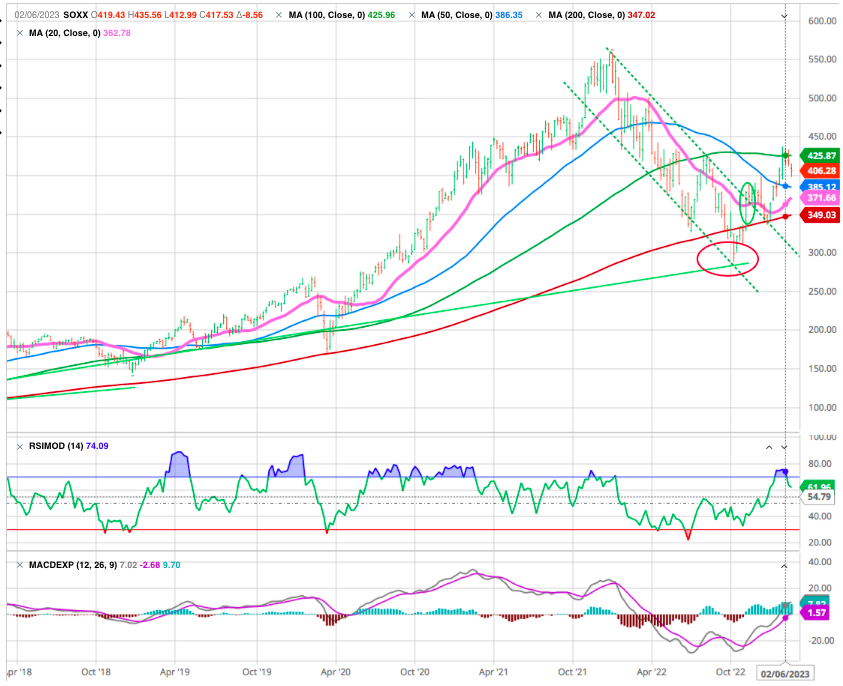
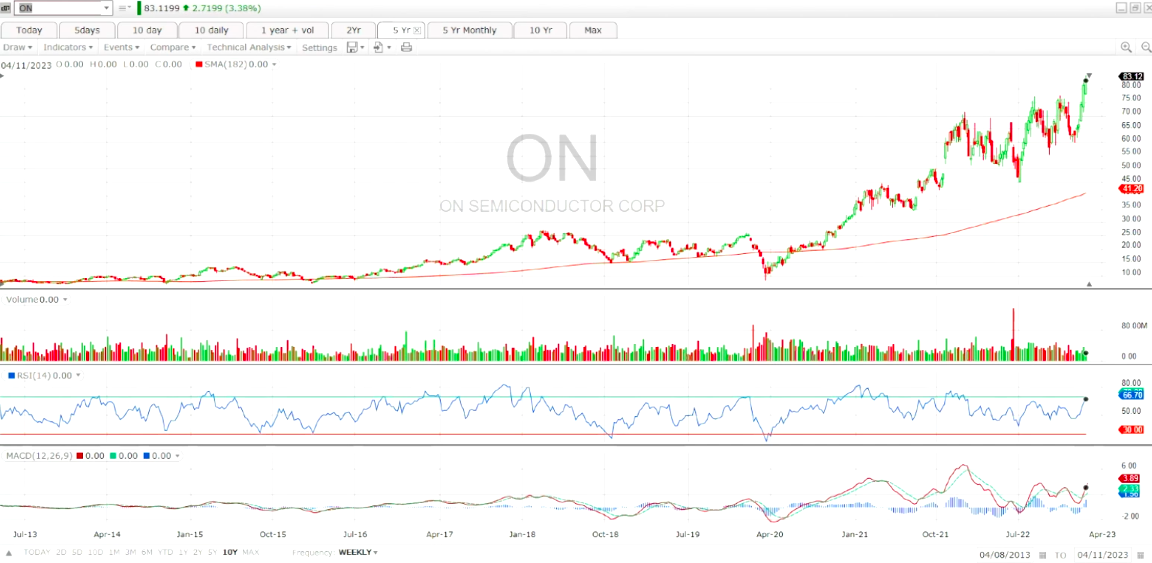
and our long time favorite On Semi
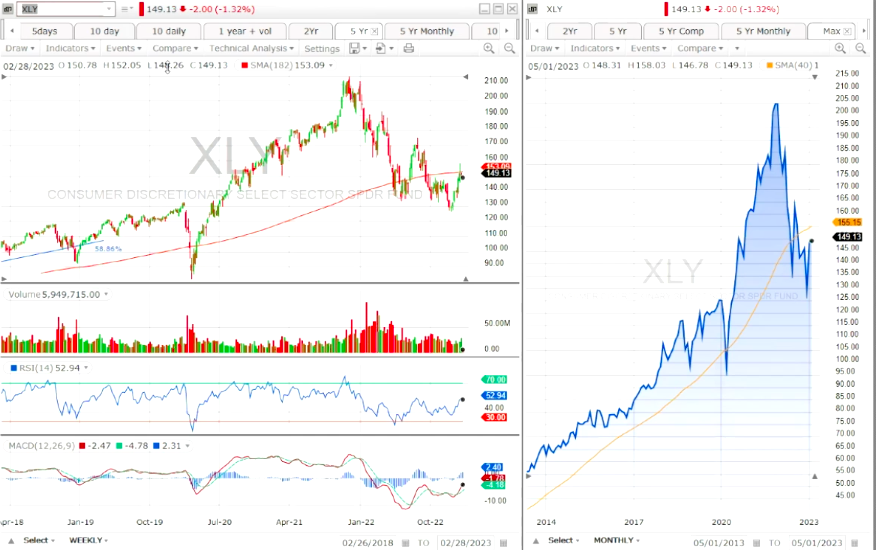
The Consumer Discretionary reacted strongly but clearly as tech the trend is down.
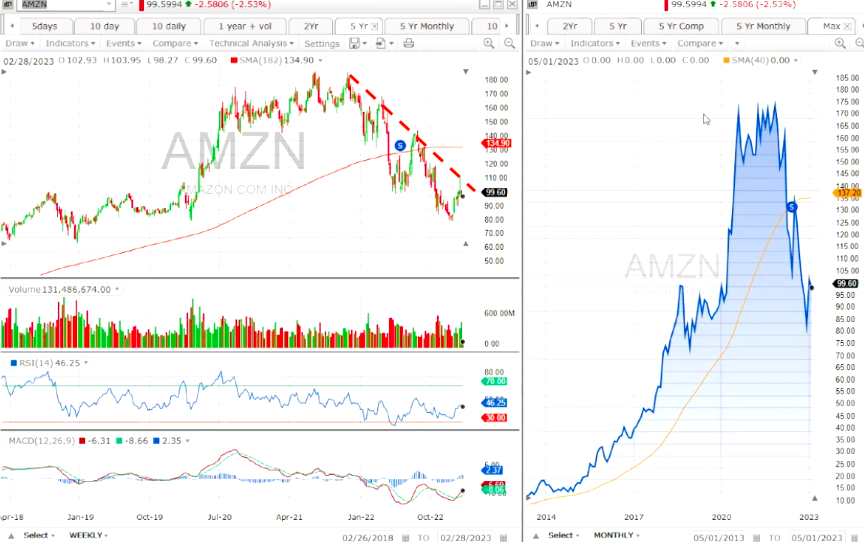
Among the stocks Amazon is a good example and we do not know where it could bottom. before taking any action we would wait to higher lows in the charts.
It’s a similar story for both Real Estate (XLRE) and Communication Services (XLC).
Let’s stay defensive
The complex web of headwinds, tailwinds, and crosscurrents is enough to make anyone’s head spin. And that isn’t just my opinion.
In recent months we’ve heard several of the world’s most successful investors admit that this is the most difficult macroeconomic and market environment they’ve ever experienced.
Given this great uncertainty, it’s not surprising that different analysts could have different outlooks for the markets going forward.
One of the most important lessons we have learned at Investlogic is that you don’t need to be able to predict what the markets or economy will do to be a successful investor. In fact, when uncertainty is high like it is today, trying to do so often only gets in the way.
Instead, most investors would do better with a more flexible or “tactical” approach – one that adjusts to market conditions rather than trying to predict them in advance.
That’s exactly our ambition at Investlogic and the way tools are designed to help you do.
They can help you identify the right assets to invest in, when to buy and sell them, and even how much money to invest in them. But they can also help you decide how much risk to take overall, no predictions required.
The signals tells us that risks are still relatively elevated, and conservative investors would be wise not to be too aggressive with new investments, focusing primarily on the healthy, high-quality, and low-risk companies and continue to avoid most high-risk, speculative companies.
CHECK our Investment Strategy & Asset Allocation
It’s a Big Investing World Out There – Don’t Overlook These Foreign Markets
- After more than a decade of underperformance, international stocks have recently offered significantly lower valuations than US stocks.
- Opportunities have arisen in Europe due to the continent’s renewed focus on energy independence and defense spending.
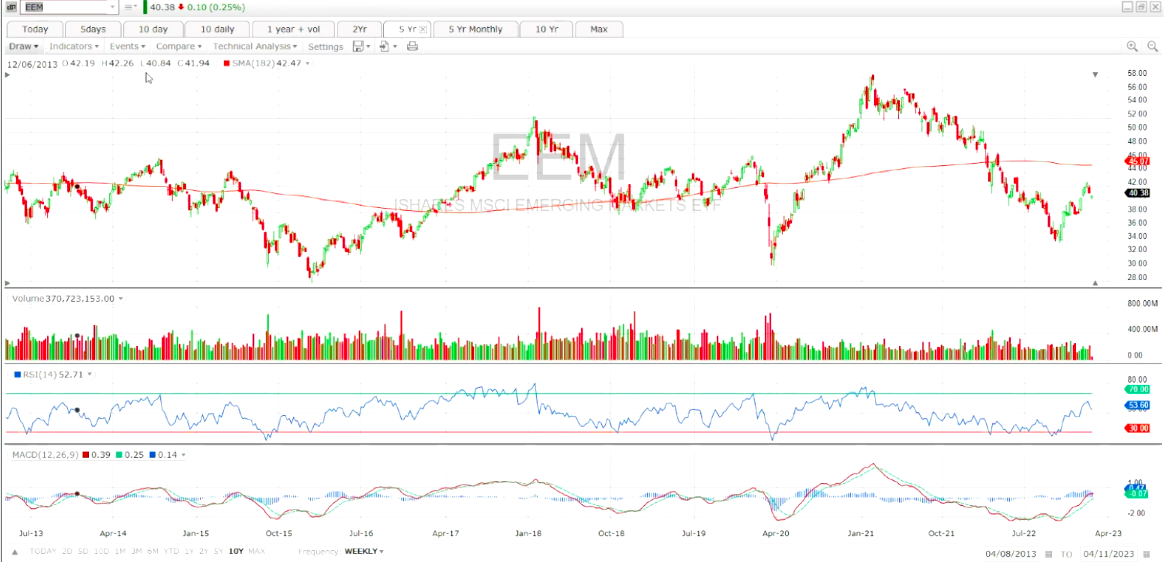
- Emerging markets could also be an attractive destination for investors, thanks to young and growing populations, plus valuations that are even lower than those in developed markets.
Our investment strategy to re-engage into foreign stock markets and more specifically in Emerging Markets has been confirmed looking at the charts.
See our Opportunities for Emerging Markets
Invest wisely and live richly.
Until next time.