The 200-Day Moving Average Rule of Thumb
October, 19 2022
Our Investment Strategy Tips
The 200 day moving average is just one of many helpful indicators. Expand your investor spectrum by reading our articles.
We developed in-house technical indicators such as the Decider, a multi time frame oscillator system or our ABS Allocator matrix related to the business cycle
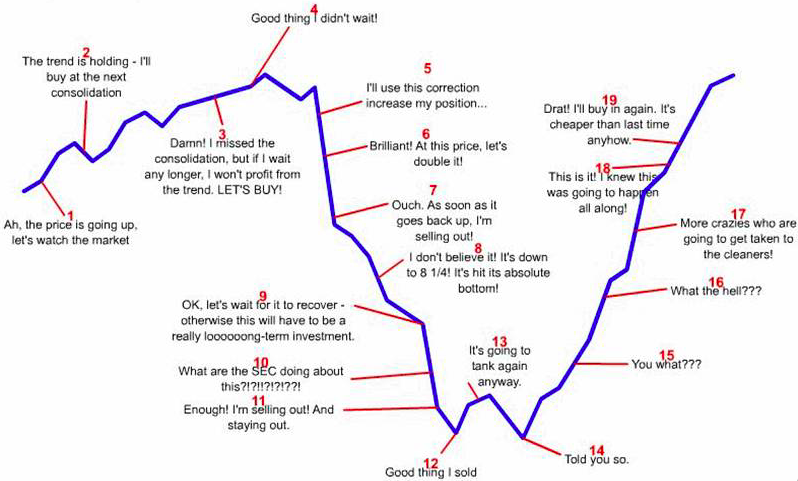
Don’t Get Emotional About Stocks, It Clouds Your Judgement
This timeless sage wisdom from Gordon Gekko is a favorite of ours. But we think it’s also an ideal recommendation for today’s challenging and uncertain markets.
Emotional investing is irrational investing. Don’t be an irrational investor. -check our company motto-
Far too many investment analysts specialize in a small handful of industries, or a particular area of the market like technology and growth stocks, and then narrow their scope further by only focusing on the long side (with no inclination or ability to go short).
As a result of this intense specialization, these analysts have a hammer that says “look for stocks in sector XYZ or industry ABC that might be a buy.”
It remains us of an observation made by Charlie Munger and others: “To a man with a hammer, everything looks like a nail.”
And because the hammer is the only tool they have, all opportunities look like nails — that is to say, the analysts only make long recommendations in the sectors or industries they favor, even when the broad market outlook is as bearish as it gets.
The 200-Day MA : “Do more of what’s working and less of what’s not.”
The 200-day MA covers roughly 40 weeks of trading, is commonly used in stock trading to determine the general market trend. As long as a stock price remains above the 200-day MA on the daily time frame, the stock is generally considered to be in an overall uptrend.
Often index or stock price will approach and bounce off the 200 day moving average and continue in the direction of the existing trend. Therefore, the 200 day moving average can be viewed as dynamic support or resistance.
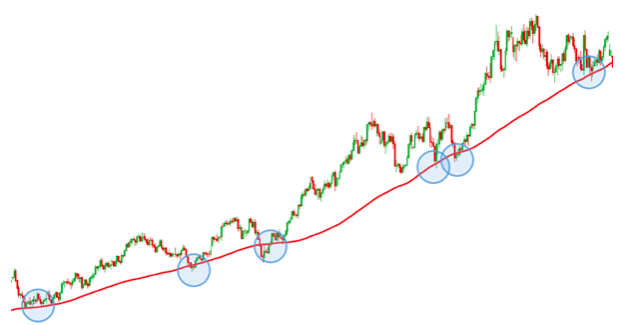
Traders will look to go long as price bounces off the 200 day moving average when the market is in an upward trend. Likewise, traders will look for short entries after price bounces from the 200 day moving average in a down trending market. Stops can be placed below (above) the 200 moving average in an uptrend (down trend).
The 200-day moving average is widely observed by investors and traders alike. Many consider it the ultimate dividing line between bullish and bearish territory, meaning that if a liquid asset is trading above its 200-day moving average, the asset should be given a bullish benefit of the doubt, whereas an asset trading below its 200-day moving average should be viewed with a bearish lens.
It isn’t clear why the 200-day moving average emerged as a bullish-bearish barometer and not some other length of moving average. But for whatever reason, it has become a kind of observational standard, like the QWERTY layout for Western keyboards.
It may have initially gained popularity because 200 days is a healthy length of time, representing about 80% of a trading calendar year (there are about 250 trading days in a given year). The 200-day period is long enough to cover a significant period of time but short enough to respond to trend changes (as the average will rise or fall on a lagged basis in line with the overall trend).
Using the 200 Day Moving Average as a Trend filter
One of the easiest strategies to incorporate with the 200 day moving average is to view the market in relation to the 200 day moving average line. Traders commonly do this to analyze the general market trend and then look to only place trades in the direction of the long-term trend.
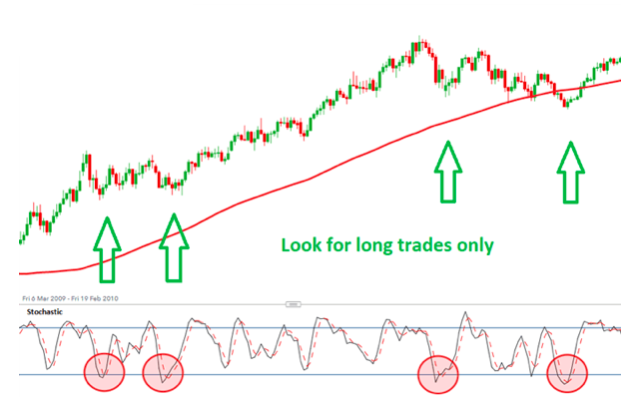
In the chart above, the market is trading above the 200 day moving average for a prolonged period of time. This means that the market is trending upwards and therefore, traders should only be looking for long entries into the market. (The example makes use of the stochastic oscillator however, traders should make use of an indicator or any other entry criteria they feel comfortable with.)
As a very long-term moving average, the 200-day MA is often used in conjunction with other, shorter-term moving averages to show not only the market trend but also to assess the strength of the trend as indicated by the separation between moving average lines. For example, comparing the 50-day MA and 200-day is relatively common.
In the event of the 50-day MA crossing to the downside of the 200-day SMA is referred to as a “death cross,” signaling an upcoming bear market in a stock, index, or other investment.
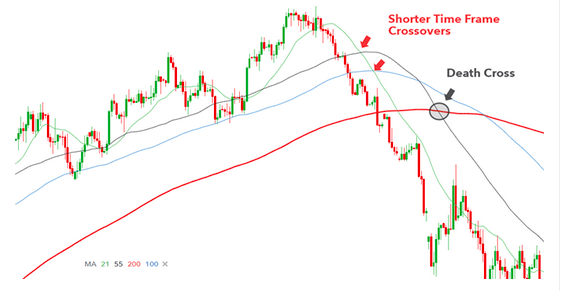
As a very long-term moving average, the 200-day MA is often used in conjunction with other, shorter-term moving averages to show not only the market trend but also to assess the strength of the trend as indicated by the separation between moving average lines. For example, comparing the 50-day MA and 200-day is relatively common.
The Rule: Don’t Buy Stocks Below the 200-Day Moving Average
You can guard against the above-mentioned danger with a simple rule of thumb: Do not buy stocks below the 200-day moving average.
The investor who says “no” to buying stocks below the 200-day moving average — not on a case-by-case basis, but as an automatic rule — accomplishes multiple things in a single step:
With this simple rule, the vast majority of stocks destined to lose money in a bear market are instantly ruled out. The analysts’ calls that result in losing money from buying sub-200-MA stocks are also ruled out.
This can save a significant amount of time by reducing the initial filter to a single question: “Is this stock above its 200-day moving average?” If the answer is “no,” the stock is a pass.
Saying “no” to stocks below the 200-day MA is an easy way to be humble. In order for a stock to fall below its 200-day moving average and stay there, other investors have to be motivated sellers. (If they weren’t, the price would not be below its 200-day in the first place.) Do you really know why the motivated sellers are selling? Perhaps they know something you don’t, or perhaps the stock has problems you
aren’t aware of. Saying “no” to sub-200 MA stocks is a way to say, “I don’t know why this stock is weak, but I’m taking a pass on the hidden risks.”
Focusing on stocks that are above the 200-day MA — the natural inverse of this rule — is a good way to keep one’s focus on winning sectors and industries.
(By the way, it’s interesting – and potentially telling – that these healthiest and unhealthiest sectors haven’t changed despite the big rally in stocks this summer. If the bear market was already over, we might expect a noticeable improvement in the underlying health of those worst-performing sectors by now.)
There are always industries that can do well even in the midst of the worst bear markets. There were stocks and industries that gained value in the 1930s in the midst of the Great Depression. What is a simple step for honing in on these industries? Paying attention to the 10% to 25% of stocks and industry groups trading above their 200-day moving average when 75% to 80% of the market is trading below.
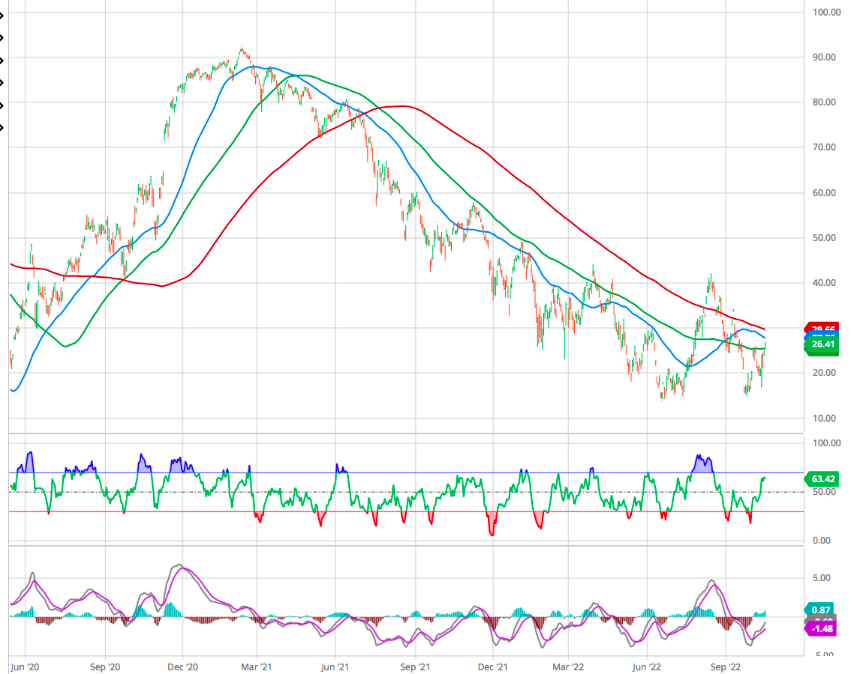
When there is less than 25%-20% of stock trading above the 200 MA it points to a probable oversold situation for the market or a sector indicating a probable (temporary) low.
The reverse is true for the 75%-80% of stocks trading above 200 MA, as you can see on the chart a top was made in Spring 2021 warning of a coming dangerous environment six months later(top in November 2021).
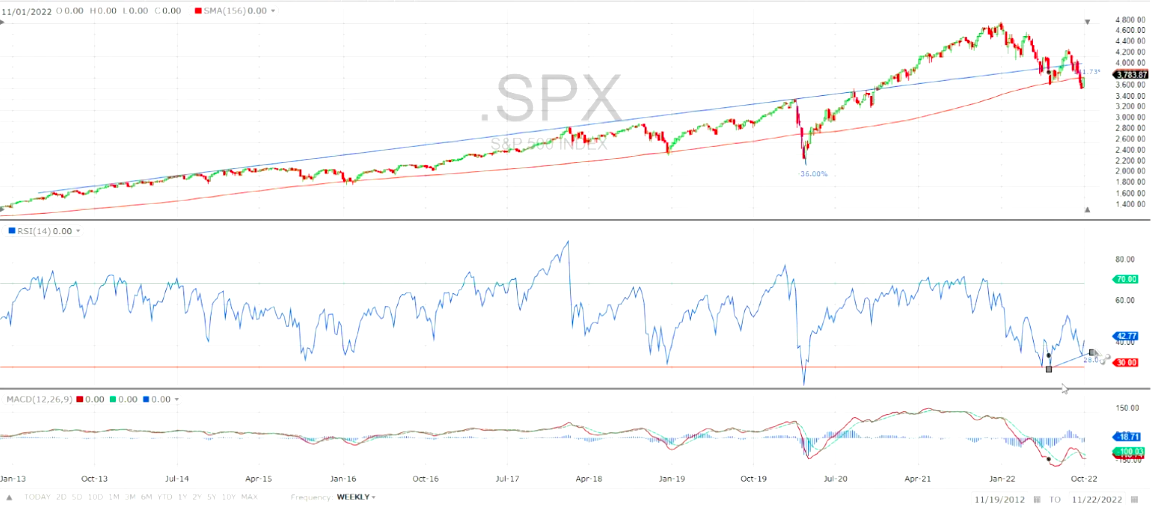
Long Term WEEKLY 200 MA
We prefer to use the 156 Weekly MA (3 -years) trending the 5 year business cycle.
For instance in our what are the charts telling us (10/06/2022) we noted : “The Weekly SPX tends to indicate that the next rally is a SELL as we broke the 156 days Weekly MA (3 -years) trending the 5 year business cycle. The RSI indicator points to some relief as we have a higher low in this last down leg, although weak. If we regain the 4000 level then we should review our position.”
Two Specialized Exceptions to the Rule
Are there exceptions to the 200-day moving average rule of thumb? Are there instances or scenarios where it makes sense to buy stocks below the 200-day?
The answer is yes, but the two main exceptions to the 200-day moving average rule each require specialized expertise:
- Value investors who are skilled at reading balance sheets can sometimes identify extreme values in the midst of bear markets. This is the equivalent of buying dollar bills for 50 cents, with classic examples being Warren Buffett’s purchase of Washington Post stock in the mid-’70s or Coca-Cola stock after the crash of 1987.
- Traders who are skilled at recognizing outlier price moves — for example, in the aftermath of a crash — can sometimes identify excellent reward-to-risk buying opportunities where the buy is accompanied by a defined risk point.
With the value investing exception, the key is knowing the intrinsic worth of a company’s assets, and having the conviction and staying power to hold the position as long as necessary.
Value investors with this kind of conviction can buy publicly traded companies at large discounts to intrinsic value — with quotations trading far below the 200-day moving average — because they know exactly what they are buying and why, and also because they have the fortitude to hold the position through adversity.
With the trading exception, the key is understanding the situation that caused the outlier price move, and also knowing the likely cause by which prices will rebound. Then, too, buying after an outlier price move requires a defined risk point for the position so the trader can exit with a limited loss if their analysis or timing is off.
Apart from those two exceptions — both of which require specialized skill sets — there is almost no reason to ever buy stocks below the 200-day moving average, in our view.
Of course you can always refer to some professional and consult our weekly reports.
By the way, the 200-day rule works well in bull markets too: If thousands of stocks are trading above their 200-day average (a normal state of affairs in bull market conditions), why buy the ones that aren’t?
You, as the investor, have no restrictions that require you to focus on stocks that are below the bull-bear waterline of the 200-day moving average, and you are the one putting your hard-earned investment dollars at risk.
200 Day Moving Average Indicator: A Summary
- The 200 day moving average is a widely adopted indicator showing the direction of the long term trend in any market
- Due to its mass adoption, the 200 day moving average can often be considered a self-fulfilling prophecy
- Traders use the 200 day moving average to filter trades in the direction of the long term trend and look for bounces off the 200 day moving average to inform trades.
Stay tuned


