

What Are the Charts Telling Us ?
October, 06 2022
Is this THE Low or A Low ?

No suspense : the bear market is not over yet.
It is a bit confusing. Actually the strong rally has been done is low volumes as the Yom Kippur celebration took place ended this Thursday. So we shall look carefully at the the trend today and tomorrow Friday !
As usual we analyse the long term charts with our favourite weekly indicators.
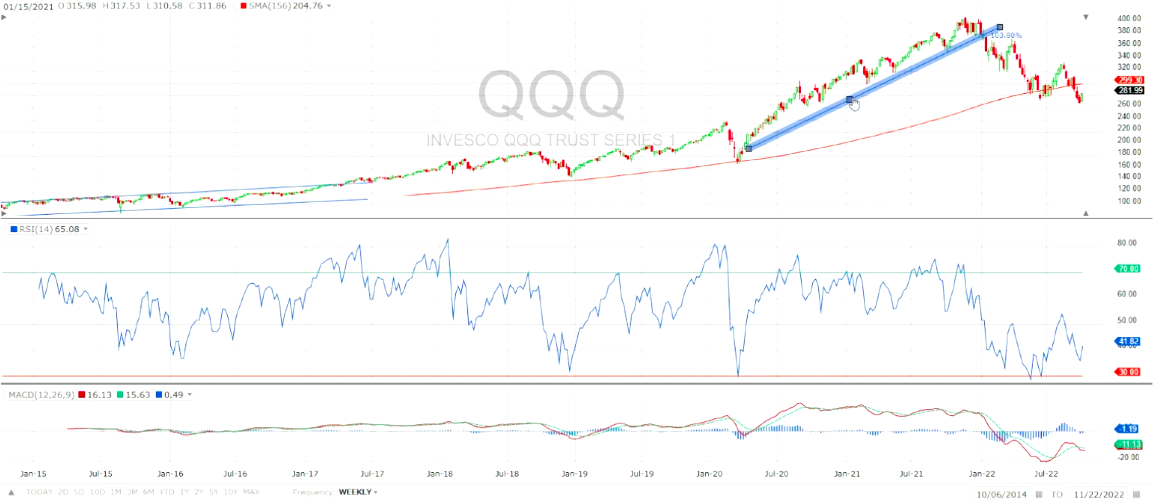
The Weekly SPX tends to indicate that the next rally is a SELL as we broke the 156 days Weekly MA (3 -years) trending the 5 year business cycle. The RSI indicator points to some relief as we have a higher low in this last down leg, although weak. If we regain the 4000 level then we should review our position.
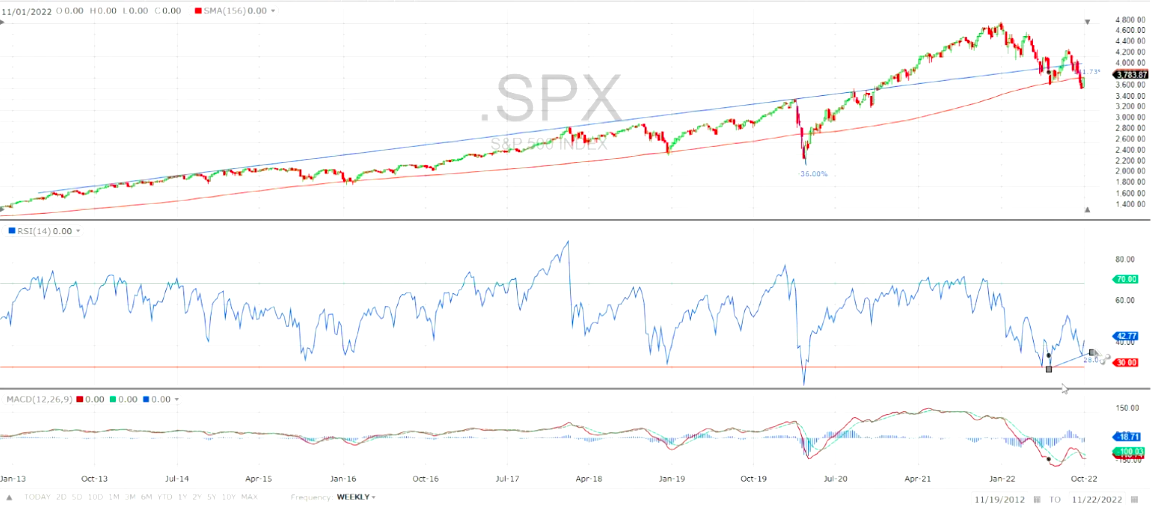
What we could advise if you want to play this counter trend move is to strictly manage your stop losses on your positions.
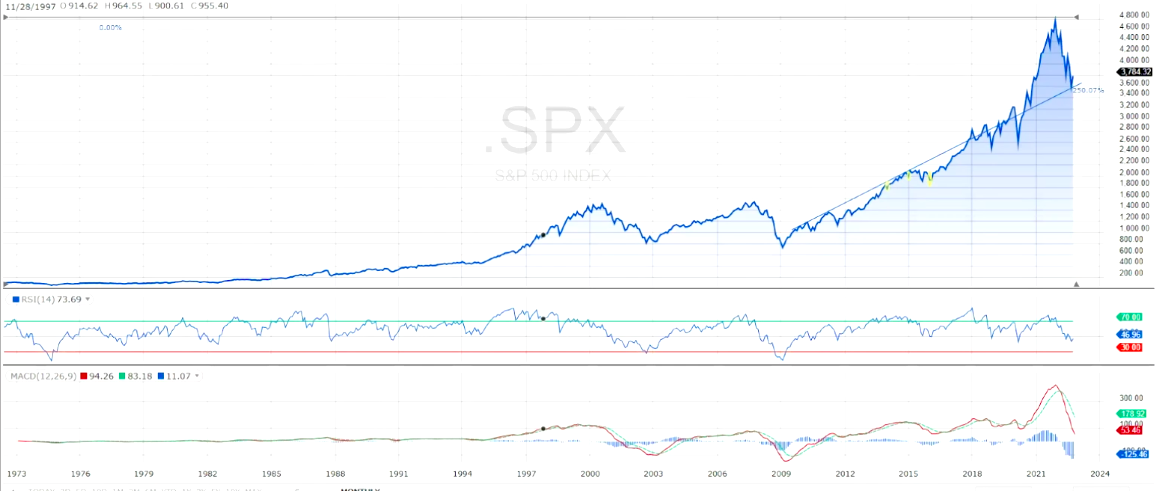
The monthly SPX shows the past 12 year up trend resistance is now acting as support BUT with a negative MACD screaming down and a still downside RSI. Actually, the 1984-2003 trend was mainly corollated to the baby boomers and then we had the huge run because of the FED and central banks easy money and the past-covid spark. We notice that approximately every five years we have a sell off, which is reflecting the economic cycle. We now experience a kind of “return to the mean” in a tightening FED monetary policy which will prevail for some times.
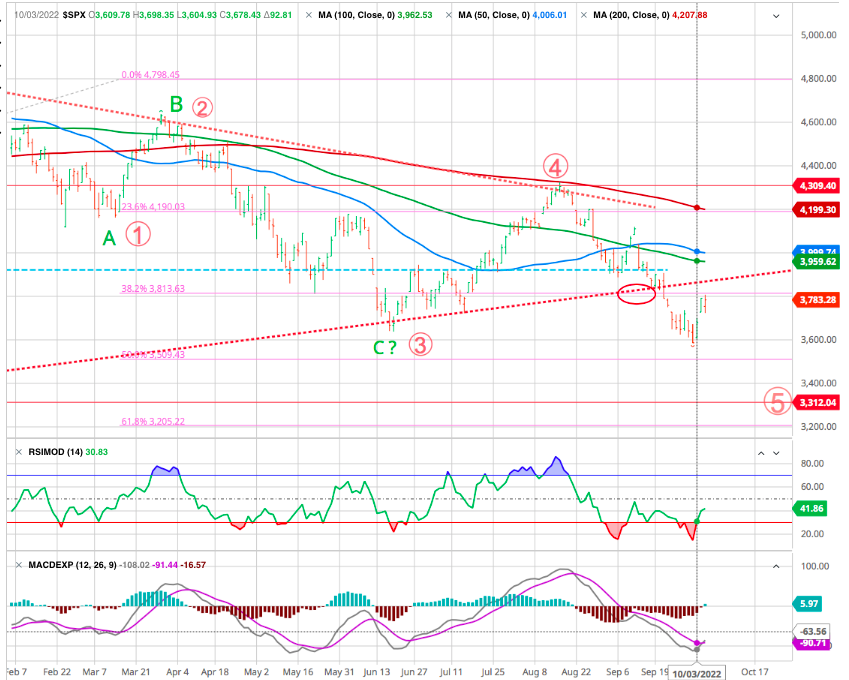
Daily we can see that all MAs are pushing down and there is not much hope to reverse the primary trend. The 38.2% Fibonacci retracement level offers a strong resistance and we continue to target the 61.8 % level (app 3200) on the SPX.
Same for the NASDAQ, the fibo 61.8% retracement has been tested again as some would believe that it is a double bottom. We do not.
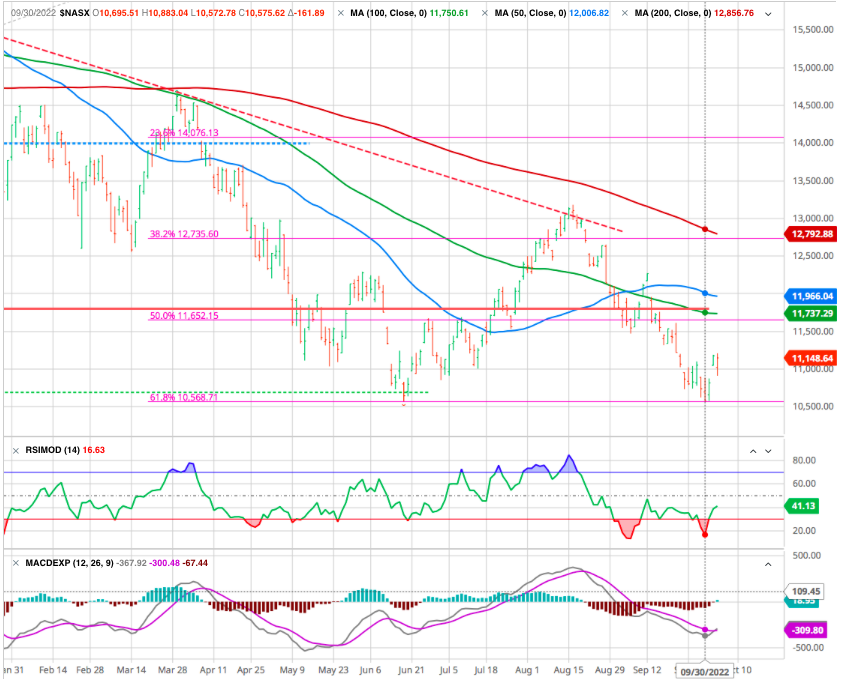
As for weekly indicators where clearly see now that the weekly MA156 is a strong resistance.
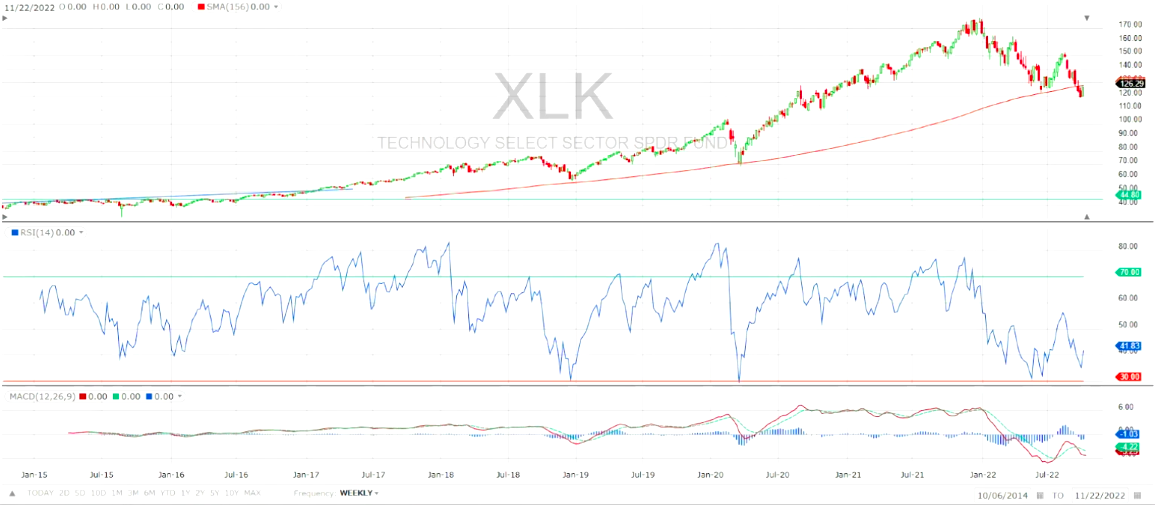
Looking at the sectors and the heavy weight for the Nasdaq we can see that there is a high risk for Technology (XLK) with MSFT and AAPL (now more like staples)
XLK weekly
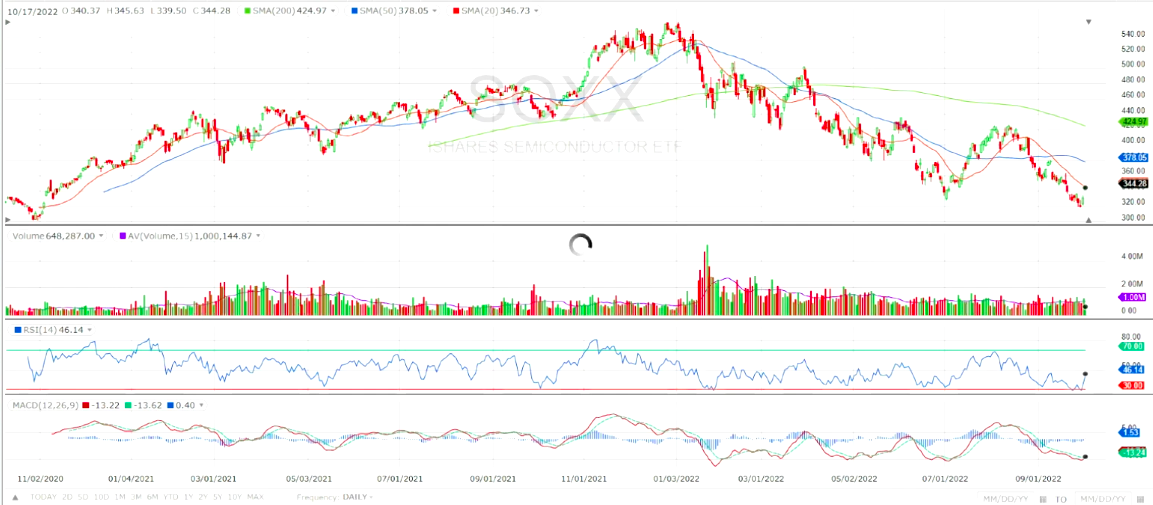
or semiconductors SOXX daily each MA is now resistance level.
Among other not looking great sectors which we would avoid are
Industrials (XLI) Basic Materials (XLB) Consumer Discretionary (XLY) (including TSLA and Amazon)
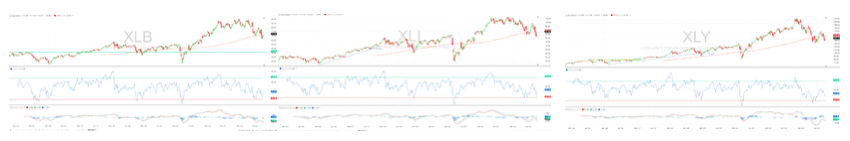
All of them broke their supports and are vulnerable.
Exceptions are the Energy Sector (XLE) and the Financials (XLF)
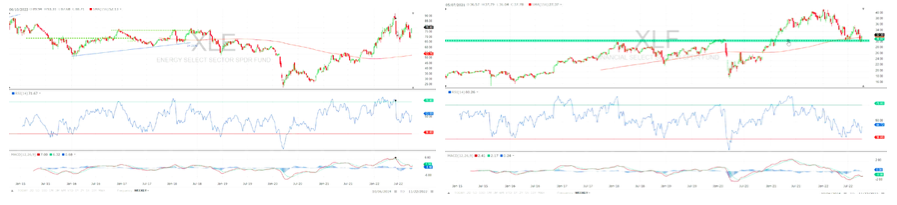
Energy had a strong set back in June but never the less it is still in an uptrend.
Energy sector has been leading the market higher in this recent bounce so far. XLE is up roughly 9.5% since Friday, compared to just 5.5% in the SPX. However, the Energy sector actually bottomed on Sept. 26 — four days prior to the overall market.
The stubbornly bullish fundamental outlook for energy prices — combined with the still-cheap valuations of most companies in the sector — suggested these stocks could outperform the overall market regardless of what happened next.
Financials show a strong support (formerly a multi year resistance). It remains positive but watch out if we break.
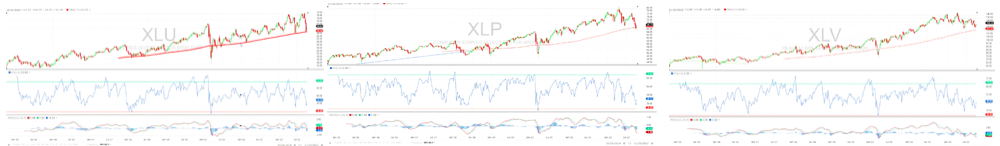
Among the traditional defensive sectors we have our usual Utilities (XLU) Staples (XLP) and Healthcare (XLV). The uptrend is still intact and the general environment should favor this defensives.
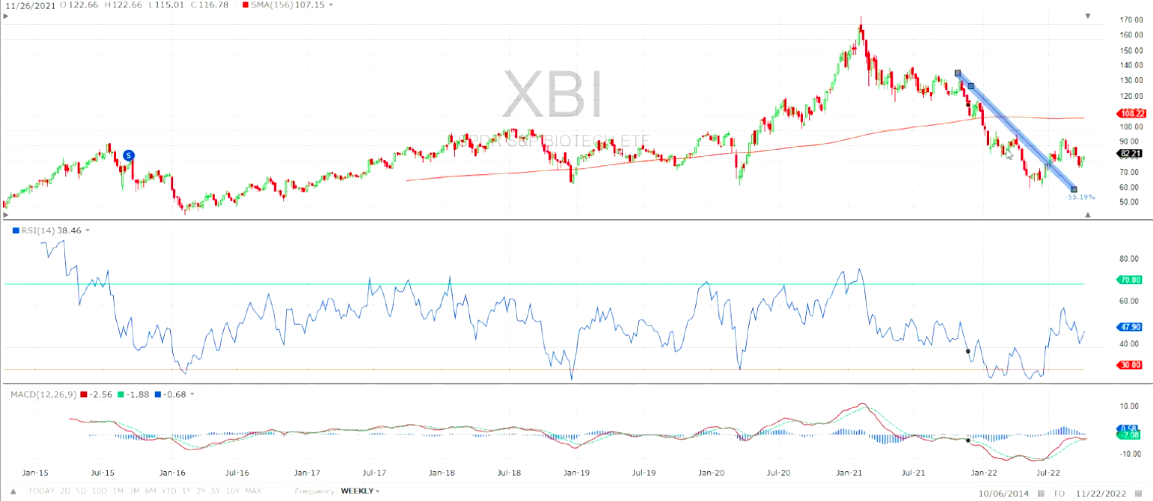
Among the health care related we also note the possible return of the Biotech (XBI)
The USD has the next resistance at 120 former high
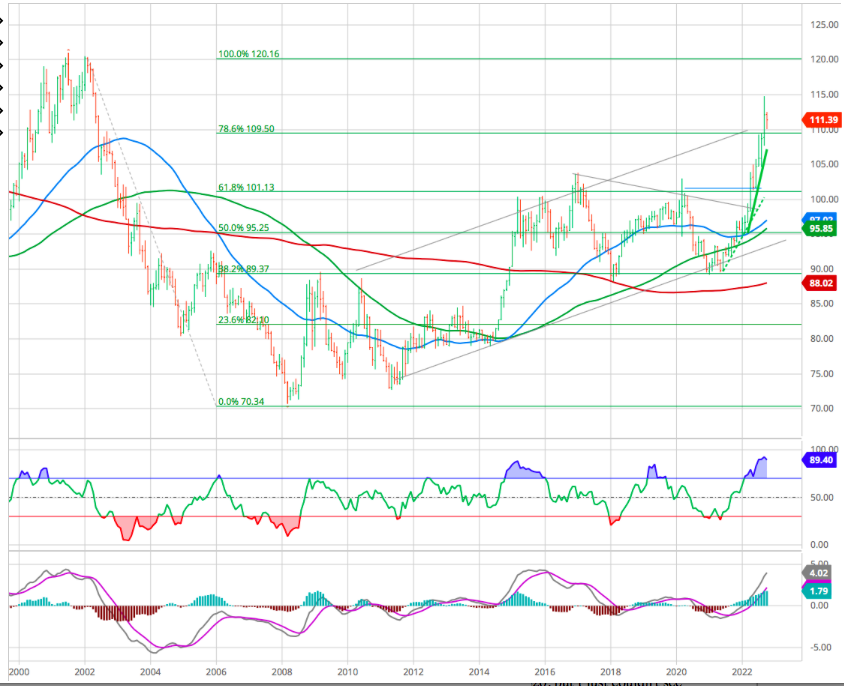
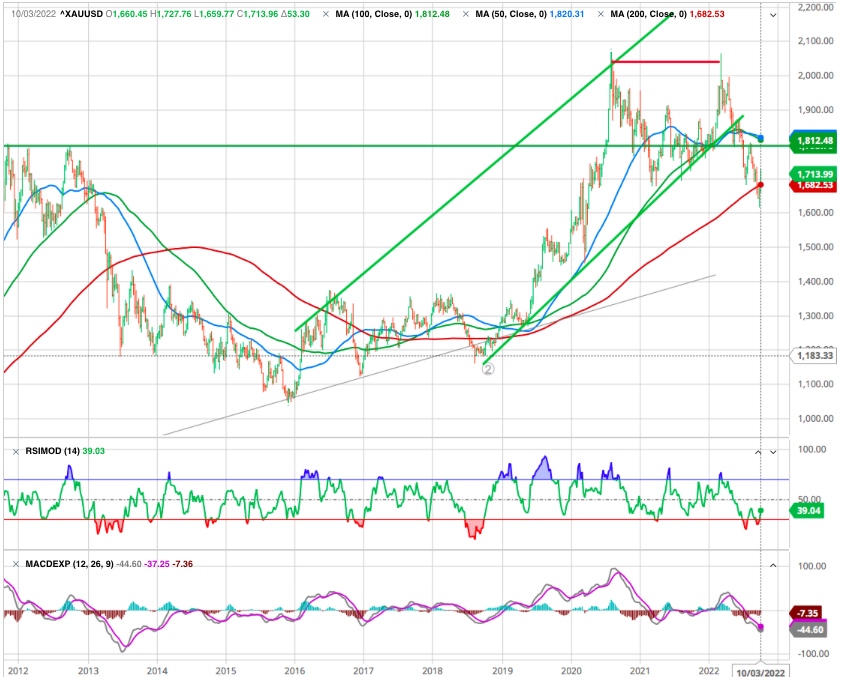
For Gold it means that as long as the dollar remains high the hedge for inflation will not work. The precious metal is clearly in a downtrend after it broke the Weekly 156MA (now a strong resistance) and at best we have a side way move.
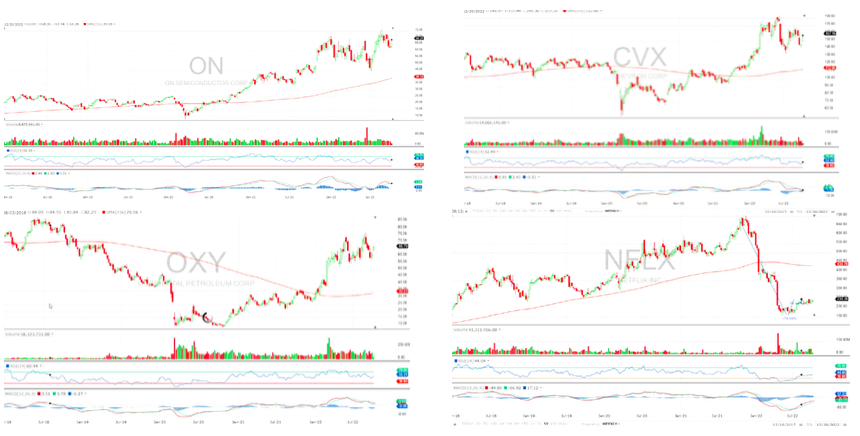
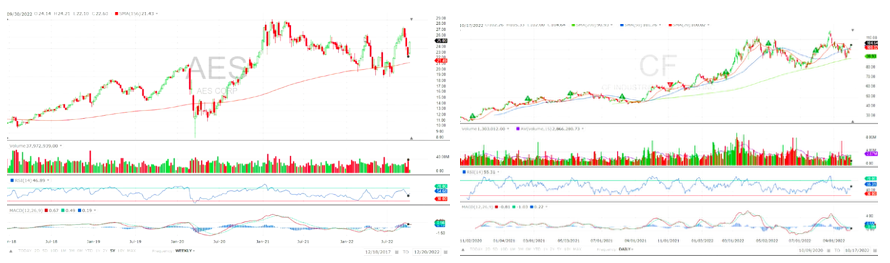
A selection of some what seem attractive stocks (we noted previously) but we would not recommend to buy them now !
ON semi (ON). Chevron (CHV) Occidental Pet (OXY) – Buffet strong position- and surprisingly Netflix (NFLX).
AES in Utilities and CF fertilizer
History suggests the next phase of the bear market is likely to bring a significant increase in volatility. We could see wild short-term moves — from gut-wrenching declines to violent rallies — as investor sentiment swings from fear to greed and back again.
Navigating this kind of volatility is incredibly difficult. In some ways, the sharp, short-term rallies are even more dangerous than prolonged bear market rallies like we experienced this summer. They can push even the most conservative investors to give in to “FOMO” (fear of missing out) and take on too much risk at precisely the wrong time.
We need to prepare for both these possibilities in the months ahead. In fact, we may already be facing the first such test.
The market’s move to new lows last week coincided with a noticeable uptick in bearish investor sentiment over the weekend. Rumors were circling of an emergency Federal Reserve meeting to be held on Monday. Those rumors were false. But given the recent surge in bearish sentiment, it wasn’t a big surprise to see the market rally sharply on Monday anyway.
It’s not yet clear if this move is one of those violent short-term rallies that will quickly be reversed, or the start of another multi-week bear market rally. Either outcome is possible. However, neither of these scenarios negates the longer-term bearish message from Friday’s close. The risk of further downside has risen dramatically. And I believe conservative investors should focus on capital preservation — protecting your hard-earned savings — above all else right now.
What would cause us to reconsider?
As we have warned our subscribers since the beginning, this bear market in stocks is likely to continue until at least one of the following criteria is met:
- The Federal Reserve stops tightening monetary policy and begins easing again
- We start to see the clear signs that have preceded long-term stock market bottoms in the past, including:
- Historically cheap broad-market valuations
- A “capitulatory” spike in volatility
- A peak in unemployment claims
- A significant decline in margin debt
Unfortunately, despite the big drop in stocks so far this year, neither is remotely true right now. And history suggests we’ll likely need to experience more market and economic “pain” before we do.
STRATEGY
In the meantime, as mentioned previously, capital preservation is critical. We can’t give individual investment advice, but our general recommendations include:
- Hold plenty of cash
- Consider a small allocation to gold (between 5% and 10%) on its weakness as “insurance” on your cash, if you don’t already own some
- Follow your trailing stops Stick to only the highest-quality, healthy stocks and assets ideally in positive sectors — if making new investments today
- Don’t risk betting against the market
AND STAY TUNED
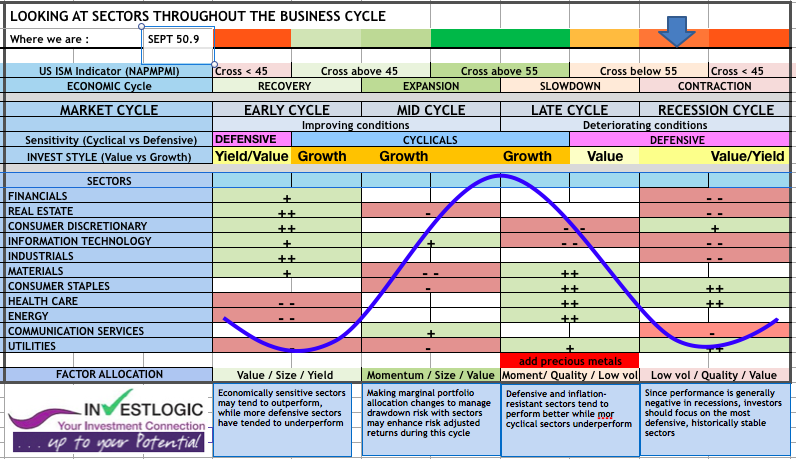
Heading toward Recession
The canary in the coal mine of the economy
The September Manufacturing PMI registered 50.9 percent, 1.9 percentage points lower than the 52.8 percent recorded in August. This figure indicates expansion in the overall economy for the 28th month in a row after contraction in April and May 2020. The Manufacturing PMI figure is the lowest since May 2020, when it registered 43.5 percent.
Our proprietary ABS matrix
The ISM Manufacturing report which fell from 52.8 to a post Covid low of 50.9. That is barely in expansion territory, the trend is not favorable.
Even worse, the forward looking New Orders component slid into contraction territory at 47.1. The New Orders Index returned to contraction territory at 47.1 percent, 4.2 percentage points lower than the 51.3 percent recorded in August. That foreshadows even lower economic activity in the manufacturing sector in months to come.
Please don’t forget that manufacturing is often called “the canary in the coal mine of the economy” as it often shows weakness first before it comes around to devastate the larger services sector.
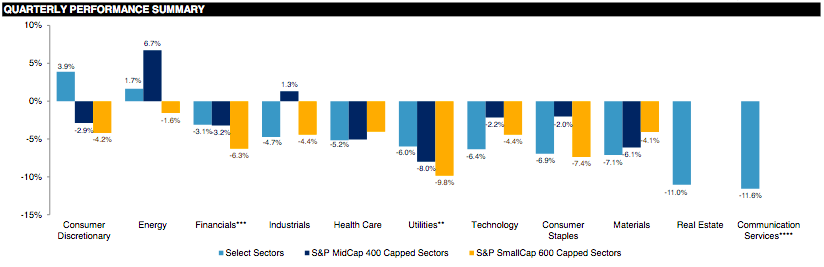
Q3 sector performance
Until next time