The Decider : The Market is always Right
January, 13 2022In order to comply with the precepts of the Tao we propose you an additional solution to achieve a new serenity in your daily investment life :
The Decider : multiple time frame oscillator system
After an extended period of unprecedented rise, the market is facing a more turbulent time with tougher economic conditions, Fed policy and pandemic oblige, hence probably choppier stock market conditions. It is crucial then to identify tops and bottoms which can be defined as market excesses. We propose to review our oscillator system – THE DECIDER-
Know when this bull market will peak
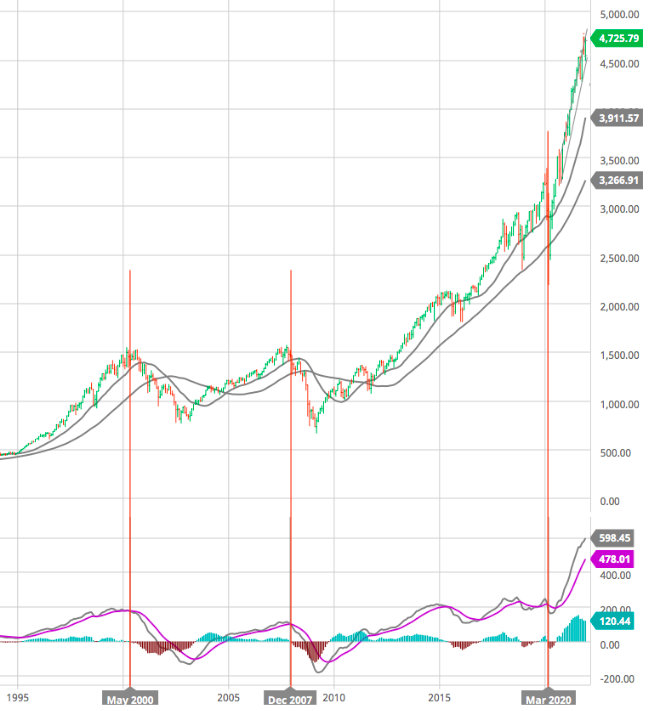
Below you can see the current monthly adjusted MACD chart for the S&P500 since 1995. You can see that the the blue line in the lower pane (MACD) has crossed below the red line. This results in a negative value for the relevant red bar in the histogram.
We had searched for the best occurence for a technical indicators which gave well-timed sell (buy) signal on the S&P500 -long term- at the last bull markets peaks in March 2000, October 2007 and March 2021.
We share with you our results regarding this indicator. We noted that the most reliable indicator on a monthly timeframe of 12/34/13 (which we monitor with our multiple time frame model). It returns a sell signal on May 2000 with a second market top in August 2000 and on December 2007 just two monts after the market peak. Finally we had a l.t. sell reversal on March 2020 right on the time of the flash COVID bear market.
Obviously we shall monitor carefully the next months and keep you updated.
Definition
We always say: “The Trend is your Friend”. While the intent is to emphasise trading with the trend, the ultimate goal is to be profitable. If you want to achieve it, one of the essential things to do is to time entries in the market and more importantly the exits out of the market, mainly because it is needed for the time frame you wish to trade on.
As we are in a high risk / high volatility period typical of some long term cycle changes about the fundamental forces that drive economic, financial, social environment and stock market returns. Even though it is challenging to predict the market over months and quarters or even a few years, we believe the cycle analysis definitely gives some clues to the direction of the economy, hence the markets.
For the purpose of achieving this goal, we developed over many years of research and experience an oscillators system for timing and to measure trend, stress and volatility within a given time frame. The term DECIDER uses a Multiple Time Frame and it is a process of looking into different time frames and aligning momentum, direction, and higher time frame trend. We conjugate several oscillators to measure the progression of action and reaction with different time horizons and various degrees of amplitude to correspond to the investor different time goals. Each element depends on the preceding one in a defined time horizon giving us visibility. Optimisation is given by the research of convergences over multi frequencies.
This is far from the “Random Walk” school approach. Although he short-term is somewhat random, market gyrations are the result of then-current circumstances and market forces wrestling stock prices around a gravity line of the broader cyclical trend. We combine our technical analysis and oscillator system approach within the more global Kondratieff cycles and Elliott waves theories, -and we shall describe them later, see our BLOG – such as objectives can be calculated. Moreover, expert traders use it in conjunction with Fibonacci retracements.
The system allows us not only to define oversold and overbought situation applied to a specific time horizon, but helps to identify the Elliott waves count, as well.
The Decider is based on the combination of different Moving Average Convergence Divergence or MACD indicators. The MACD turns two trend-following indicators, moving averages, into a momentum oscillator by subtracting the longer moving average from the shorter one, generally the 26-period Exponential Moving Average (EMA) from the 12-day period EMA. As a result, the MACD offers the best of both worlds: trend following and momentum generating trade signals with in-house set overbought/oversold areas. Blunt MACD gives hundreds of countless other traders a signal. But most signs (or all of them in reality) are lagging and they make incorrect signals. It depends on you to choose which timeframe matches you best.
Trades are designed to be taken in the reverse direction of the indicator. Namely, this means long trades for oversold readings and short trades for overbought readings. It must nonetheless be paired with other indicators (ie : RSI revised) and ideally other forms of analysis- see above-. It is more common for the indicators, to be used to decide -confirm or deny- a trade idea. We can also use the decider on multiple charting timeframes, from the 30-minutes time compression all the way up to the monthly.
MACD Elements
The indicators can give us good indications on :
- Trend Direction Indicator — to measure the strength of the current trend. That means there is a buy and sell signal. If the price trend is uptrend, the MACD area is in the positive zone or above level 0. While when the trend is downtrend, vice versa.
- Entry Indicator — determine the open position during the buy and sell counter. That means we can buy or be ready to sell the counter based on the signal that comes out.
- Momentum Measurement — measures current momentum. Momentum can be observed from the formation of the stems in the histogram. If it gets thicker it means the momentum is getting stronger, if it is getting thinner/smaller the momentum is weak.
- Oscillator — observing overbought or oversold condition. Meaning ready to sell when entering overbought, and ready to buy when entering oversold.
The MACD lines waver in and around the zero line. This gives the MACD the characteristics of an oscillator giving overbought and oversold signals above and below the zero line, respectively.

MACD vs. Relative Strength
In previous write-up, we’ve talk about the Relative Strength Indicator or RSI. RSI’ aims is to signal whether a market is overbought or oversold in relation to recent price highs and lows. Meanwhile, MACD measures the relationship between two EMAs. These two indicators are often used together to provide analysts a more complete technical picture of a market.
Both indicators measure momentum in a market, but, because they measure different factors, they sometimes give contrary indications. For example, the RSI may show a reading above 70 for a sustained period of time, indicating a market is overextended to the buy side in relation to recent prices, while the MACD indicates the market is still increasing in buying momentum. Either indicator may signal an upcoming trend change by showing divergence from price (price continues higher while the indicator turns lower, or vice versa).

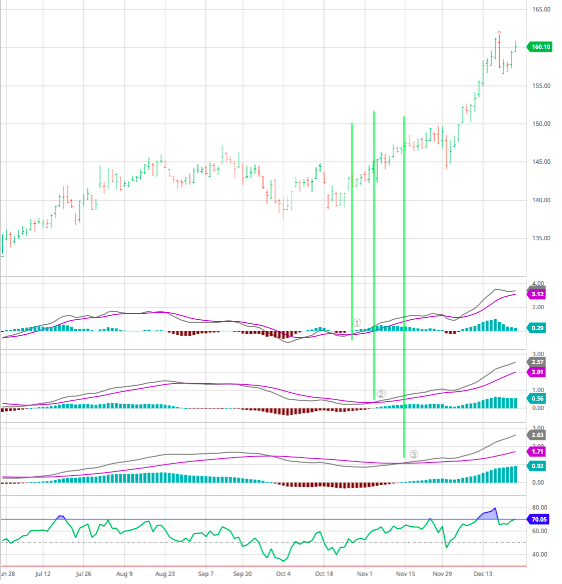
Procter & Gamble over 6 months (daily quotes)
Our indicator system shows 3 successive bottoms for PG early November confirming a main bottom. As for the time being the uptrend is still running .

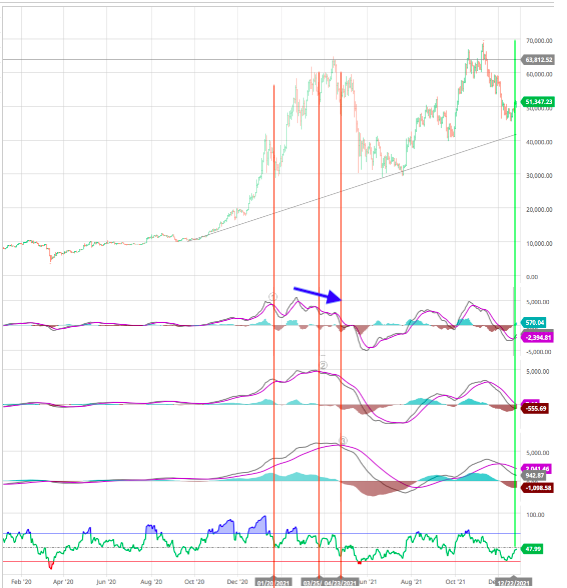
Bitcoin over two year (daily Quotes)
Typically in our system we identify 3 successive tops from end of January 2021 to mid April which confirm a major top (a wave 5), activating a selling process. In an uptrend, the MACD line will usually top out in the third wave of the final move up. And the MACD line will create lower highs as the price moves to the final high.

On the contrary this December 22 we have one first s.t. buy signal which could activate a Short Term buy, but note that the downside risk is not yet over as the other indicator do not show a bottom.
time this bull run peak !
Stay tuned


