

ABS – The Business Cycle Approach to Equity Sector Investing
December, 01 2021
It is for us the opportunity to share with you one of our strategic tool for our asset allocation :
Over the intermediate term, asset performance is often driven largely by cyclical factors tied to the state of the economy, such as corporate earnings, interest rates, and inflation. The business cycle, which encompasses the cyclical fluctuations in an economy over many months or a few years, can therefore be a critical determinant of equity market returns and the performance of equity sectors.
- The business cycle, which reflects the fluctuations of activity in an economy, can be a critical determinant of equity sector performance over the intermediate term.
- The business cycle approach to sector investing uses probabilistic analysis to identify the shifting phases of the economy, which provides a framework for allocating to sectors according to the likelihood that they will outperform or underperform.
- For example, the early-cycle phase typically is characterized by lower interest rates and a sharp economic recovery, which tends to lead to outperformance by the consumer discretionary and industrials sectors.
- Generating outperformance among equity sectors with a business cycle approach may be enhanced by adding complementary analysis on industries and inflation, as well as fundamental security research.
Based on Fidelity’s research on sector investing, we have developed this proprietary ABS matrix to guide us to the optimum investment opportunities in the prevailing economic environment (recorded as the US ISM indicator published each month) and according to various investment approaches based on style or sensitivity.
Allocation Business Cycle System -ABS-
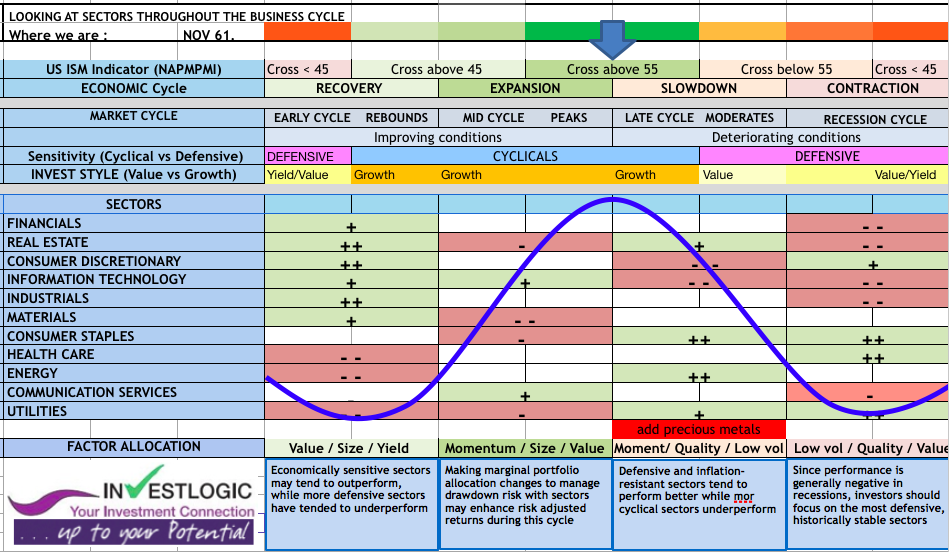
Note: The typical business cycle shown above is a hypothetical illustration. There is not always a chronological progression in this order, and in past cycles the economy has skipped a phase or retraced an earlier one. Source for sector performance during business cycle: Fidelity Investments (AART). Unshaded (white) portions above suggest no clear pattern of over- or underperformance vs. broader market. Double +/– signs indicate that the sector is showing a consistent signal across all three metrics: full-phase average performance, median monthly difference, and cycle hit rate. A single +/– indicates a mixed or less consistent signal. Returns data from 1962 to 2016. sectors are defined by the Global Industry Classification Standard (GICS®). Past performance is no guarantee of future results.
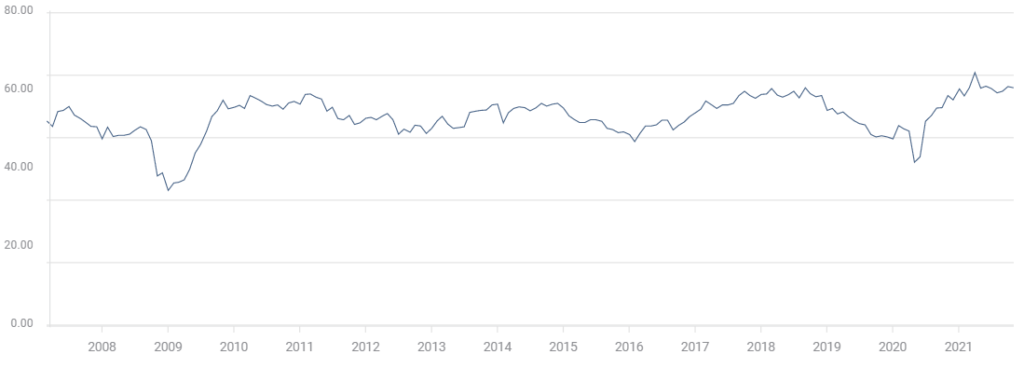
We identified that historically when the ISM indicator crosses defined levels (such as over or under 55 ) it generally corresponds to a developing economic environment. As we know the business cycle is often in advance on the announced statistics and the markets discount it even more. So we try to take this dynamic and combine it within each typical phase.
This approach could be applied either on each stock position to evaluate them in accordance with our investment strategy and / or to the sector or overall portfolio bias to monitor the tracking of our estimation of the business/market cycles and therefor eventually to update it.
Right now we are in the expansion period typically the longest phase of the business cycle. The mid cycle in the business curve is characterized by a positive but more moderate rate of growth than that experienced during the early-cycle phase. Economic activity gathers momentum, credit growth becomes strong, and profitability is healthy against an accommodative—though increasingly neutral—monetary policy backdrop. Inventories and sales grow, reaching equilibrium relative to each other.
It precedes the following period : late-cycle phase. Often it coincides with peak economic activity, implying that the rate of growth remains positive but slows. A typical late-cycle phase may be characterized as an overheating stage for the economy when capacity becomes constrained, which leads to rising inflationary pressures. While rates of inflation are not always high, rising inflationary pressures and a tight labor market tend to crimp profit margins and lead to tighter monetary policy.
Inflation bias
It’s possible that inflation will remain subdued over the long term, and this outlook appears largely priced into asset markets. However, there are dynamics at play that could contribute to ending the longstanding disinflationary trend in the U.S. Therefore considering a higher inflation rate for the coming year we can expect some minor changes.
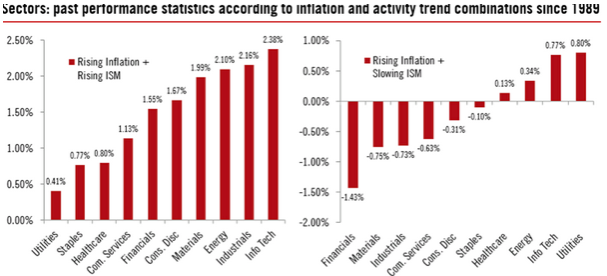
Source: FactSet; Pictet Trading Strategy;
As we can see on the left figure when Growth and inflation accelerate economically sensitive sectors still perform well. As the economy moves beyond its initial stage of recovery and as growth rates moderate, entering the mid-cycle phase, the leadership of interest rate-sensitive sectors typically has tapered. At this point in the cycle, economically sensitive sectors still perform well, but a shift has often takes place toward some industries that see a peak in demand for their products or services only after the expansion has become more firmly entrenched.
Nevertheless as observed on the graph, sector leadership has rotated frequently, resulting in the smallest sector-performance differentiation of any business cycle phase. No sector has outperformed or underperformed the broader market more than three-quarters of the time, and the magnitude of the relative performance has been modest compared with the other three phases.
 Information technology has been among the best performer of all the sectors during this phase, hving certain industries—such as semiconductors and hardware— that typically pick up momentum once companies gain more confidence in the stability of an economic recovery and are more willing to make capital expenditures.
We also expect the new communication services sector to outperform during the mid-cycle phase, largely due to the strength of the media industry at this point in the cycle.
From an underperformance perspective, the materials and utilities sectors have lagged by the greatest magnitude. Due to the lack of clear sector leadership, the mid-cycle phase is a market environment in which investors may want to consider keeping their sector bets to a minimum while employing other approaches to generate additional active opportunities.
However with a slowing economic environment and a higher inflation typically the sectors with some inflation hedge (defensive) become more in favour (right picture).
Actually, as the economic recovery matures the economy enters into a late cycle period, the energy and materials sectors, whose fate is closely tied to the prices of raw materials, perform well as inflationary pressures build and the late-cycle economic expansion helps maintain solid demand.
Elsewhere, as investors begin to glimpse signs of an economic slowdown, defensive-oriented sectors— those in which revenues are tied more to basic needs and are less economically sensitive—generally have performed well. These include health care, consumer staples, and utilities. Looking across all three analytical measures, the energy sector has seen the most convincing patterns of outperformance in the late cycle.
Information technology and consumer discretionary stocks have lagged most often, tending to suffer the most during this phase, as inflationary pressures crimp profit margins and investors move away from the most economically sensitive areas.
In our European sector allocation, our overall positioning is tilted toward Cyclicals over Defensives. We like being more geared to the economic recovery, and Cyclicals are now trading back at a discount compared to Defensives in Europe. Within Cyclicals, our preference is for companies tilted to corporate and government spending (Industrials, Construction & Materials and IT) over those geared to consumer-related sectors (both Consumer Discretionary and Staples). We Overweight Financials
Conclusion
Like any other approach, our business cycle approach has limitations and requires adept interpretation in order to use the framework appropriately as part of an investment strategy. For example, identifying the current phase of the business cycle determines the underlying trend of economic activity, but that trend can always be disrupted by exogenous shocks, such as pandemics, natural disasters, geopolitical events, or major policy actions.
Incorporating analysis and execution at the industry level may provide investors with greater opportunities to generate relative outperformance (“alpha”) in a business cycle approach. Industries within each sector can have significantly different fundamental performance drivers that may be masked by sector- level results, leading to significantly different industry- level price performance (see factor approach). In addition, there are other strategies that can be incorporated to complement the business cycle approach and potentially capture additional alpha in equity sectors.
Gold has performed in periods of rising inflation, regardless of the evolution of the ISM gauge. However, the combination of rising inflation and a slowing ISM gauge has been the best environment for it, with an average monthly performance across such periods of 1.72%:
Investment implications
Every business cycle is different, and so are the relative performance patterns among equity sectors. However, using a disciplined business cycle approach, it is possible to identify key phases in the economy, and to use those signals in an effort to achieve active returns from sector allocation.
For our part, we stick with the lead sectors selecting quality names among them. And be prepared to switch to more defensive-inflation hedge exposure. Follow us for more portfolio selection.
Stay tuned