

MARKETSCOPE : WINTER IS COMING
September, 05 2022
If Everyone Is Thinking The Same, Then No One Is Thinking
Markets go in cycles, and so does nature.. After the Fall season, Winter is coming. The arrival of the often-dramatic months of September and October for markets has seen far more than its share of stock market drama, and the gathering number of economic and geopolitical catalysts for volatility will require close scrutiny by investors over the next few months.
Everybody has been wrong more often than they have been right since COVID. In terms of forecasts, the rate at which economic data has been coming in weaker than expected recently hit its highest level over a trailing two-month period than all but one other period in the last 22 years.
After having just told you how everyone has been wrong on everything for the last two years, you may be thinking to yourself, what do they know that everyone else doesn’t? We don’t have a crystal ball either. Our approach now is the same as it always has been and that’s to listen to what the market is saying.
 Financial markets gave ground last week, with fears of further tightening of central bank monetary policies with the spike in inflation in the Eurozone. The ECB is expected to hike rates 75 basis points after recent remarks from members turned more hawkish, although there is still some speculation of a 50-point increase.
Following the record inflation print of 9.1% YoY Wednesday, and Gazprom’s announcement that it will not re-open the Nord Stream pipeline after scheduled maintenance due to a reported leak, concerns continue to ramp-up around how Europe will manage the crisis as winter approaches.
Shares in Europe fell sharply on fears that central banks could tighten monetary policy aggressively for an extended period. Worries that Russia might stop natural gas supplies to Europe also weighed on sentiment. After the market closed on Friday, Gazprom announced that a technical fault would extend the pipeline’s closure.
In the US investors digested non-farm payrolls (NFP) report data coming in line with estimates (the additional jobs number of 315,000 in August) was touted by many as something of a ‘Goldilocks read’, a retooled ADP report that showed less-than-expected jobs were added in August, a stronger-than-expected ISM manufacturing PMI readout (SEE our ABS MATRIX below) and an unexpected increase in the unemployment rate. All pointing to the Fed keeping its aggressively hiking interest rates to fight inflation.
The S&P 500 along with the broader market also took a hit from semiconductor stocks which fell after the U.S. prohibited Nvidia from selling some of its products to China.
The dollar hit a 20-year high. The greenback is globally taking advantage of its safe haven status to drain purchases, which have driven the Dollar Index to the doorstep of 110 points for the first time in twenty years.
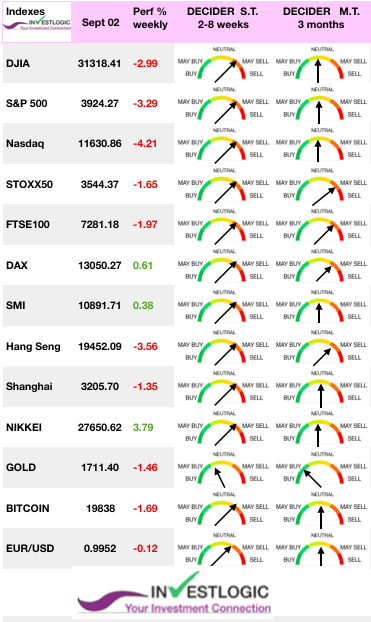
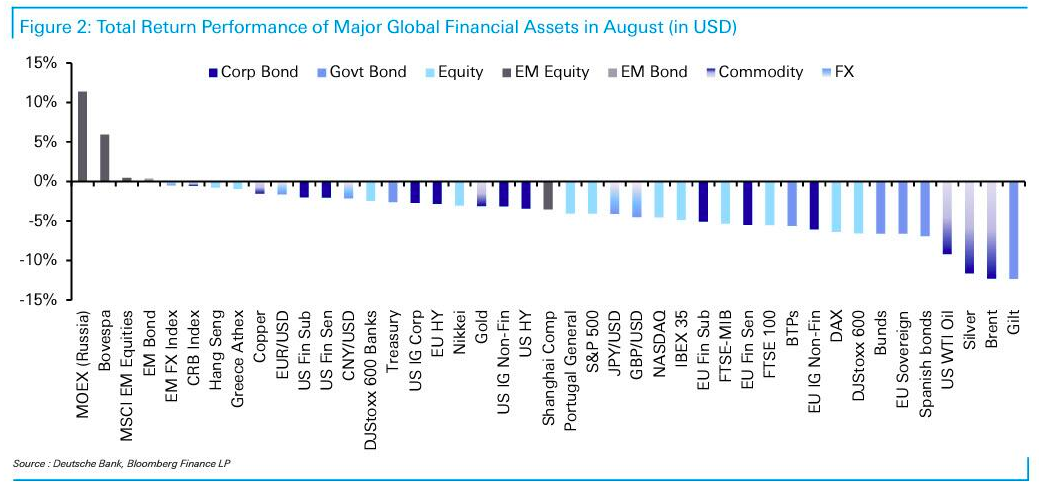
Assets August perf
ABS MATRIX : Stay Defensive
The US ISM Manufacturing survey was flat at 52.8 from July (better than the 51.9 expected).
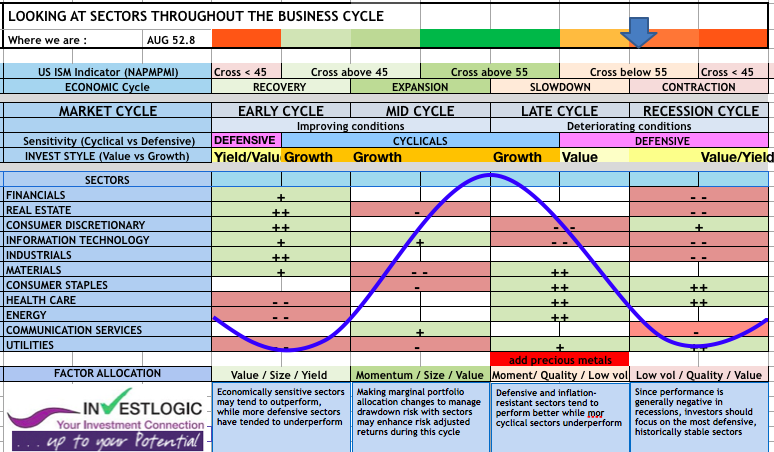
Check Allocation to Business cycle System
Business actvityin the US, Europe and Japan fell in August,according to new surves, pointing to a sharp slowdown in global economic growth as higher prices weaken consumer demand and the war in Ukraine scramble supply chains. US companies reported a sharp drop in business activity in August in a broad-based decline led by services and manufacturing slowed as well.
S&P Global’s Manufacturing surveys for August have not been pretty. Turkey, Italy, Germany, UK, the Eurozone aggregate, and Canada all printed below 50 this morning (in contraction) but US Manufacturing was expected to hold at 51.3 and it did. However, the final August print of 51.5 (small improvement over the flash print) is the weakest since July 2020.
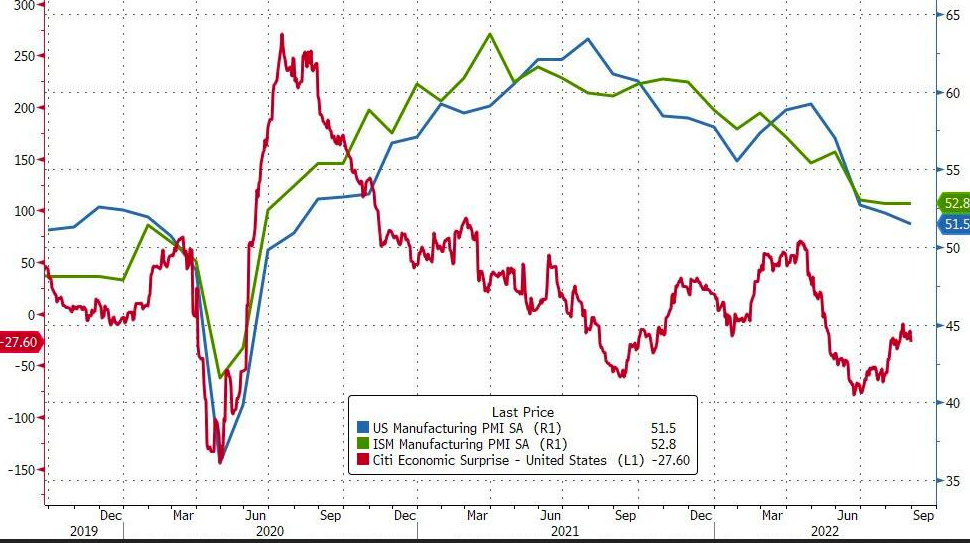
Finally, we note that barring the initial pandemic lockdowns months, this is the steepest downturn in US manufacturing seen since the global financial crisis in 2009.
Many factors were successful in attenuating the S&P 500’s losses in the first six months of the year; some even outperformed the bond market.
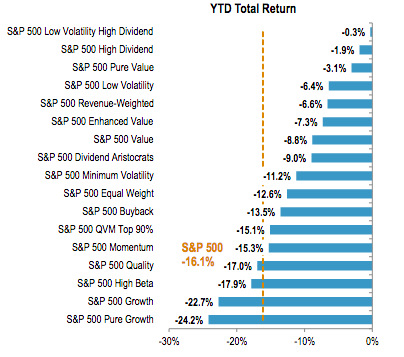
To put a defensive plan into action, look for stocks with strong cash flow, low (or at least manageable) debt, and pricing power. You’ll find many of these stocks in the consumer services, health care, and natural resources (energy and materials) sectors. And select technology stocks may also make the cut.
MARKETS : “Good News Is Bad News” Dynamic Doesn’t Last Much Longer
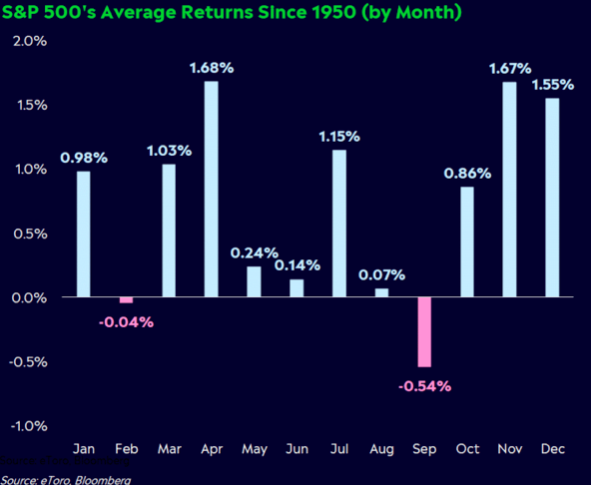
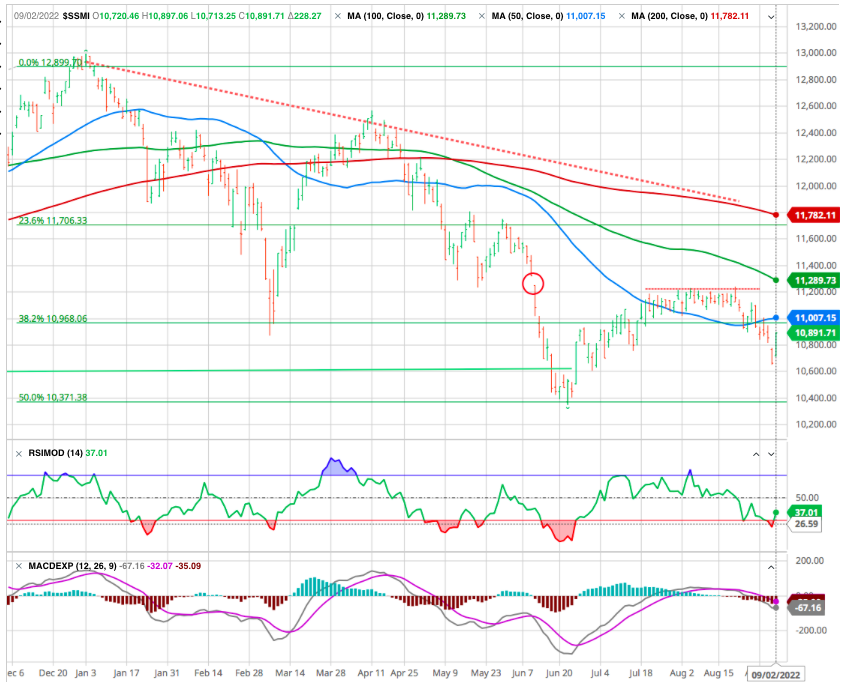
As we stated the week before the rise from the July lows was a “bear market rally” and nothing else. Furthermore, the month of September offers little hope. October tends not to be kind, either.
That was the case as the market sold off sharply all week, taking out the important 50-day moving average. After failing to take out its 200-DMA, the 50-DMA provided no downside support, making the prospects of another upside test of the 200-DMA at any point in the near future less and less likely. On Friday, the market attempted a test to break above the 50-dma, but failed. With the MACD on a “sell signal,” we continue to suggest selling any rallies to reduce risk.
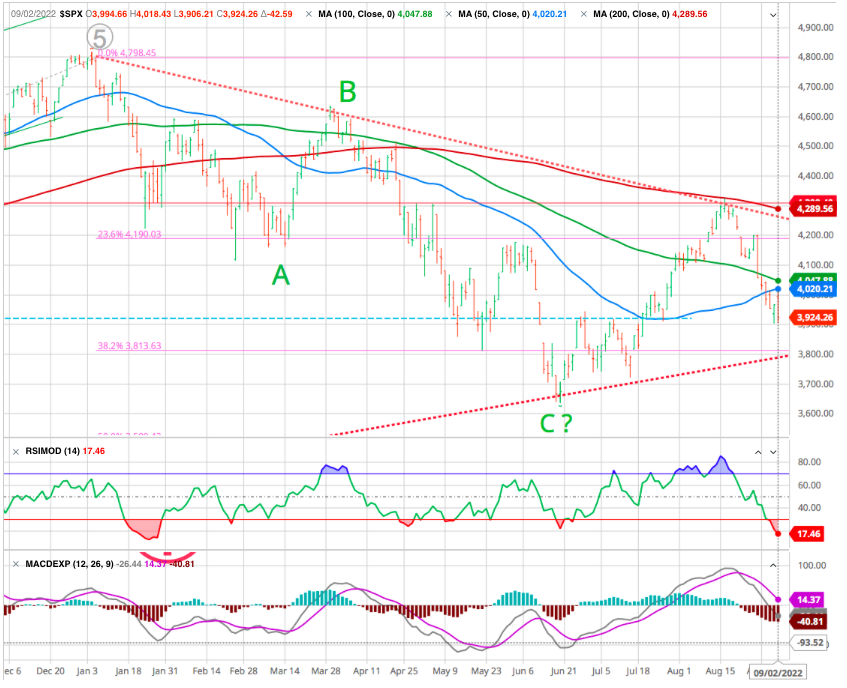
Making matters worse, Friday’s rally stalled out right at the 50-DMA. As of mid-day Friday, the S&P 500 was already over 7.5% below its 200-DMA, and the one hope for bulls at this point is that the trendline from the June lows hold.
Moreover the “monthly” candle chart is creating a very big bearish reversal. This reversal also comes after the index briefly poked above (retested) the 23.6% Fibonacci level. A reversal of this magnitude creates a lot of overhead supply (areas where trapped investors will sell to break even). In any event, this reversal is bearish and active investors should use caution over the come weeks/months.
The picture for the Nasdaq looks very similar to the S&P 500. While the 200- DMA was never even tested, it turned down right at its trendline from the highs late last year which also corresponds to a 50 % Fibonacci retracement of the primary down wave and is now more than 10 %below its 200-DMA.
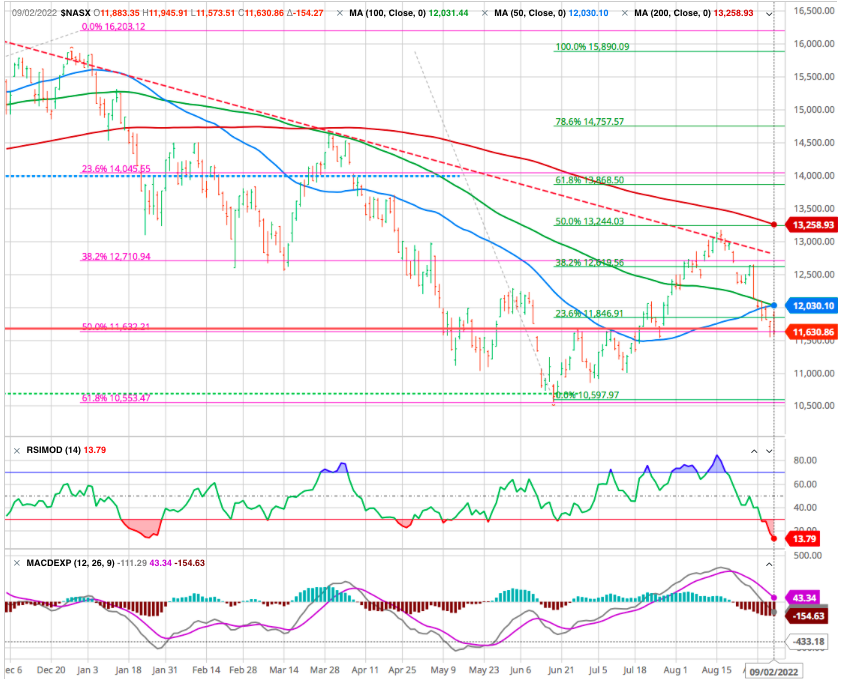
Like the S&P 500, the one hope from here is that the trendline from the June lows hold.
As monetary policy becomes more restrictive and high inflation erodes economic growth, the market will have to reprice for lower sales, margins, and earnings. As such, if we are indeed in a “bear market” and not just a “correction,” then we have more work to do.
Sectors : Energy and Utilities lead the way
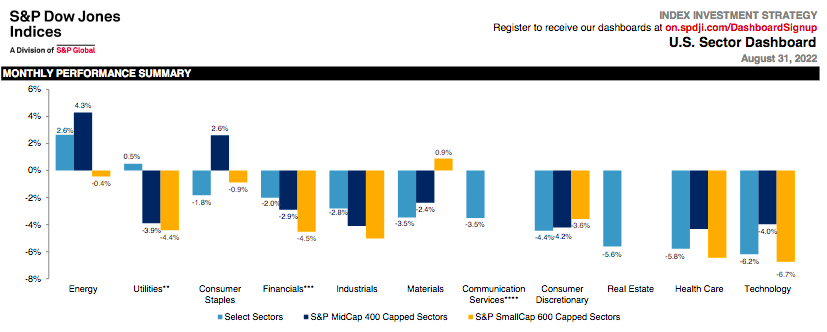
On a sector basis, the energy and materials sectors remain well oriented. The consumer staples sector has strongly also participated in the rebound and most of its members are trending upwards. The staples may offer the best combination of breadth and percentage of up trending stocks.
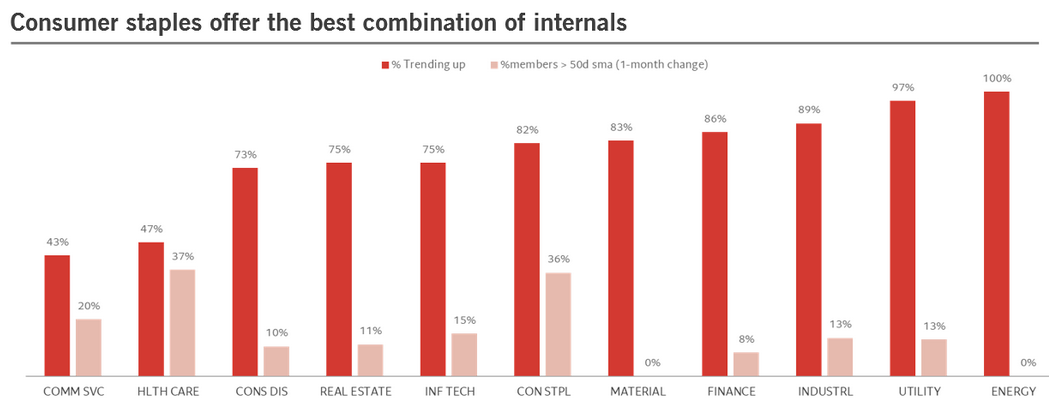
On the other hand, the energy and materials sectors still have the highest percentage of stocks trading above their 50-day SMA.
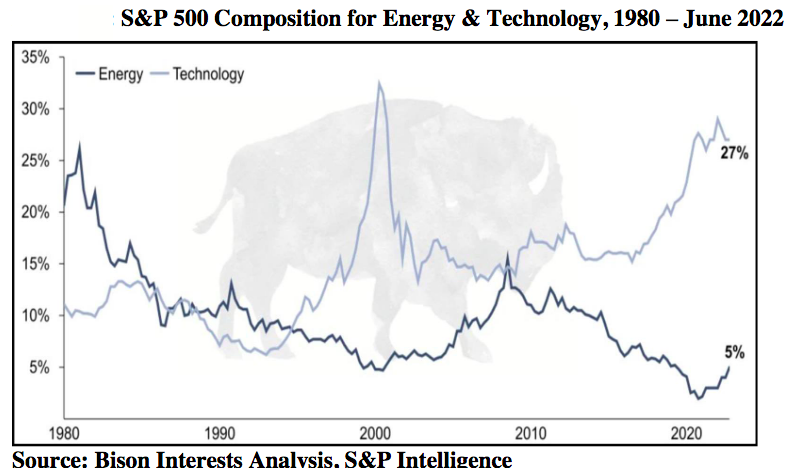
Another reason for holding energy stocks is that their weighting within the S&P Index is extremely low by historical standards
As a result, we favor defensive stocks (i.e., healthcare and staples, those sectors that also tend to outperform in a bull steepening regimes) and at the expense of cyclical stocks, and we think a “sell-the-rally” approach is likely to remain the name of the game – for so long as recession risks don’t ease, the Fed holds its course.
A chart for the bears
The current equity market price action has been following that of 2008. In that year, the rebound (that we might compare with the summer rally) proved to be another bear market rally and thereafter prices continued to drop until 2009. The 2-year correlation between that and the current price action is 0.91 – which is the highest found.
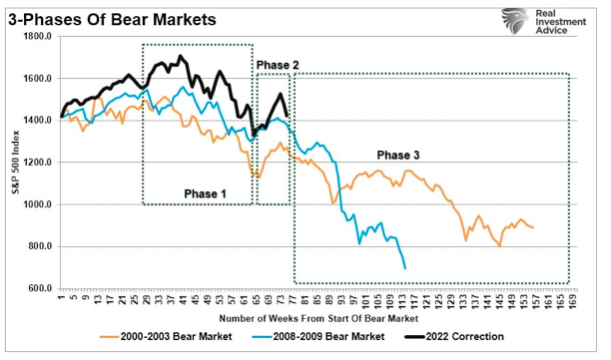
see our Anatomy of a Bear Market
As long as the Federal Reserve continues tightening monetary policy like it has this year, stocks will likely struggle. And without Fed support, we believe this bear market is unlikely to end until stocks become historically cheap once again.
European Central Bank back on the front line
Swiss Stock Market is reacting a bit less than other European markets to the negative environment as the Swiss Franc remains firm.
CRYPTOS
After shedding almost 20% of its capitalization over the previous two weeks, bitcoin is still operating in an anxious macroeconomic context, the slightest technical rebound is proving relatively fragile and, for the time being, positive catalysts that would presage a sustainable return to the upside are rare in the digital asset market.
The FED, What else ?
“We shall fight on the beaches, we shall fight on the landing grounds, we shall fight in the fields and in the streets, we shall fight in the hills; we shall never surrender.”
Winston Churchill (June 4, 1940), and now Jerome Powell (Aug. 26, 2022):
That being said, while the US economy appears right now in a less bad state than one could have feared, the leading indicators are still pointing for a significant deceleration – which might be delayed… On the most forward-looking measures (including a falling housing market and a sluggish ISM), signs of economic slowdown seem hard to get rid of.
If the recessionary topic is still hard to assess with accuracy, current data makes it hard to foresee a positive economic situation in 2023. Additionally, most of our indicators, whether based on the shape of the yield curve or leading indicators, point to a slowdown. All else being equal, for so long as the Fed appears unwilling to move to a more favorable monetary policy stance (the ‘pivot’…), it remains hard to anticipate a major bullish move.
According to Ed Yardeni Research the most bearish of the lot are shown below. The first one shows the Fed’s holdings of securities versus the S&P 500. The second shows the former versus the forward P/E of the S&P 500.
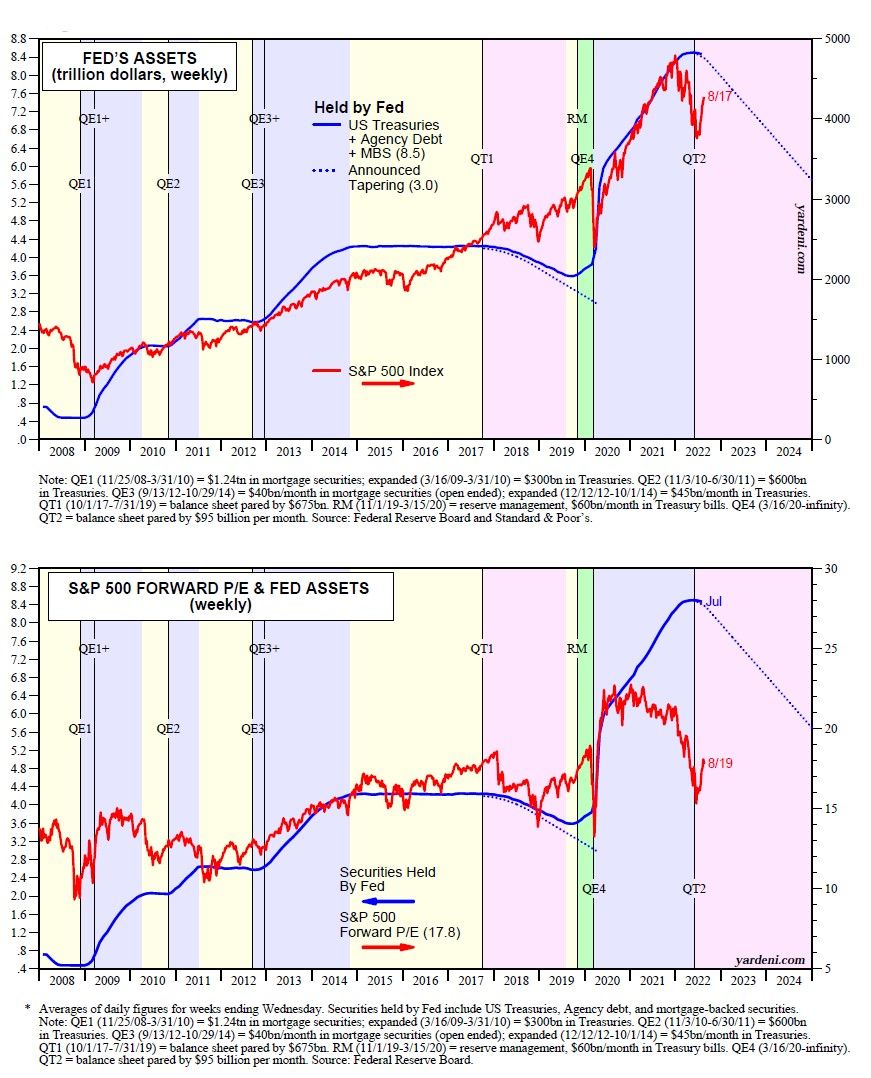
The added dotted line to track the Fed’s QT2, which ramps up in September and will reduce the Fed’s holdings by $95 billion per month, on average shows an unsettling picture. The QE programs that expanded the Fed’s holdings of securities contributed to the bull market from 2009 through 2021. The fear is that QT2 will result in a long bear market for stocks.
However, the QE1-QE4 programs from 2009-2021 weren’t the only drivers of the previous bull market. The S&P 500 always rises along with earnings during economic expansions, and the economy was mostly expanding over this period (except for a severe but short-lived recession in early 2020).
Furthermore, the federal deficit is shrinking. Over the past 12 months through July, the deficit is down to $1.0 trillion from $2.9 trillion a year ago on the same basis. In addition, over the past 12 months through June, foreign investors purchased $840.9 billion in the US bond market, including $618.8 billion in Treasury notes and bonds. We will soon see if the Fed’s QE purchasing programs will be missed or not.
In the end, if QE mattered, so will QT. It might not be totally symmetrical, but there will be a meaningful impact.
Reviving the QT engine
As noted, the rate of QT is twice that of any previous period in history. With the Fed increasing rates, it’s worth noting how QT negatively impacts liquidity. The 58-page Fed white paper by Viral V. Acharya on the topic of QT and liquidity got presented at the recent Jackson Hole Conference.
Unlike the large rate hikes being broadcast by the Fed – which have been quick to capture investor attention – QT is a more opaque way of tightening financial conditions. Note that the central bank is not selling its Treasury holdings outright, but is rather letting them mature to shrink its balance sheet. After an initial few months at a slower pace, monthly caps for offloading Treasuries and mortgage-backed securities are set to double to $60B and $35B, respectively, compared to the peak combined rate of $50B the last time the Fed trimmed its balance sheet in 2017-2019.
The whole thing is somewhat of a complicated accounting process, involving settlement windows and redemption caps, but at a basic level, it ultimately reduces the supply of bank reserves and drains money from the financial system. Some safety valves have been implemented this time around, like the Standing Repo Facility, after chaos in the repo market prompted an early end to the last QT program in 2019. The new facility will allow primary dealers to borrow more reserves from the Fed against high-quality collateral, but some caution it might not be enough to stave off liquidity issues, and could complicate Chair Powell’s plan to raise rates and bring inflation under control.
There is way too much money — loosely undefined — in the global monetary system.
We are still not confident the Fed has the backbone to back up its tough talk, and may God help the ECB.
see our previous comments on FED Tightening
The Federal Reserve Doesn’t Care About the Stock Market. SEE OUR BLOG
End of our invest strategy publication QT MATTERS
Happy trades
BONUS :
Steven Roach gets it. The real Fed Funds rate needs to move “10 percent higher from its lows,” which would be through a combination of lower inflation and higher nominal rates.
>>>Go to 1:50 into the video to get the upshot.