

MARKETSCOPE : How Deep Is the Hole ?
April, 11 2023
Swirling wind : Heading Towards Recession
We take the opportunity of this period to review what moved the past quarter, what and where performances have been, as well as what can be expected in the second quarter -including our monthly “What are the Charts Telling Us?”.
CHECK our monthly “What are the Charts Telling Us?” here
But first let’s quickly review last week markets.
The short but volatile week finished on a modestly upbeat note. This stems from the many calls for a recession that led to a drop in stock prices. Yet, when it did not really come to pass is when the market runs higher once again.
 The deterioration of US macro statistics and the banking crisis have reinforced investors’ hopes for medium-term monetary easing in the US, – the much talked-about “pivot”. But they have also raised fears of a hard landing for the economy. This week, it is these fears that have taken over after a string of unfavorable data.
Major US equities indices were mostly lower over the holiday-shortened week that was characterized by light and choppy trading. In Europe shares rose by nearly 1% as fears of a banking crisis abated while ECB’s Lagarde, hints at more rate hikes.
Now the market seems to be struggling to decide whether recession worries or rate hike worries are more meaningful to stock prices. The next expected statistics (inflation, consumption, confidence) will have considerable weight in the strategy that the US central bank will choose to apply at its meeting on May 3.
Last Monday, the ISM gauge of March factory activity fell back to a nearly three-year low at 46.3 percent, 1.4 percentage points lower than the 47.7 percent recorded in February. Regarding the overall economy, this figure indicates a fourth month of contraction after a 30-month period of expansion.
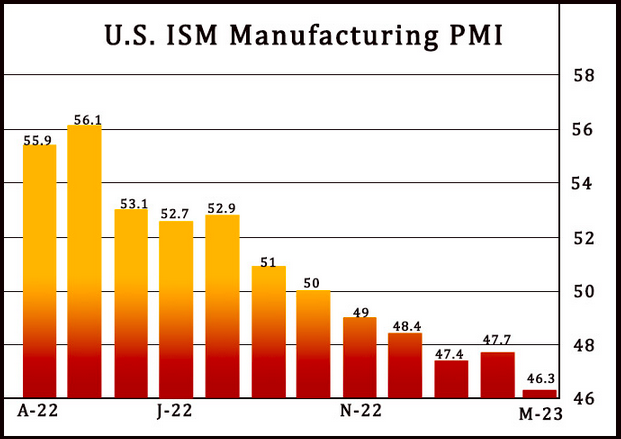
The ISM’s services sector gauge, released two days later, indicated that the services sector was still expanding, but at a significantly slower-than-expected pace.
Registered on our proprietary ABS matrix it is pointing toward recession which is why we remain primarily defensive with a preference for quality stocks given the risk of re-rating.and we stay defensive accordingly.
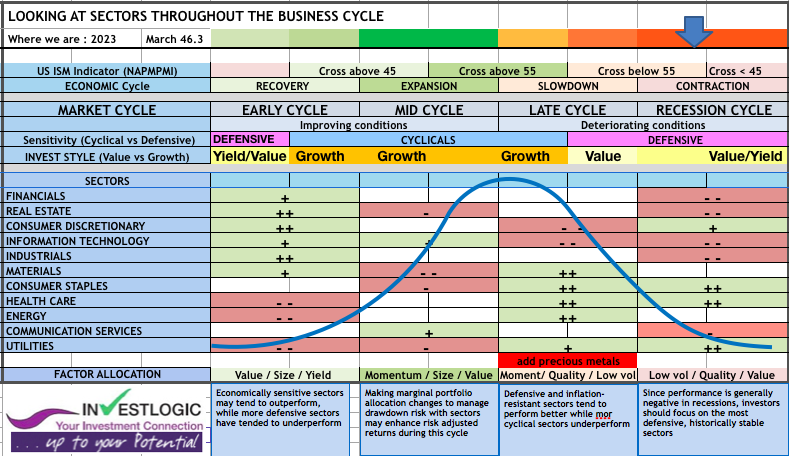
check Business Cycle : our ABS matrix
The Easter pause serves as a calm before the storm particularly given Friday’s employment report, which showed a slowing in the pace of hiring and suggests economic weakness is becoming more widespread. Investors will have a watchful eye on the next slate of economic reports as not only key CPI and PPI prints are due in mid-week, but a host of key earnings reports, to see if indeed there is greater cause for concern.
To sum up, the stars are finally aligning for the recession to unfold starting in Q2 which would bring the bear market back out from its recent hibernation. However, just like in the recent past, if those recessionary forecasts do not hold true, then be prepared to bet on more market upside. That means to watch each key economic report closely for clues of where we stand and what comes next.
Be sure to review these announcements as objectively as possible because those looking for a bear market may see one even if the facts don’t support that conclusion. The same goes for you bulls being too optimistic at times only for Chairman Powell to sternly remind you of current realities.
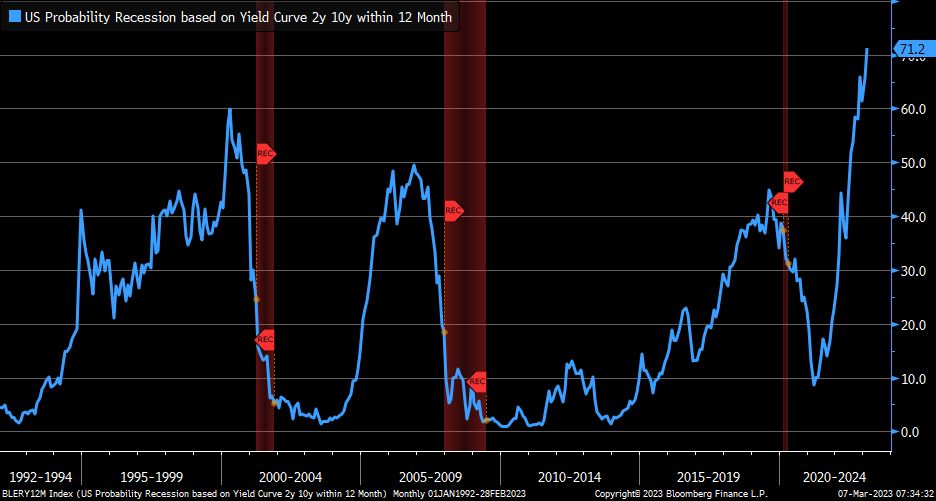
Recession probability model from Economics (based on 2y10y yield spread) has risen to an all-time high.
This is a real mind bender for investors. But let’s remember that April is traditionally the second best month for equity markets after July, which should give investors some reassurance in these tricky times.
Looking into the Rear View
By the end of the quarter, the immediate volatility had subsided – in large part due to the market’s near certainty that the Fed’s rate hike cycle is effectively over – but the turmoil led to speculation about whether something was finally breaking after a rapid series of central bank rate hikes.
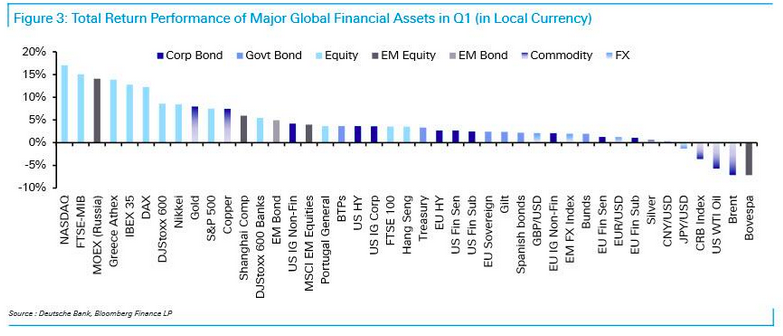
Nevertheless, even with that market turbulence in March, Q1 as a whole saw some incredibly broad gains after the weakness of 2022, with advances for equities, credit, sovereign bonds, EM assets and crypto. The only major exception to that pattern were commodities, with oil prices losing ground in every month of Q1.
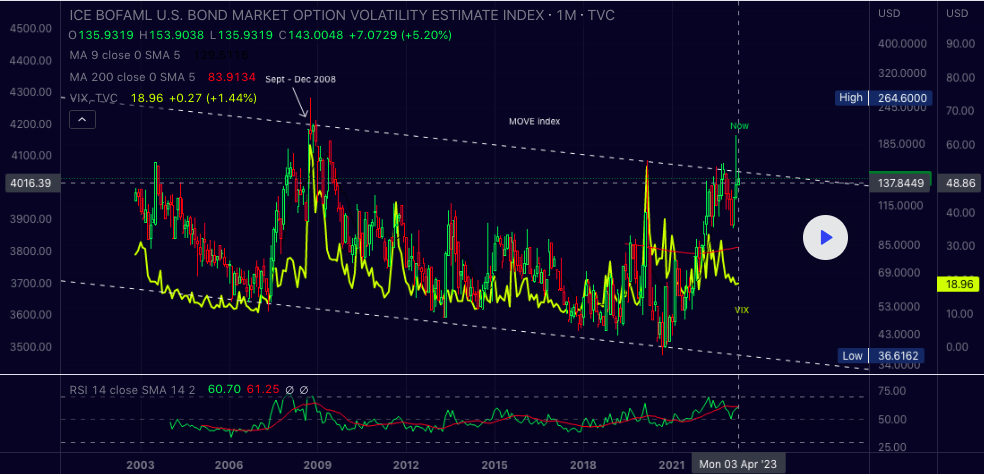
By the end of March, there were signs that calm was returning to financial markets again. Measures of volatility like the MOVE index and the VIX index had come down but the MOVE/VIX ratio still trading at extremely elevated levels.
MOVE Index measures Treasury rate volatility through options pricing and daily bond market swings are the wildest since the Global Financial Crisis. Yield volatility and credit spreads are key risk indicators
Financial conditions had also eased since the height of the turmoil. And with investors far less concerned about aggressive rate hikes, sovereign bonds put in a very strong performance. In fact, for US Treasuries it was their best monthly performance in 3 years since March 2020, back when investors poured into save havens and the Fed slashed rates and restarted QE.
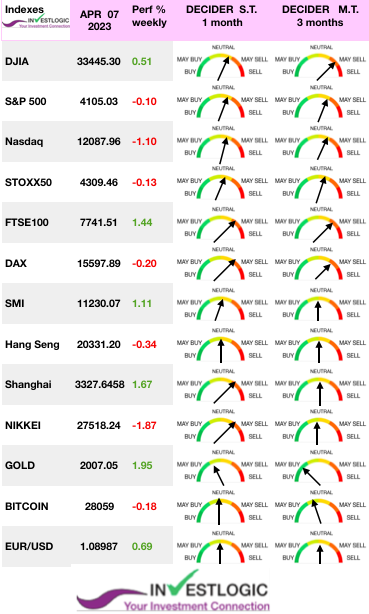
MARKETS :
The market continues to defy the recession calls despite weakening economic data. However, the actual test for the market will start the week as the first quarter earnings season gets underway. A lot of attention has been placed on 4200 as an important level on the 50% Fibo retracement. A break through that level would mean that 4300 is the next target, level of marking the top from August last year, and will resume an uptrend (at least temporarily).
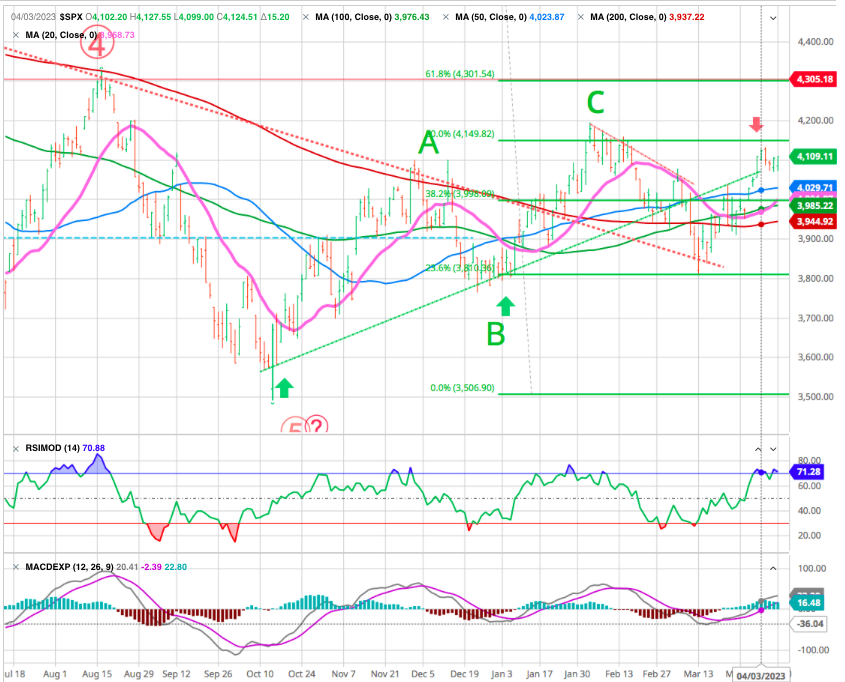
For our part as the economy will enter a recession in the second half of this year and over the next 6 months, we expect to see another 10% correction, with the SPX trading down to 3700. Several factors could trigger the downside in equities:
- aggressive monetary policy;
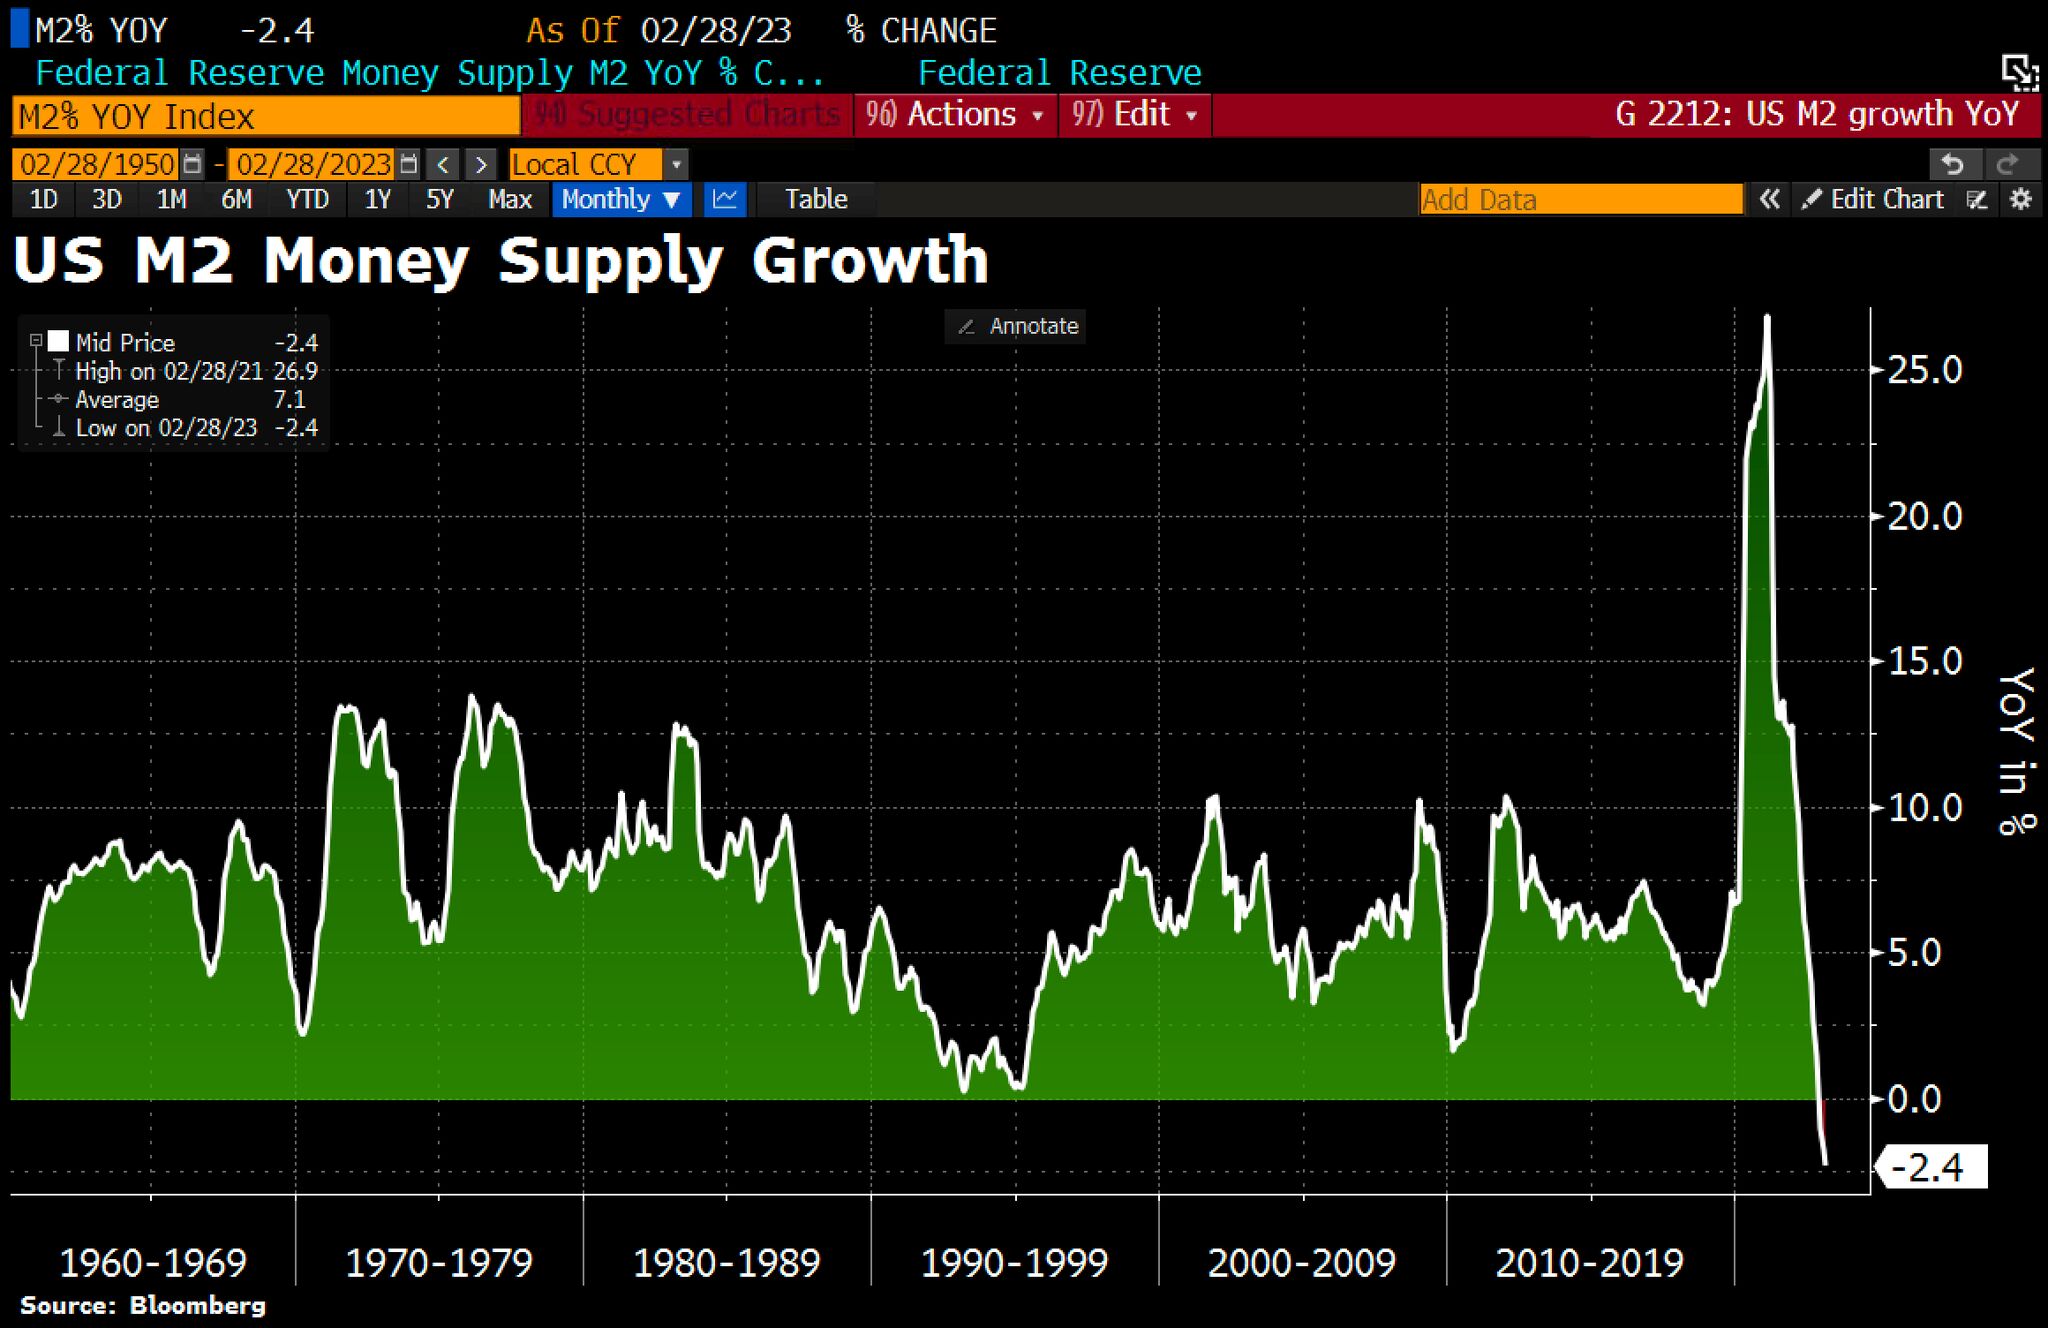
Collapsing money supply alarms economists. US M2 growth plunges to -2.4% YoY in Feb, lowest in history. A recession warning?
- potential capital/liquidity issues catalyzed by the bank crisis;
- a consumer that is increasingly reliant upon credit to sustain spending.
Also note that according to Carson Group pointed out that the “extremely rare” Zweig Breadth Thrust Indicator just triggered an incredibly rare bullish signal for the first time since 2019, suggesting that the 18% rally in the S&P 500 that started in mid-October has more fuel to continue higher.
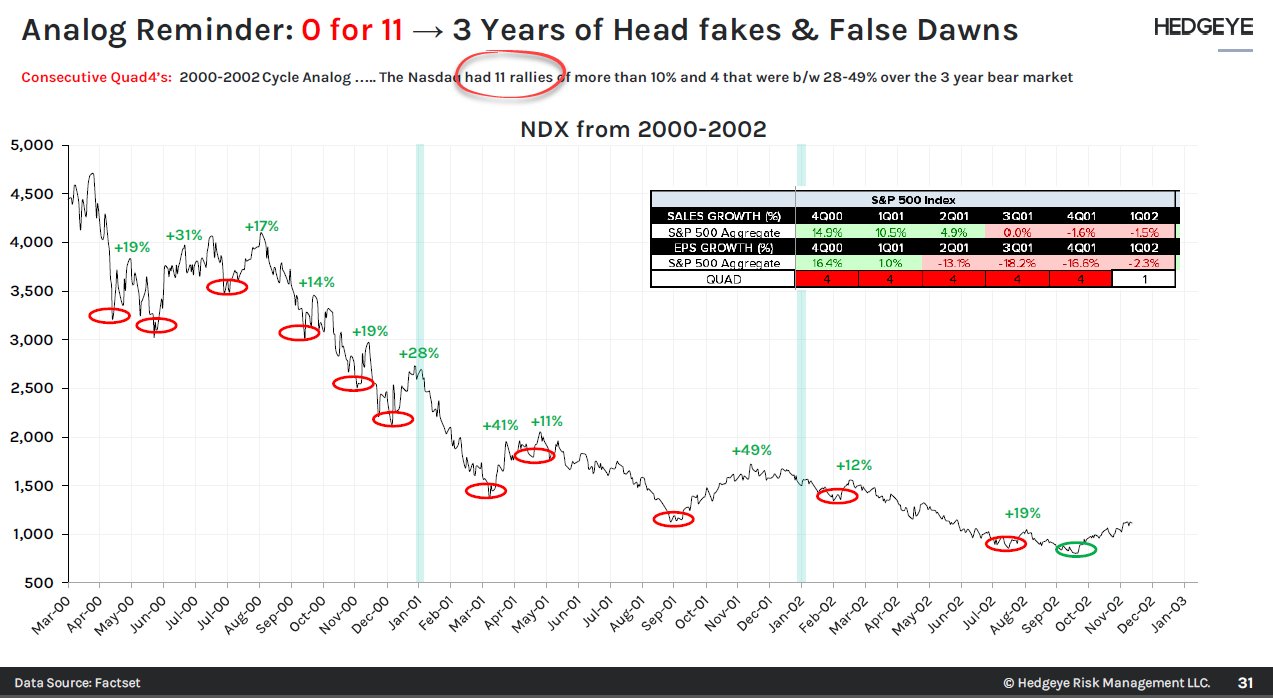
We shall see,remembering that the NDX had 11 rallies more that 10% over the 2000 3-years bear market !
also check our ANATOMY OF A BEAR MARKET here and there
Rallies out of major bear market lows are typically very broad affairs. Virtually every stock in the market lifts in unison and in dramatic fashion. This comes in reaction to the collective feeling that the worst is officially behind us. It is the metaphoric sigh of relief, if you will, after a prolonged period of financial distress and investor consternation. What we have seen so far this year is just the opposite.
EARNINGS
However, the most important factor driving stock prices continues to be earnings. The actual test for the market will start next week as the first quarter earnings season gets underway. Estimates were lowered substantially going into Q1, so expect a high “beat rate” for companies. While the beating estimates will get headlines, it will be the “forward guidance” driving their prices. CEO confidence remains very low. Therefore, weak guidance could knock some of the exuberance out of the markets.
According to Bloomberg Intelligence the worst of the earnings recession is apparently now underway. S&P 500 1Q EPS now expected to drop 8% YOY. Consensus forecasts by quarter below.
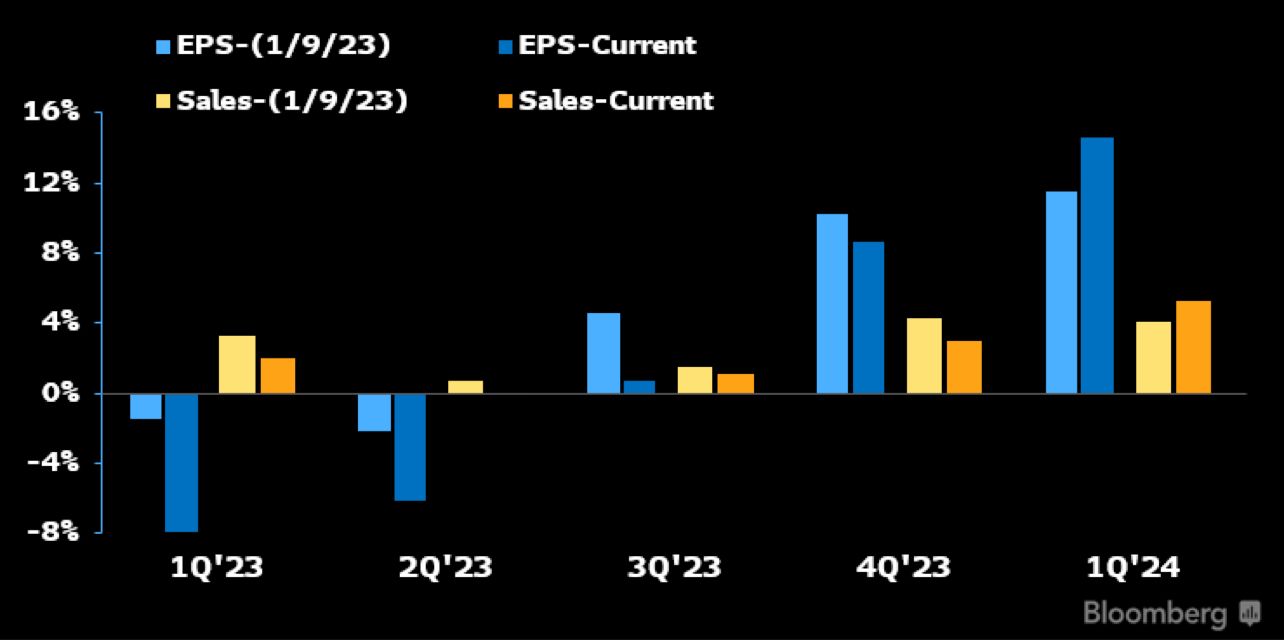
Source Bloomberg (Gina Martin Adams)
According to FactSet, the current consensus for Q1 is that S&P 500 EPS declines by -6.6% which many of the bears have latched onto as describing the long-awaited “earnings recession”. What’s more, nearly three times as many S&P 500 companies have issued negative earnings guidance versus positive guidance for the upcoming reporting period. Plus, as you can see from the chart below, the trend is moving in the wrong direction when looking at negative earnings warnings – something that doesn’t inspire investor confidence.
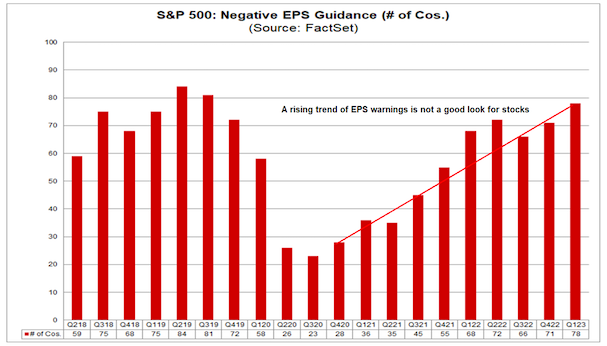
Source FactSet
Let’s also recognize that the comparison period last year with Q1 2022 captured momentum from the historically strong economy at the tail end of 2021, which included the wave of stimulus efforts. By this measure, a -6.6% decline in Q1 EPS considering the cumulative number of headwinds over the past year is otherwise impressive and highlights that underlying resiliency.
Into the second half of the year, the upside for earnings is that companies start benefiting from their cost-cutting efforts and easing supply chain disruptions in support of margins. All those headline making layoffs and efficiency measures at a time when interest rates are stabilizing lower and inflationary pressures ease can drive earnings higher, especially with the economy chugging along.
Gold
Gold broke back through the symbolic USD 2000 mark last week, after a strong rally and hitting our first target.The precious metal, which is considered a safe haven, is benefiting from increased fears about economic dynamics. It consolidated its positions slightly at the end of the week.
As we noted since couple of month (see previous marketscope) gold has turned in a strong run of late. the strong start to gold this year suggests there’s some upside for the remainder of the year.
CRYPTO
Bitcoin is fighting a resistance around $28,000. For its part, ether, the second largest cryptocurrency in terms of market capitalisation, is taking on the leader by climbing 4% since Monday. Nevertheless, still lacking strong positive catalysts, digital currencies remain globally dependent on economic conditions and will therefore remain sensitive to upcoming economic statistics.
Happy trades