

ANATOMY OF A BEAR MARKET
February, 09 2022
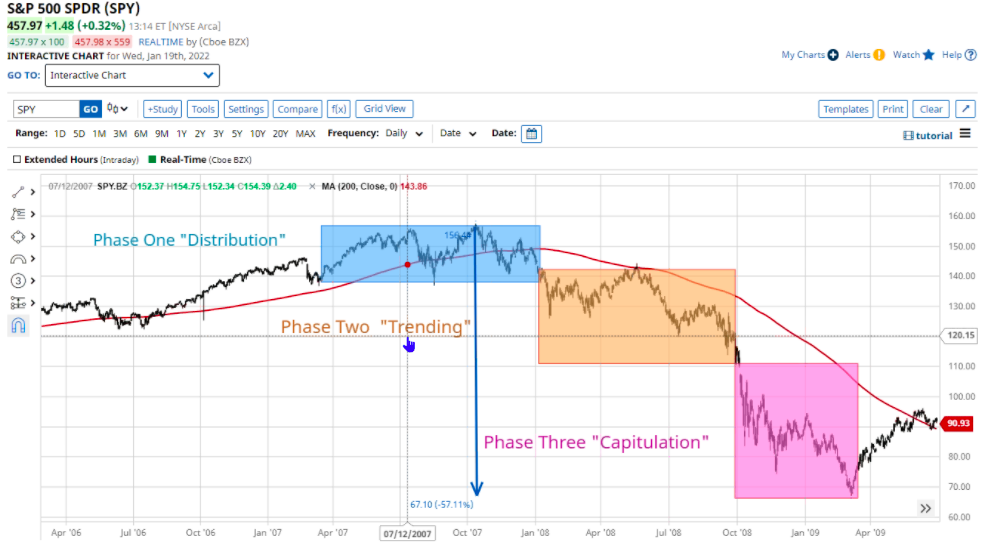
There are three principal phases of a bull market: the first is represented by reviving confidence in the future of business; the second is the response of stock prices to the known improvement in corporate earnings, and the third is the period when speculation is rampant – a period when stocks are advanced on hopes and expectations.
There are three principal phases of a bear market: the first represents the abandonment of the hopes upon which stocks were purchased at inflated prices; the second reflects selling due to decreased business and earnings, and the third is caused by distress selling of sound securities, regardless of their value, by those who must find a cash market for at least a portion of their assets.
– Robert Rhea, The Dow Theory, 1932
What Defines A Bear Market
To answer that question, let’s agree on a basic definition.
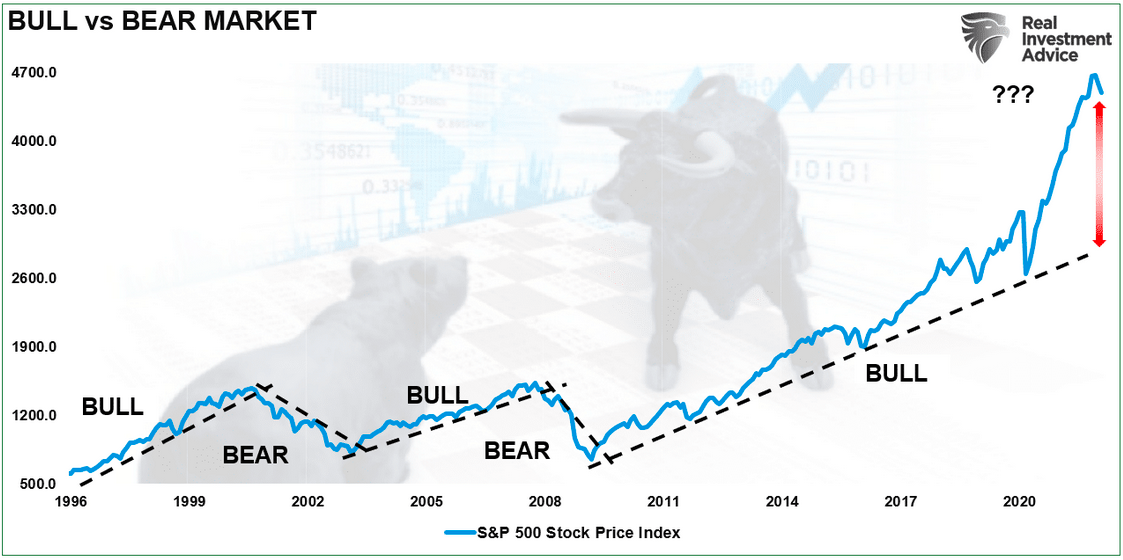
- A bull market is when the price of the market is trending higher over a long-term period.
- A bear market is when the previous postive-trend breaks, and prices trend lower.
The chart below provides a visual of the distinction. When looking at price “trends,” the difference becomes apparent and valuable.
The distinction is also essential to understanding the difference between “corrections” and “bear markets”.
- “Corrections” generally occur over short time frames, do not break the prevailing trend in prices, and are quickly resolved by markets reversing to new highs.
- “Bear Markets” tend to be long-term affairs where prices grind sideways or lower over several months as valuations are reverted.
The price decline in March 2020 was unusually swift using monthly closing data. However, that decline did not break the long-term bullish trend and quickly reversed to new highs, suggesting it was a “correction.”
Given the already large deviations from the trend in 2020, it required more than a 20% decline to retest the trend. If you review the chart above, the subsequent retest of the bullish trend will require something substantially larger in magnitude.
Just A 50-Percent Decline
Lately, there has been much discussion that a major “bear market” is looming. But given the massive deviation from historical norms, would such a reversion fit the actual definition of a bear market, or will it remain a correction in an ongoing bull trend?
Let’s look at the Nasdaq Index (QQQ), for example. For the first time since March 2020, the index is trading below the 50, 100, and 200-day moving averages. With those previous support levels broken, there could be a “trend change” in the markets.
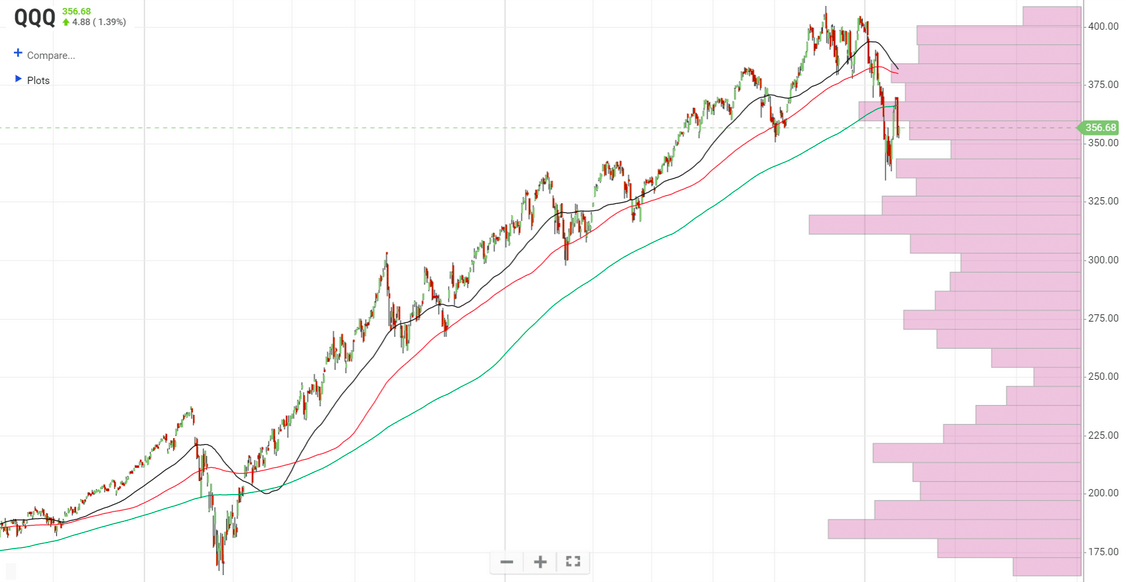
As noted, the “price trend” is what denotes a “bull” or “bear” market. Since March 2020, the markets traded primarily above their moving averages, suggesting a bull market was intact. However, with markets now trading below those averages, the market’s tone is changing. Focusing on the Nasdaq is helpful given the extreme weighting of just five companies. The same applies to the S&P 500.
If the “growth” period of the market is over, then the Nasdaq has a substantial way to fall to complete a 50-percent decline from the 2009 lows. However, that correction would only return the Nasdaq to its previous bullish trend line. Such would imply the bullish trend of prices, or bull market, remain intact.
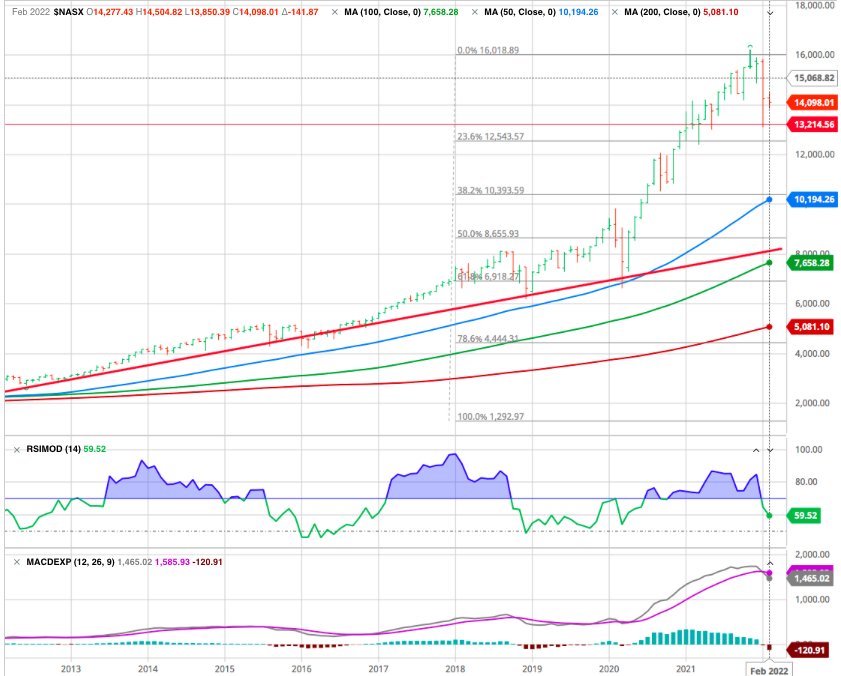
A 61.8% retracement would make it a “bear market” by breaking the bullish trend.
When you realize that a 50-percent decline in prices would still maintain the “bullish trend” of the market, it just shows how exacerbated markets are due to a decade of monetary interventions.
Fed Driven Excesses Broke The Rules
The over-reaction by the Federal Reserve in 2020 to “bailout” the financial markets due to the pandemic led to market excesses historically unprecedented.
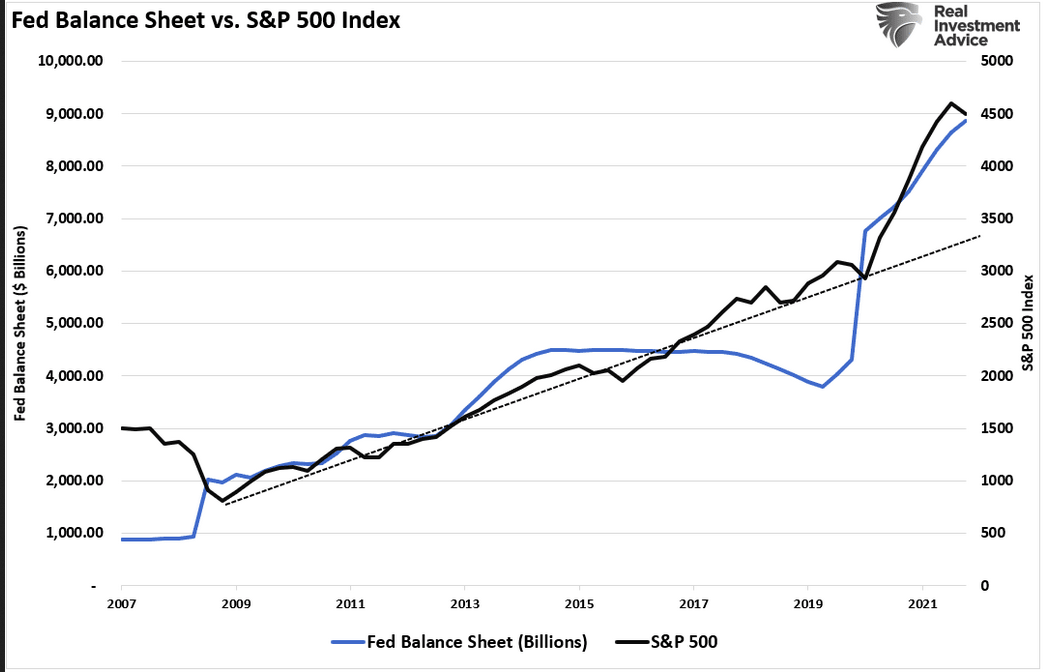
As such, the inevitable “mean reversion” will likewise be just as unprecedented.
The current deviation above the running bullish trend lines dwarfs anything seen previously. Notably, that deviation is solely due to the massive injections of liquidity into the financial markets over the last 2-years.
Such is why it is hard to comprehend that a 50% decline in the market wouldn’t technically qualify as a “bear market” as the bullish trend would remain intact.
Is the decline in January the beginning of something larger? -It could be.
Every bear market in history has an initial decline, a reflexive rally, then a protracted decline which reverts market excesses. Investors never know where they are in the process until the rally’s completion from the initial fall.
The deviation of the market due to Fed stimulus was so extended above long-term trends in March 2020, the depth of that “correction” was not surprising.
Given the current deviation dwarfs all others, suggesting that the subsequent decline’s depth is equally as great.
Of course, the question is whether the next round of Federal Reserve interventions will be enough to restore “financial stability.”
Super Bubble and Bear Markets
JEREMY GRANTHAM previously posted the following chart of 40-years of market bubbles. During the inflation phase, each got rationalized that “this time is different.”
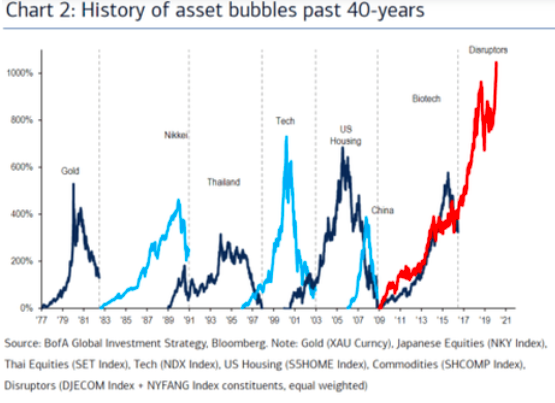
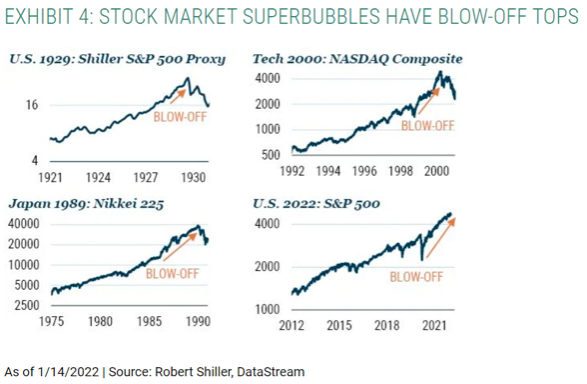
Grantham believes that exuberant investor psychology leads to a “blow-off” phase in financial markets. To wit:
“The penultimate phase of major bubbles is characterized by a “blow-off” which is an accelerating rate of stock price growth to two or three times the average of the preceding bull market. This pattern shows as clearly as any of history’s other great superbubbles in 2020 (see below Exhibit 4).”
Grantham who has been bearish for months did not hesitate to announce couple of days ago that the SUPERBUBBLE had just exploded… And that the loss of capital that will follow could reach 35’000 billions – We don’t even know what that means. He thinks that the irrational behavior of many investors will lead to a total collapse in all asset classes… the possibility of a 40-50% contraction to revert the massive extension from the long-term growth trend is highly.
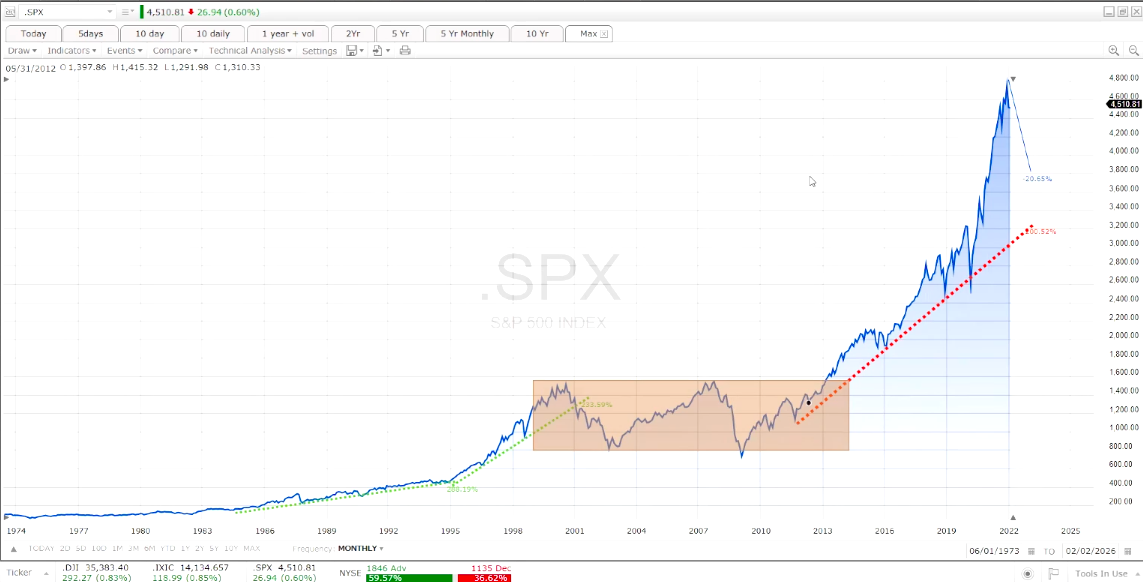
The two most important levels for market watchers, given Grantham’s view of a “mean reverting event,” are the 38.2% and 50% retracement levels. The 38.2% level intersects the running support trendline from 2009. The 50% retracement level aligns with the lows from 2018 and March 2020.
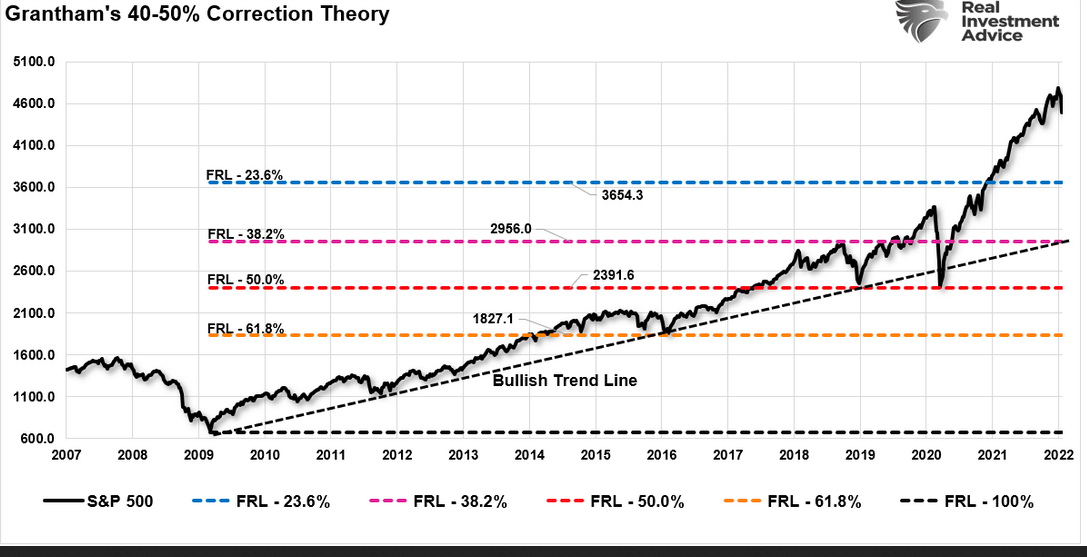
Should those two support levels fail, the market will likely search for a bottom at the 61.8% retracement level at the 2015-2016 lows.
That can’t happen? Never they never …
SIX BEAR MARKETS, FIVE BULL MARKETSS
We sometimes have to get use to the downside as well as the upside is the shorter term as it happened in the beginning of the 20th century.
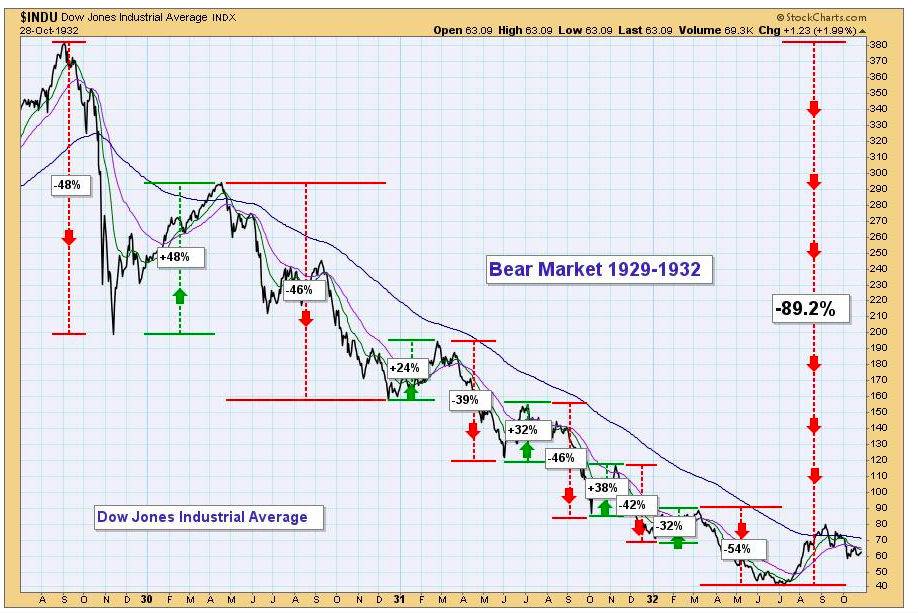
If we define a bull or bear market as being a price move of over 20%, from the 1929 top to the 1932 bottom there were six bear markets and five bull markets. Just eyeballing the duration of each one, we have 10 that were five months or less, and one that lasted eight months. Then after the final bear market bottom, the Dow doubled in two months (not annotated). Talk about volatility.
At Investlogic we are here to accompany you along the way and we are happy to help you to find the best solution FOR YOURSELF !