

Our Multi Time Frame Oscillator System Calls for Caution
August, 24 2022
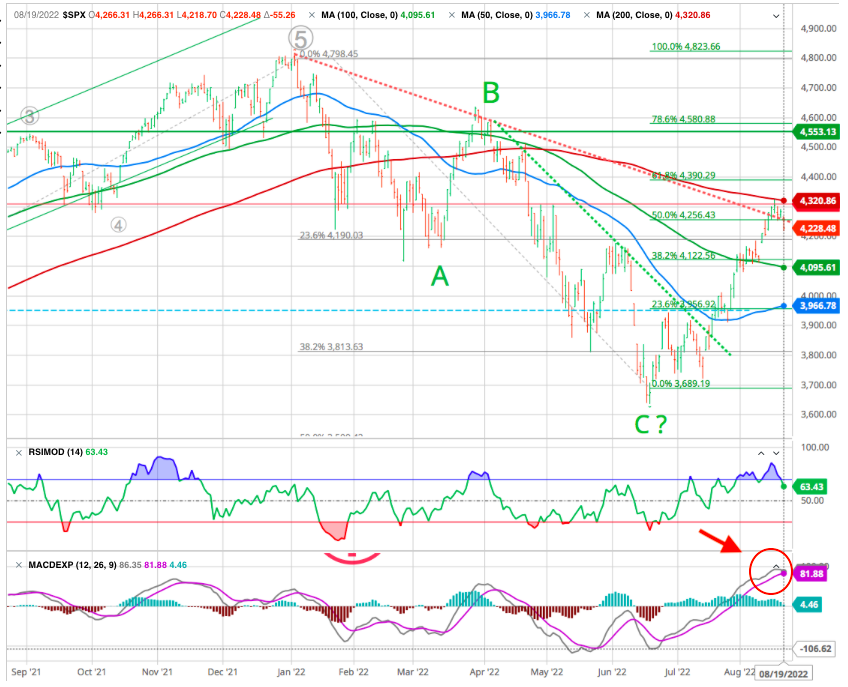
MACD overbought for stocks
This chart indicator suggests the momentum behind stocks may be at risk.
Our system conjugates several indicators in a dynamic and multi time frame to identify the frequency of the typical Elliott’s wave characterizing the market evolution. Check our multi time frame approach
Inflation has shown some signs it has started to cool a bit, and that has helped stocks continue the recent rally which began in mid-June. Stocks are up 16% since then, due in part to many investors anticipating that the Fed might not raise rates as aggressively as previously expected due to inflation having potentially peaked. And the recently passed Inflation Reduction Act may have boosted the prospects for some sectors of the economy. But there are still significant risks to stocks.
Will bullish market factors continue to help bulls run past market risks? Active investors that utilize charts might consider using indicators like MACD to help evaluate if the momentum will continue over the short term, in addition to other fundamental and technical methods.
- MACD is a technical indicator that can generate buy-and-sell signals.
- It can be most useful in trending markets.
- The rally for stocks since mid-June has pushed MACD into an overbought reading.
See also our long term BEAR SIGNAL mid February 2022
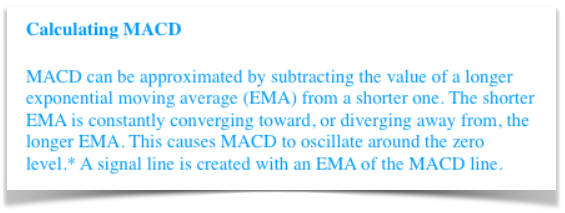
Using MACD
Short-term buy-and-sell signals are generated by the MACD line and the signal line. If the MACD line crosses above the signal line, this may be interpreted as a buy signal. Back in late June, the MACD line crossed above the signal line, generating a buy signal. Alternatively, if the MACD line crosses below the signal line, this may be interpreted as a sell signal.
These 2 lines fluctuate around the zero line, which is labeled on the right-hand Y axis of the bottom panel of the chart above. A sell signal is given when the signal line or the MACD line crosses below the zero line, and a buy signal is given when either cross above the zero line. Both the signal line and the MACD line crossed above the zero line in mid-July, generating a buy signal. The zero line is also significant because it can act as support and resistance.
Oscillators like MACD are generally most valuable when they reach their boundary’s extreme levels. However, MACD can theoretically rise or fall indefinitely. If you were to apply relative extremes to the MACD indicator (i.e., the MACD and signal lines are relatively far away from the zero line), the signals would be as follows: When the MACD line is relatively well below the zero line in extremely negative territory, it can suggest an investment may be oversold (i.e., a buy signal).
Alternatively, when MACD is relatively well above the zero line in extremely positive territory, it can suggest an investment may be overbought (i.e., a sell signal). Currently, the MACD line is well above the zero line, indicating a sell signal. This is the most recent signal generated by MACD.
The difference line, represented in the chart above by the blue bars, is typically presented as a bar chart around the zero line. This bar chart represents the difference between the MACD line and the signal line, and is designed to help depict when a crossover may take place. Recall that a crossover generates buy-and-sell signals. A narrowing of the difference line (i.e., when the bars decrease) illustrates the potential for a crossover. The difference line has narrowed somewhat from levels in mid-July, but does not currently suggest a crossover is imminent.
Confirming the trend
In sum, the various signals generated by MACD appear to have supported a bounce several months back, and now are somewhat mixed. This potentially suggests short-term caution may be warranted, according to this indicator.
Of course, inflation trends, Fed moves, earnings trends, and other fundamental factors will primarily drive markets over chart patterns. Indeed, you should never use a technical indicator in isolation. With that said, indicators like MACD can be one of many tools you use to evaluate market trends.
Until next time.