

What Are the Charts Telling Us ?
September, 09 2022
The Bear Market Story and What’s Next
It’s been the worst first half of a year for markets since the Great Depression. We tell the story and forecasts in what are the charts telling us.
Like a bear with a sore head, many investors probably wish they had stayed in hibernation in 2022. It has been a brutal year so far, the worst since the Great Depression nearly a century ago.
Capital destruction, in other the words the amount of money wiped off the value of investments, stands at more than $9 trillion globally, exceeding the financial crisis of 2008.
Most major stock markets are in bear market territory. A bear market typically describes a condition in which prices of investments fall 20% or more from their recent high.
Crypto investors have suffered even more. The global value of all crypto currencies currently stands at just over $900 billion, down from $2.9 trillion at its peak in late 2021.
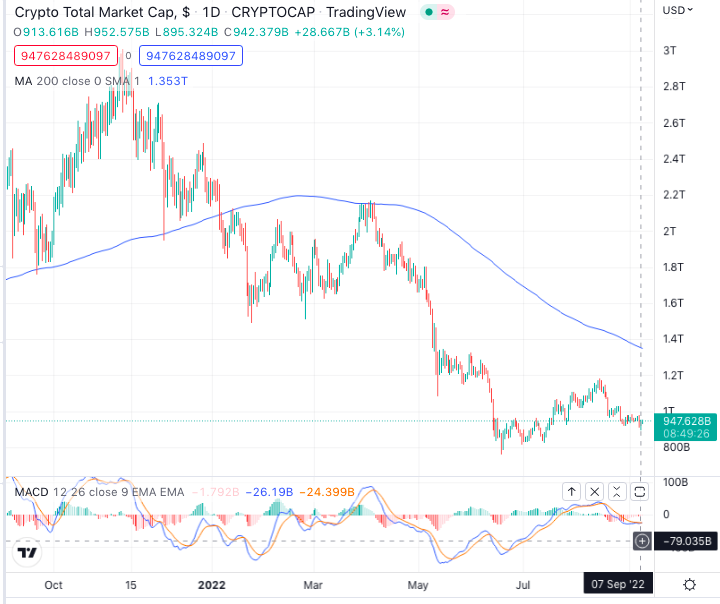
See our Blog “A little lap and off you go”
Increasing concerns the economy is barrelling towards “stagflation” – where slowing economic growth combines with accelerating inflation – or a global recession, as central banks raise interest rates and rein in money supply trying to tame spiralling inflation. The result – carnage in financial markets.
STAGFLATION
Central banks have been forced into action as inflation in most major economies has already hit 40-year highs and continues to rise. It’s brought about stark reminders of the dark days of the 1970s and early 1980s, often called the Great Inflation.
This time it’s been exacerbated by pent-up demand following the end of Covid lockdowns in most major economies, combined with supply constraints caused by Covid lags in Asia and war in Ukraine.
The result is inflation near double-digits around the world and it continues to surge. The main problem is the rising cost of energy, up 70% in 2022, which affects everything from production to consumption. But across the board commodities are up nearly 30%.
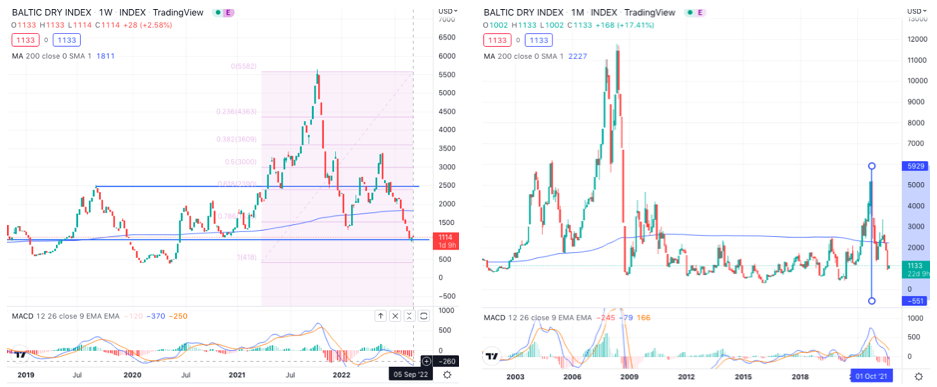
The Baltic Dry Index is now at its lowest level since 2 years, on an important support. Should this support be broken, odd increase that the inflation story has peaked and that recession is taking its pace.
On the other hand, any reviving of energy prices would favor a set back to the next resistance at 2300, a 50 % set back of this down wave.
Regarding global demand, the global economic slowdown also risks weighing on oil consumption. Year-to-date, oil demand has fallen particularly in advanced economies (-2.7 million bpd), and more recently across emerging (-0.9 million bpd).
As suggested by the latest soft economic data (surveys), economic activity in the advanced economies may continue to slow over the rest of the year while the Chinese economy continues to be dragged down by the ongoing problem in the real estate sectors as well as the country’s strict zero-Covid policy. Thus, oil demand growth is likely to remain modest in the coming months, which will contribute to dampening in oil prices.
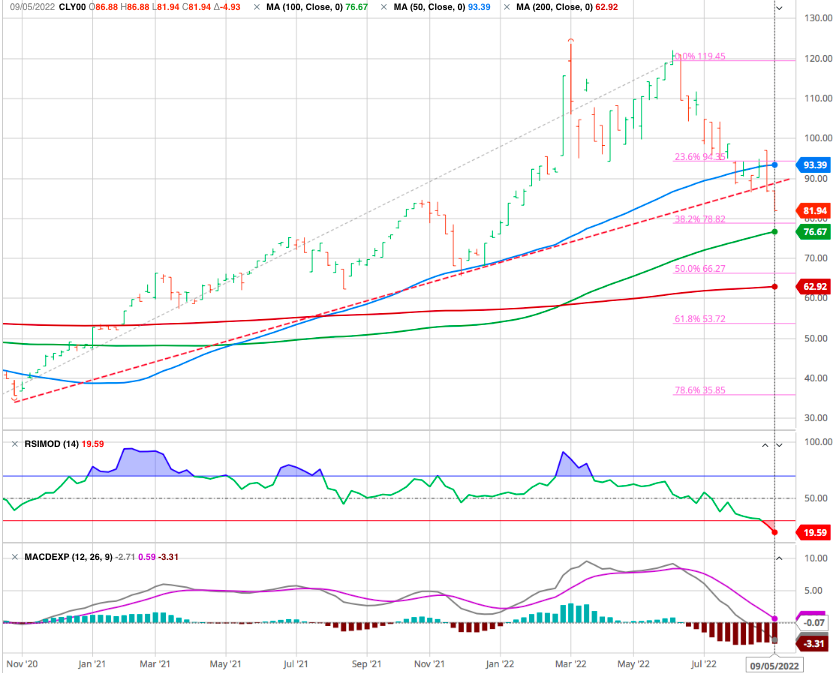
Long-term support lies around 78, a level at which the support line connecting the weekly MA 100 and the 38.2% Fibonacci retracement of the entire bullish movement that began after the Covid low meet. We could expect a down move to the next support at 66 the 50% Fibo retracement.
MARKETS
The worry for investors in stocks is that the more persistent inflation becomes, the more drastic the measures that central banks will take to contain it. If central banks don’t manage the process properly, it could lead to stagflation or even a recession – which would spell bad news for consumers and company profits.
The result has been a rout in stock markets which has been brutal, broad-based and unremitting. From the US to China, developed economies to emerging, most stock markets are down over the 20% bear market threshold.
“The trend is your friend” – until it is broken. And once broken, it usually takes quite some time for a positive trend to be restored. Momentum calls for momentum, whether it is positive or negative.
There are various way to define market momentum. One of the most common is by reference to the trajectory of the moving average (whether the ‘slope’ is positive or negative).
S&P 500 Long term uptrend intact
The 200-day moving average on the S&P500 (left chart) has now been falling for more than 90 days – its longest negative streak since 2009.
This DMA is now acting as a strong resistance level and the market retreated 2/3 of the latest upwave at 61.8% Fibo retracement.
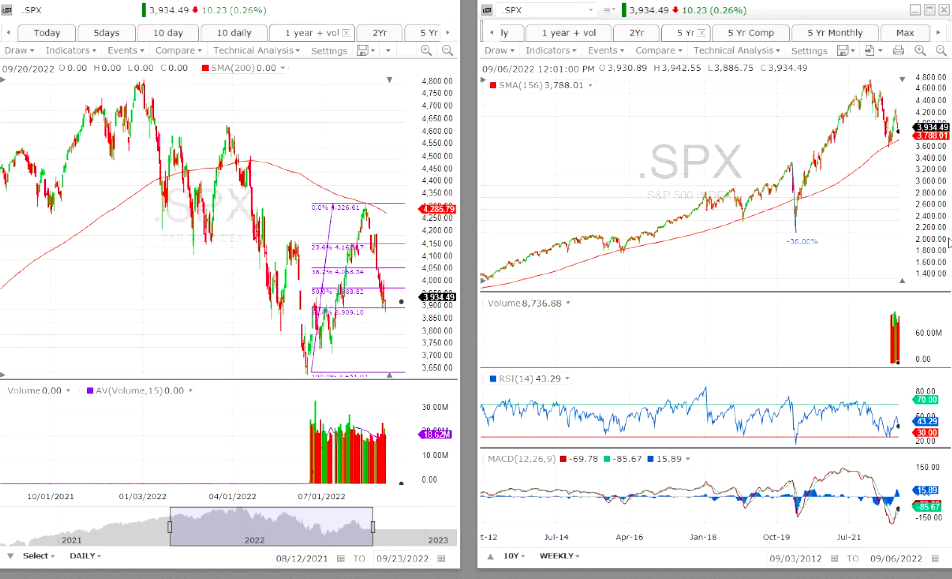
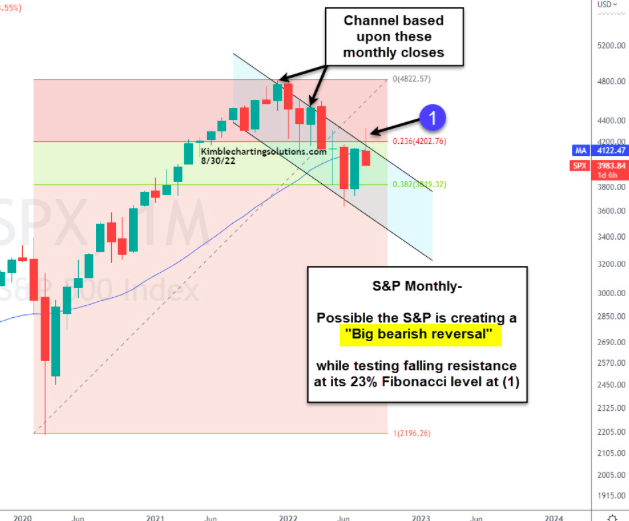
However, we do use the weekly series (right chart) -more representative of the business cycle- and the 154 weekly MA observing that the long term uptrend is still in place as long as this MA is not broken (app. 3780).
It is also confirm with the monthly serie.

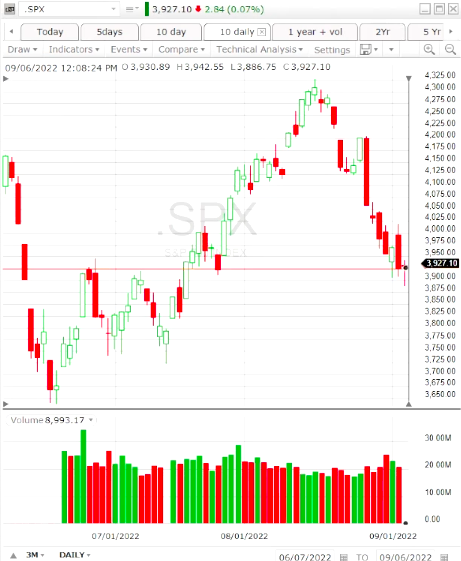
Shorter term, we note that the candle bars points to a weaker move pointing toward the previous low. But as long as the index do not break the uptrend support (3700) we can still look for some rebounds as the short term is oversold
The six-month horizon looks particularly volatile and worrying. A break of the 156 weekly DMA would trigger a major drop!
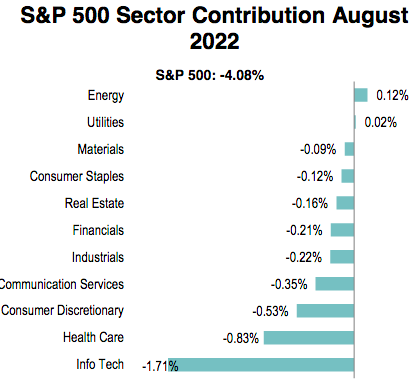
SECTORS
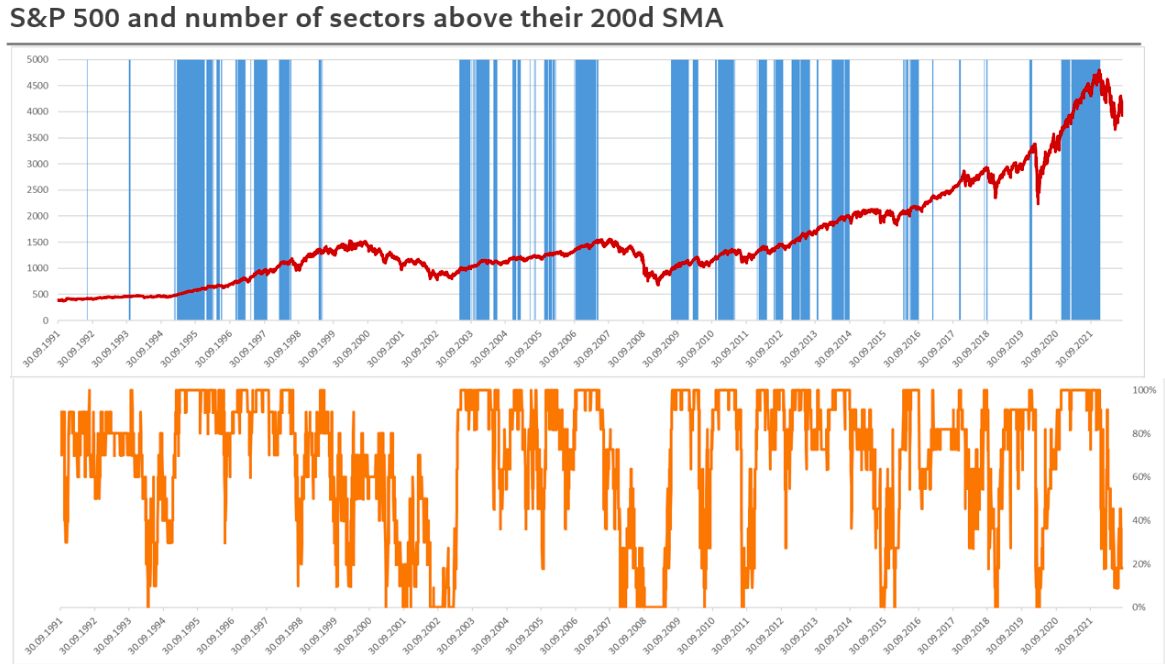
Since March the sector breadth has deteriorated significantly, with only one sector currently still trading above its long-term moving average. Breadth improved (rising slightly above 40%) during the summer rally, but it remains relatively depressed, in a sign that the rally was not so broad-based or supported on this basis.
In the chart below (from Pictet Research) highlighted in blue periods during which all eleven of the S&P 500’s sectors have been trading above their respective 200-day SMAs. The bottom panel shows the proportion of sector indices trading above their 200-day SMAs.
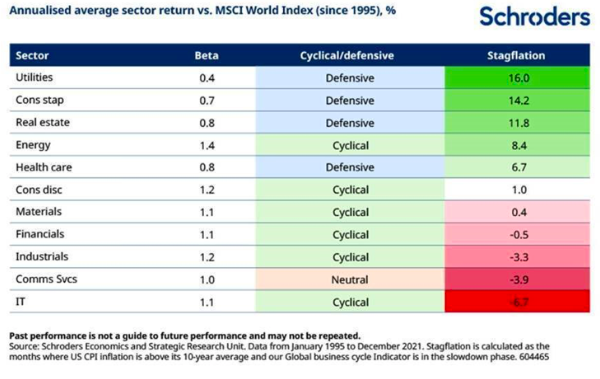
Average historical return of 11 global economic sectors versus the MSCI World Index in stagflation environments.
Which stocks might perform best (and worst)?
Unfortunately, it’s not just a recession investors are worried about. There is the increasing the risk of stagflation – stagnant growth, high inflation.
Stagflation tends to favour defensive companies, whose products and services are essential to people’s everyday lives, over cyclical companies, whose products aren’t. In other words, consumers ignore the new iPhone, because they need to pay the electricity bill.
This means the share prices of defensive stocks tend to hold up better than cyclical stocks when the economy slows, as shown in our proprietary ABS Matrix.
The only exception being energy stocks.
This makes sense as the revenues of energy stocks are naturally tied to energy prices, a key component of inflation indices. By definition they should perform well when inflation rises.
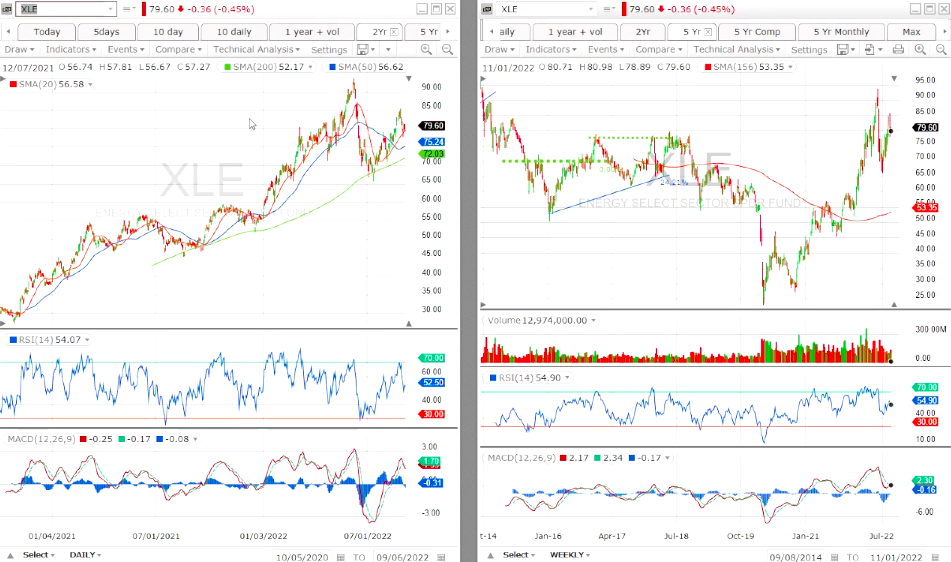
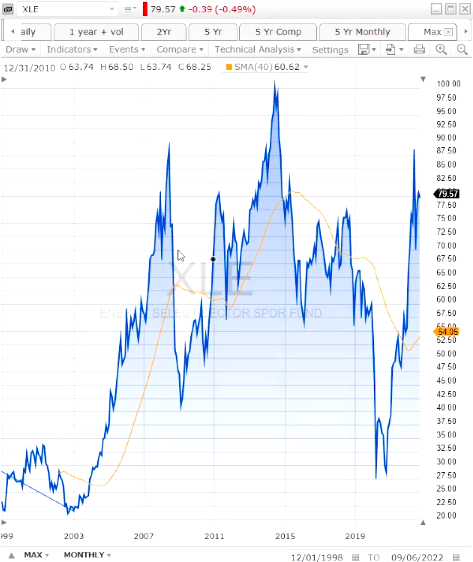
We have been recommending the sector for some time and we continue. The various DMA are piling up (20/50/ 100/ 200) and remain positive. All stocks have the same global pattern.
Short term is OK, but watch out a possible H + S.
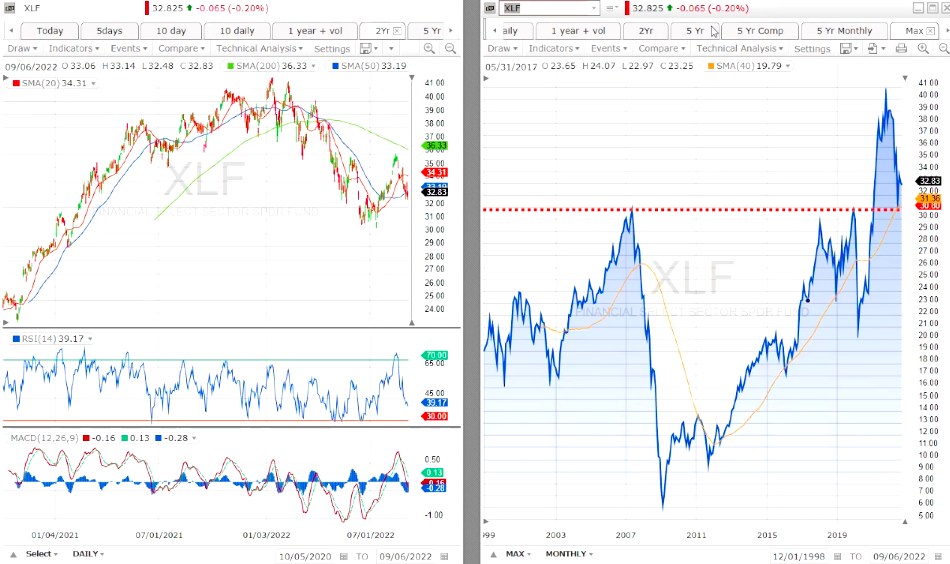
A sector we have been also recommending is the Financials
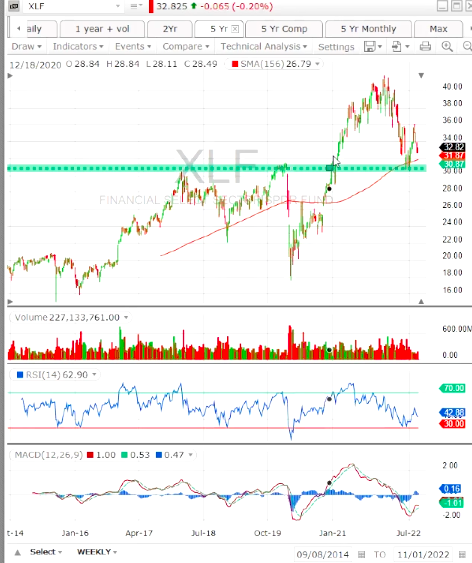
Short term it is holding the support well. A break above the previous high would give a buy signal.
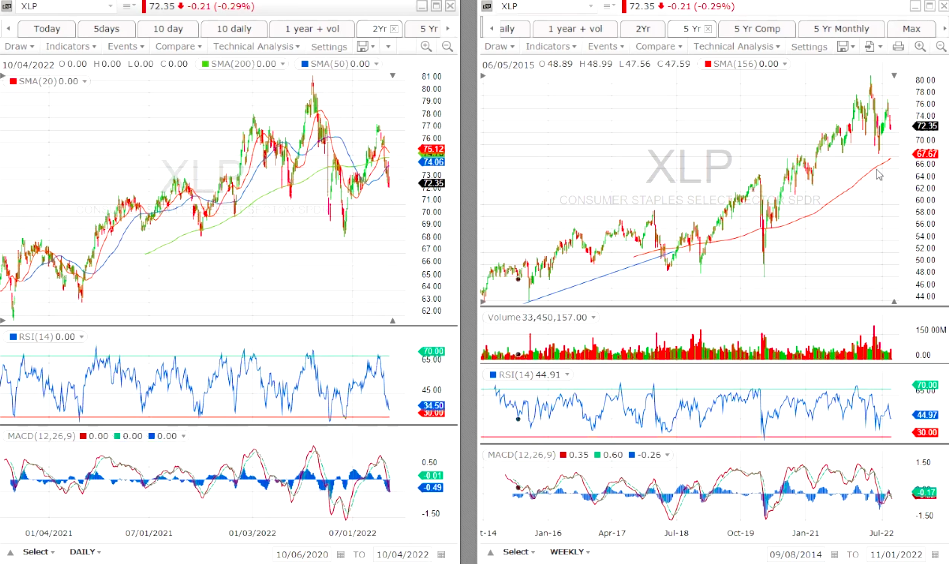
Among other defensive we have the Consumer Staples with a strong uptrend.
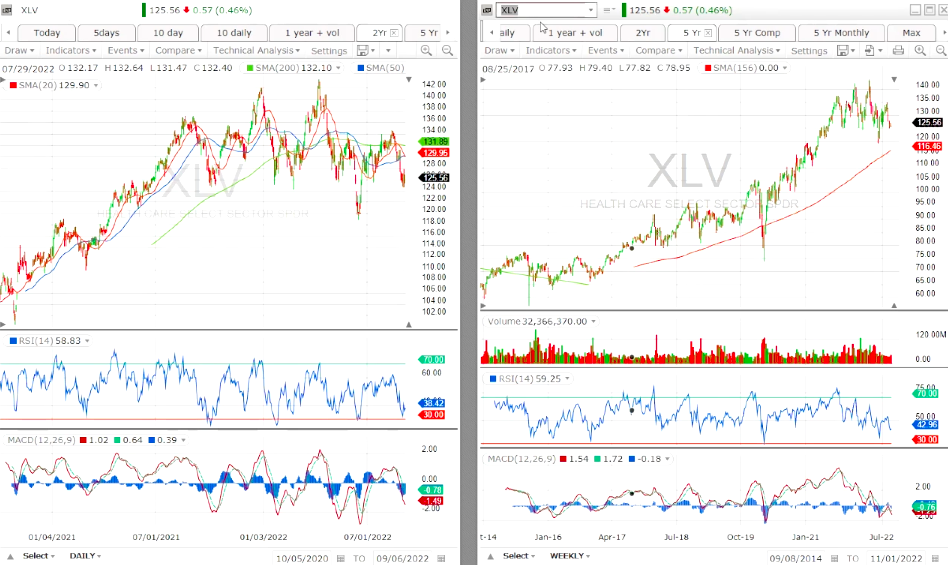
and the Health Care
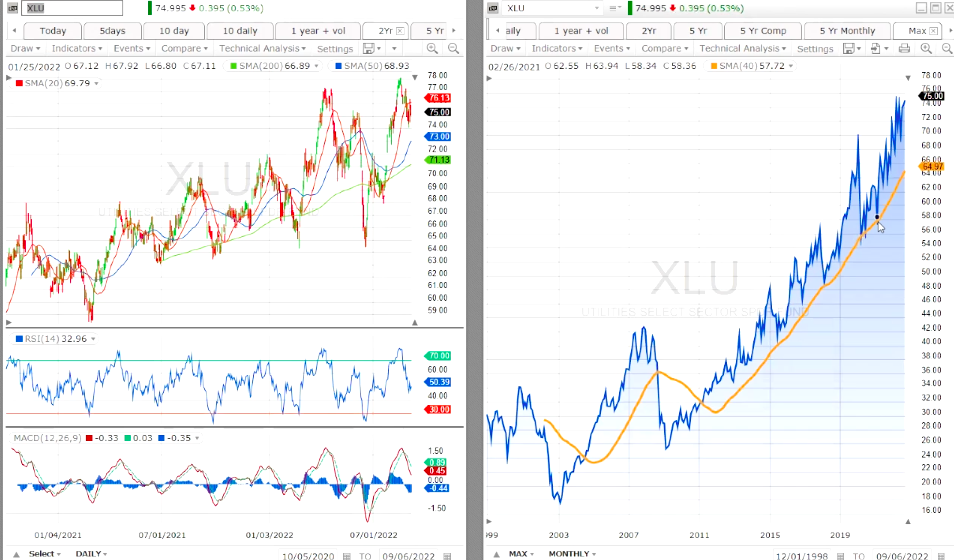
Another winner is the Utility sector , highly positive.
LOOSERS
Now among the bad performer and sector to avoid in this environment with supply chain uncertainties
is the Semiconductors
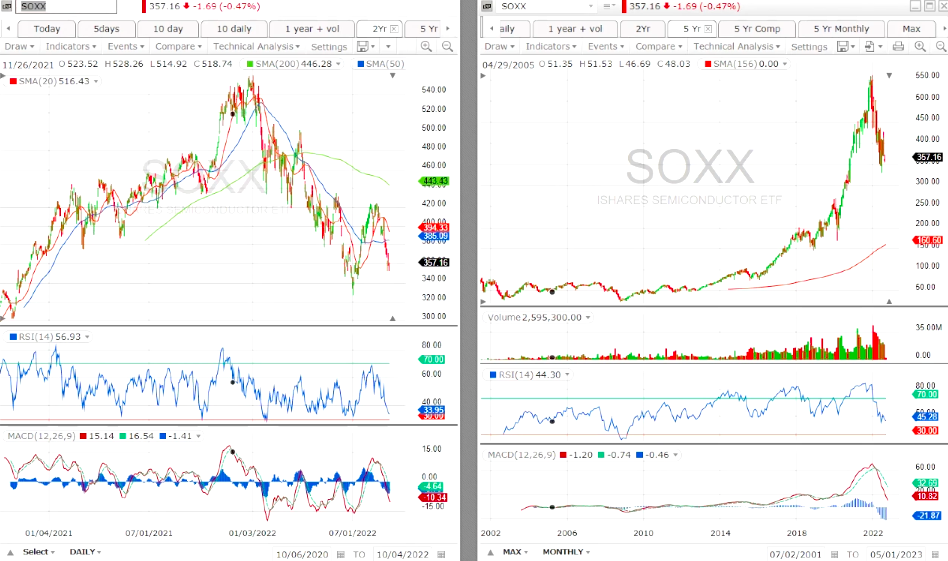
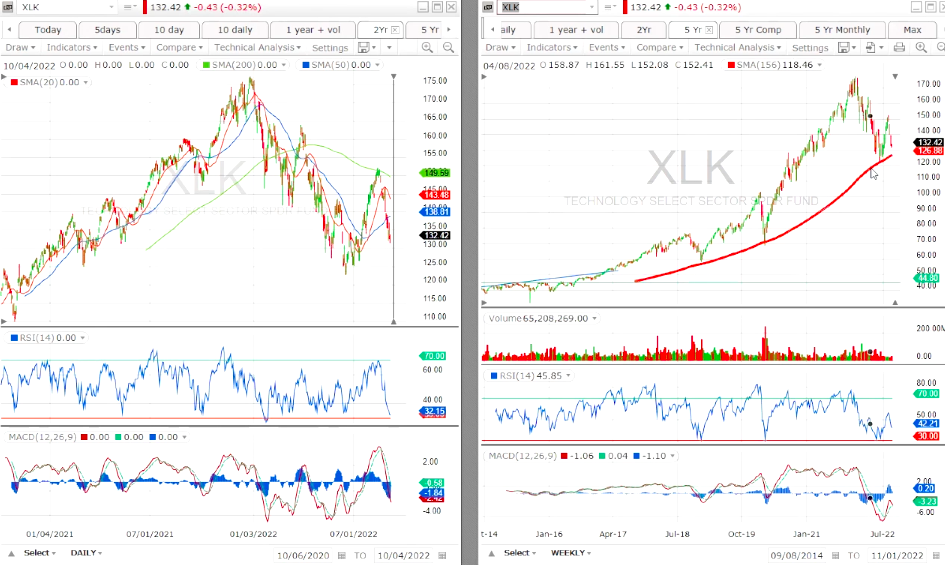
and Technology related sectors
although it is holding its 156 WMA. It is challenging and we would wait a clear break of the previous high (lower highs)
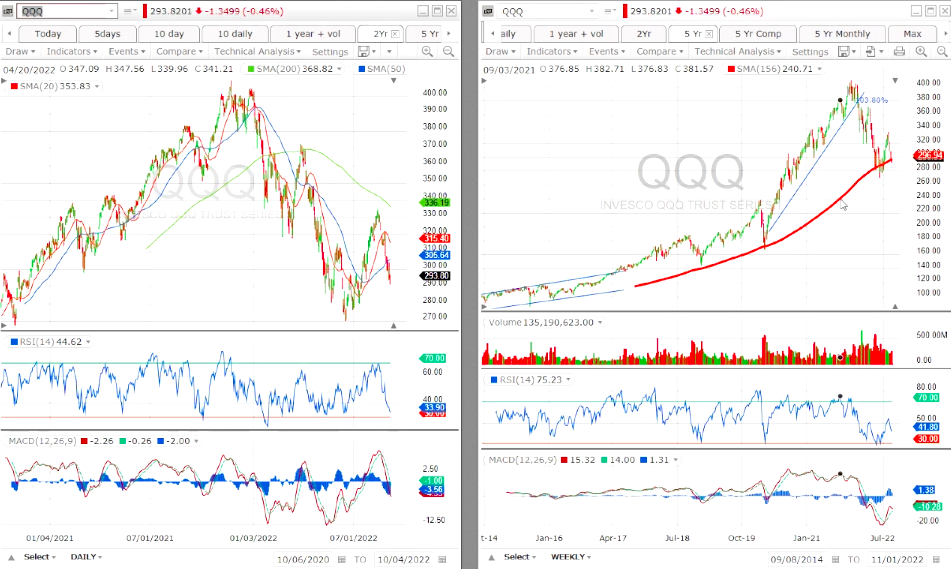
The QQQ is globally tech related
and it challenging the 156 WMA which could lead the way down.
In technical terms, defensive sectors have a market beta of less than 1 (meaning they outperform when the index falls), whereas cyclical sectors have a market beta of greater than 1, (they underperform when the index falls),
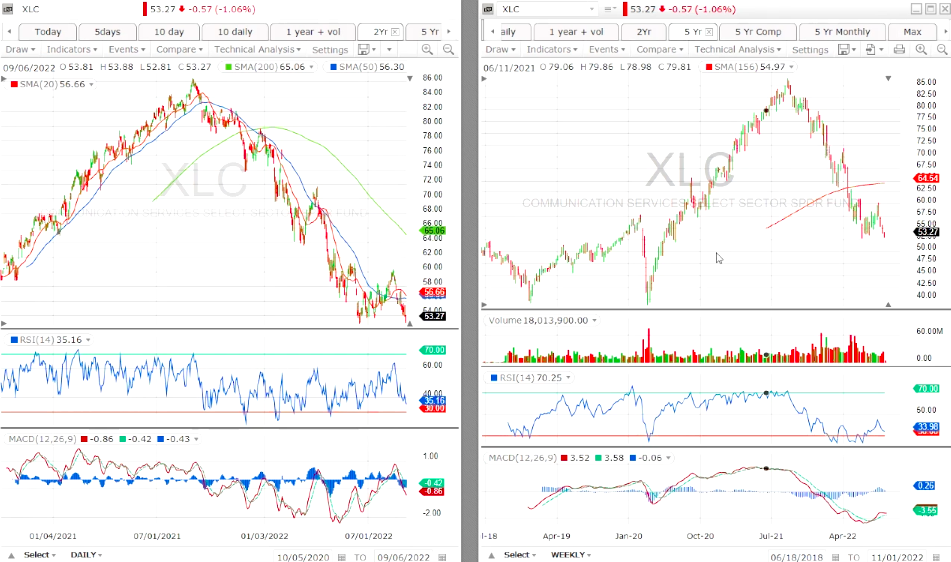
Not surprisingly the worst is the Communication sector and it should continue to underperform.
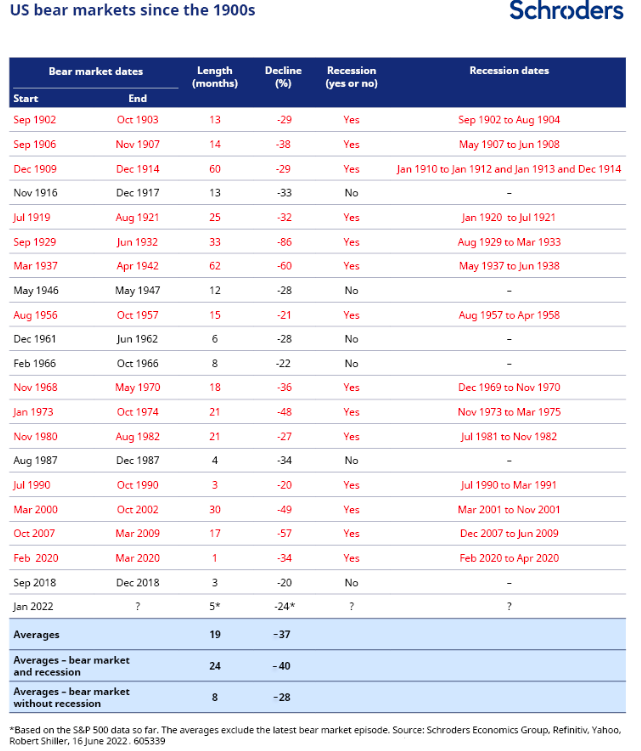
Do bear markets signal recession? 1900 to 2022 ?
The big question though is: just because investors are panicking, does it mean the economy will enter a recession? The risks are skewed towards one. Investors can take some comfort that recessions don’t necessarily follow a bear market. That said, the odds are not favourable looking back at history.
Since the 1900s, the US economy has only managed to avoid a recession 30% of the time when a bear market has occurred.
Looking ahead, the longer the sell-off lasts for and the deeper the fall in prices, particularly against a backdrop where the Federal Reserve is hiking interest rates, then the higher the risk of a recession.
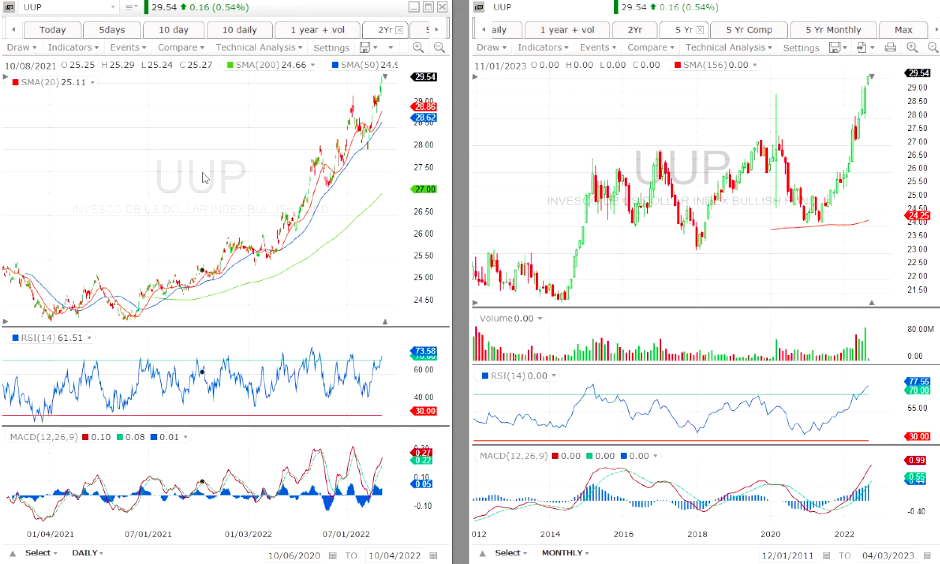
Globally in this environment the US dollar is extremely strong.
The related ETF shows since it broke the resistance level around 27. A setback toward the 50 DMA at 28.75 would give some fresh air to this upmove.
Obvioulsy this environment weighs on the Emerging Countries.
They look very vulnerable. The EEM ETF broke a multi year support at 45 and the weekly 156 MA, as well.
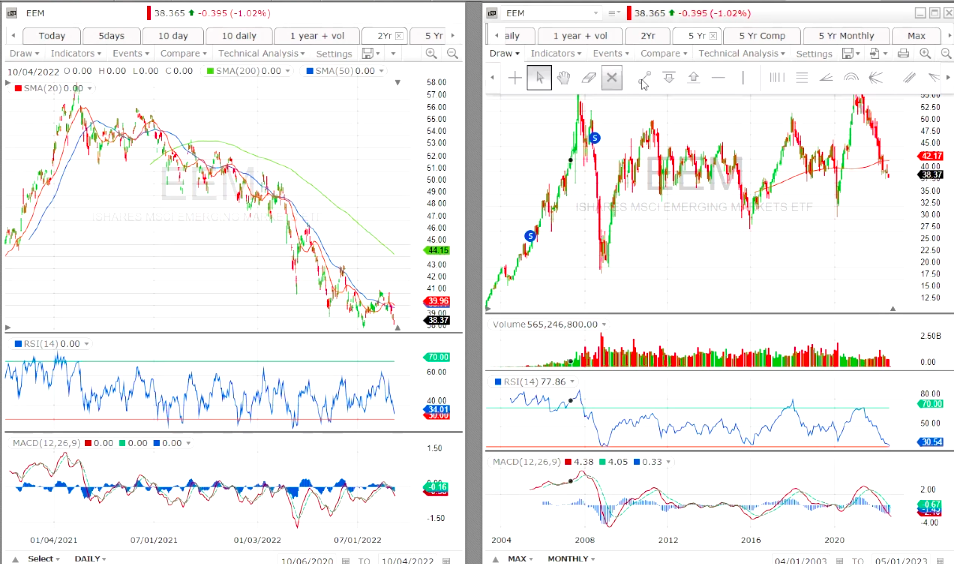
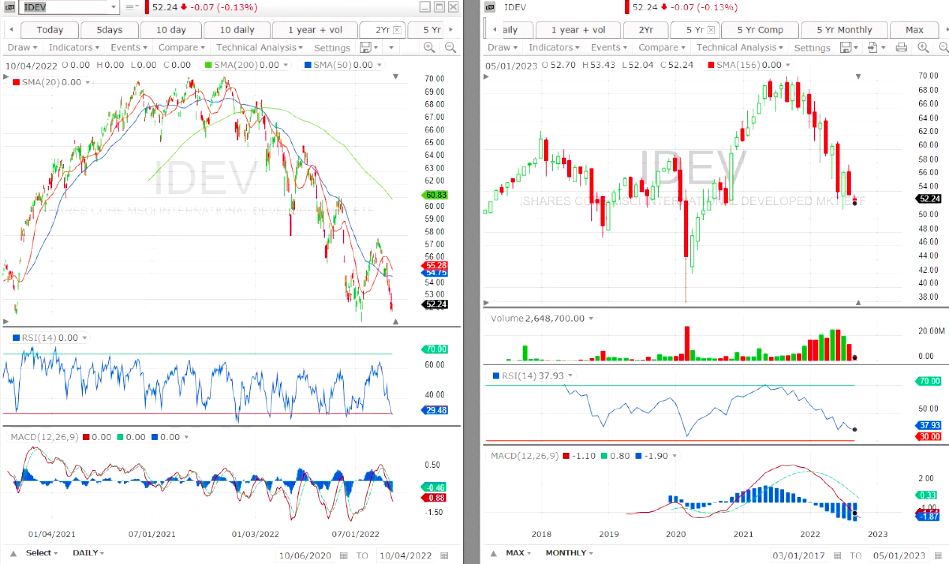
That is confirmed with the IDEV (provides exposure to Developed markets ex-US Equities.) testing a key support at 52.75.
This Is How Most Bear Markets End
For the past several months, we have reminded our subsribers and readers to keep one simple rule in mind: Don’t fight the Fed.
Since the 2008 Great Financial Crisis — and arguably, for much of the two decades prior —the FED provided a persistent tailwind for stocks and other risk assets.
Looking at the previous bear markets and their reversal we noted that two crucial facts:
- In five out of seven (>70%) of these “tightening” bear markets, a new Federal Reserve easing cycle was a necessary but not sufficient condition for a long-term bottom in stocks.
- In seven out of seven (100%) of these bear markets, there was little harm (and often great benefit) in waiting until the Fed started cutting rates before considering significant new investments in stocks.
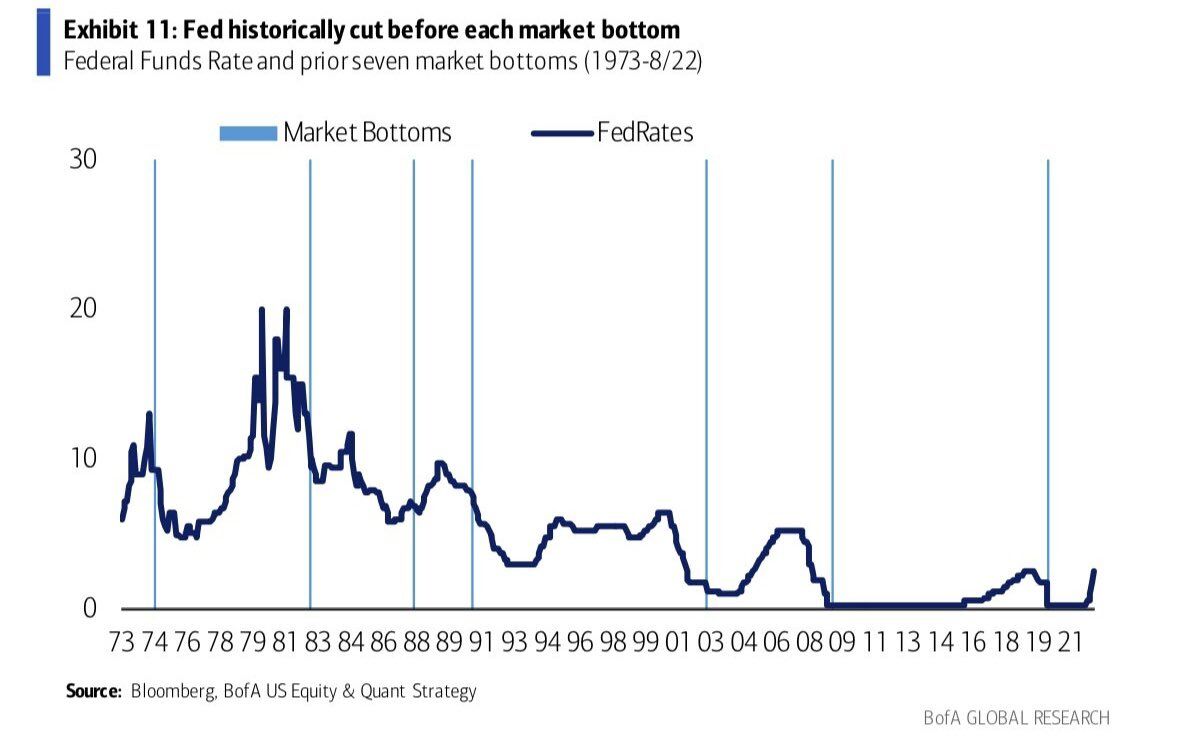
The data suggests it’s still too early to get bullish on stocks again and we recommend to wait for a more accomodative policy from the FED.
How long did US stocks take to recover losses from a 25% crash?
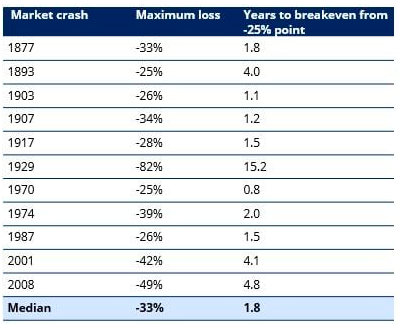
Past Performance is not a guide to future performance and may not be repeated.
Our previous market chart reports
May 20 end See end of publication sector review
March 15 what are the charts telling us
Stay tuned