What Are the Charts Telling Us ?
March, 15 2022Our sector and technical analysis to identify where in the business cycle we are and to be in phase with the market trend – as explained HERE – is a real support to our asset allocation and timing.
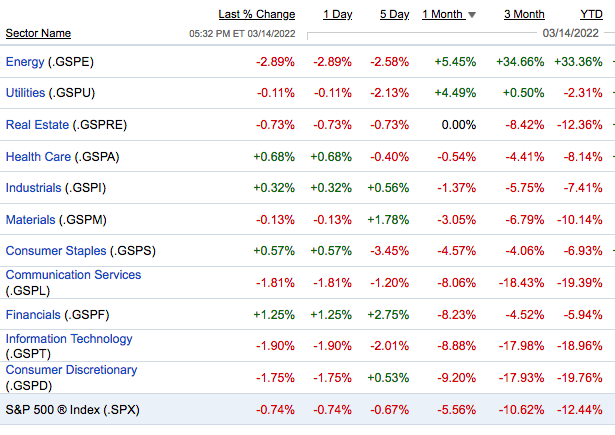
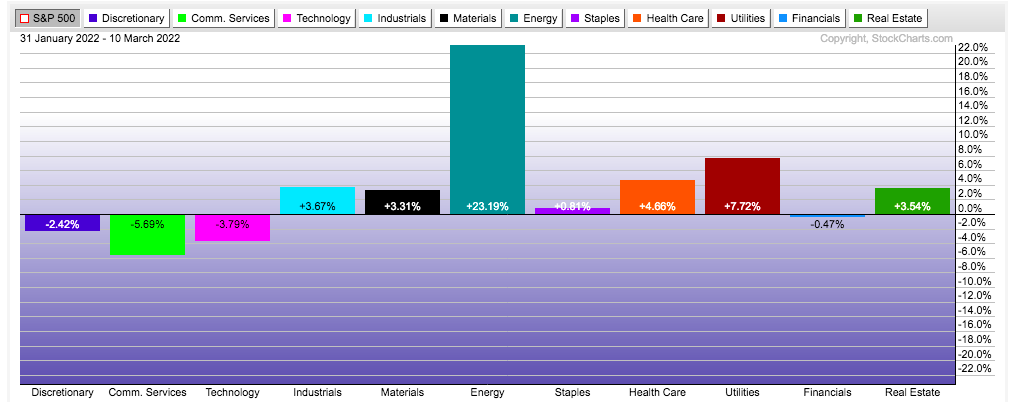
As mentioned the last weeks the various sector performances confirmed a change in economic environment and in sector leadership.
The past 30 days recorded the best performance for the recommended sectors according to our ABS Matrix in the Late Cycle period. (see last week daily brief comments ).
Let’s review some
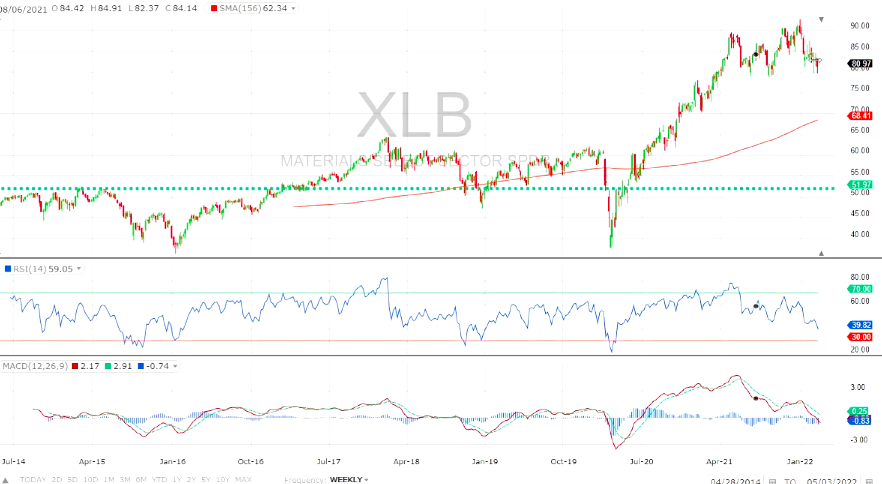
Sectorwise we maintain our choice to MATERIALS technically strong
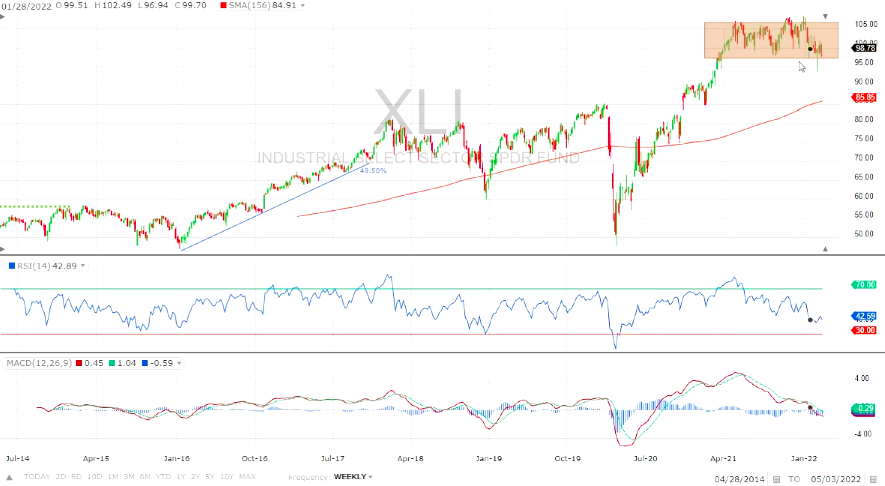
as well as INDUSTRIALS .
Of course if a recession materialize the groups will suffer and obviously the demand for commodities and metals will strongly decrease hence weighing on prices and favoring lower inflation.
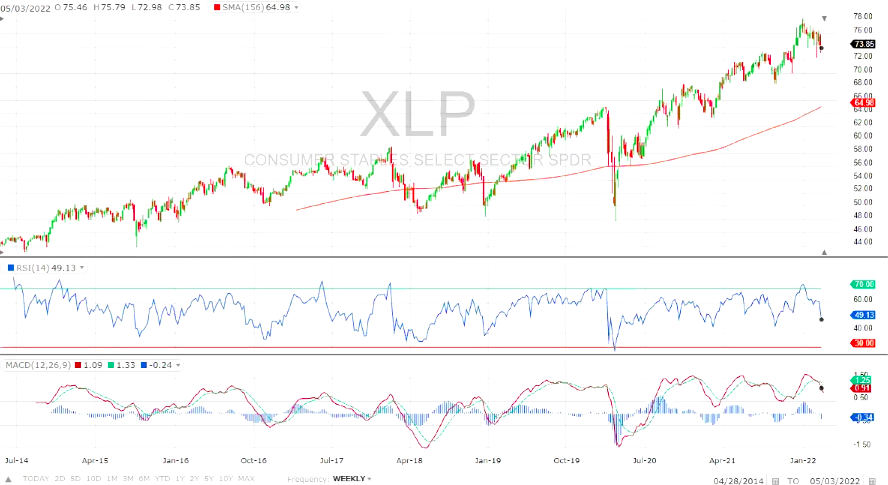
Meanwhile CONSUMER STAPLES are positive.
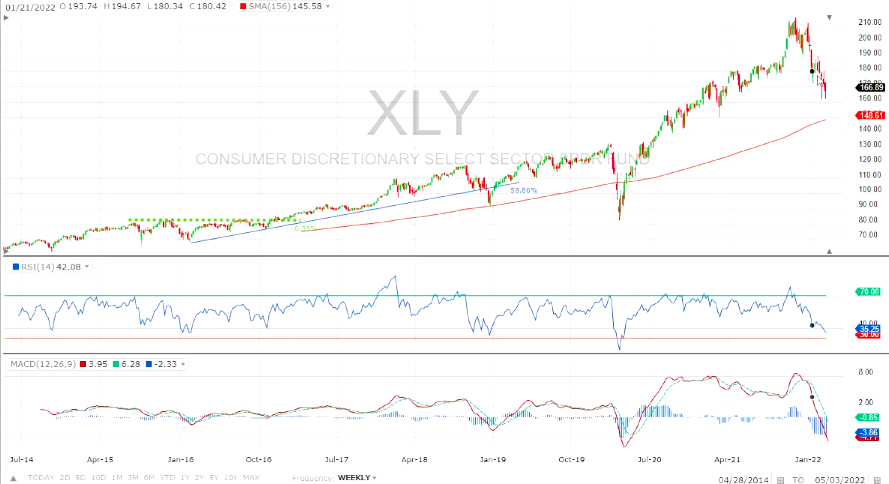
On the contrary, the DISCRETIONARY are vulnerable and in a downtrend.
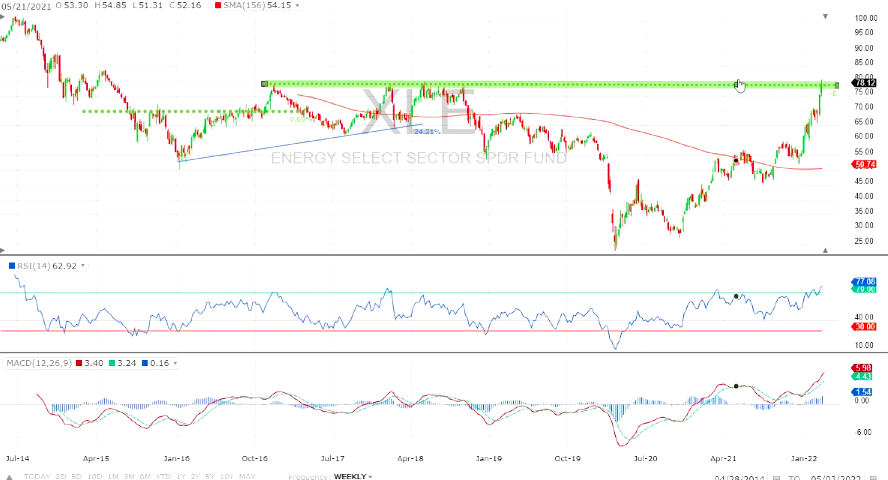
ENERGY sector look a bit overbought but remain positive
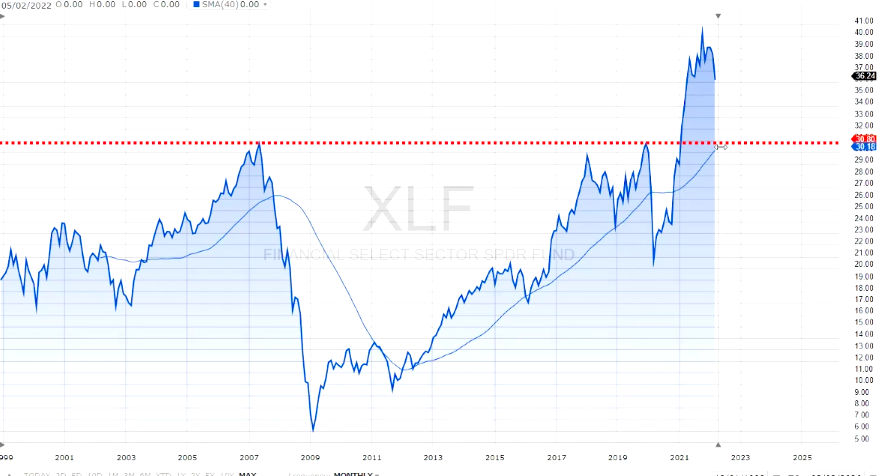
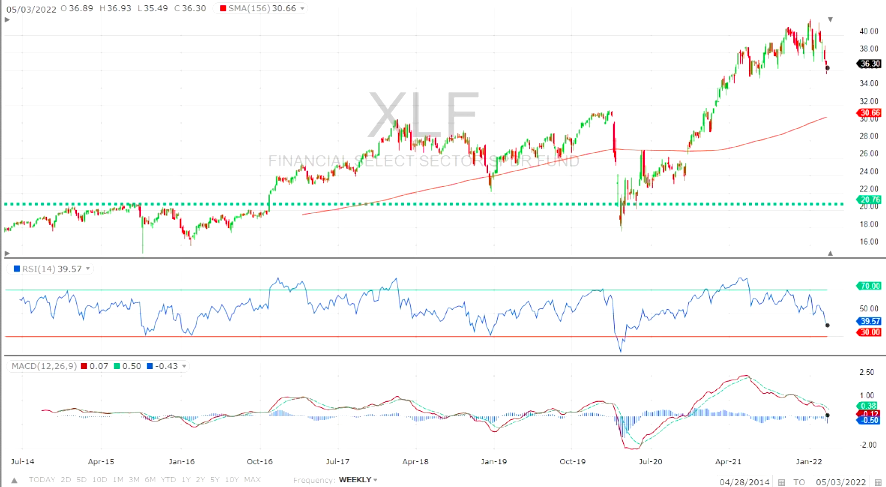
Despite some correction the FINANCIALS is still in a long term uptrend.
ENERGY sector look a bit overbought but remain positive
As a strategic anchor, the value proposition is kind of defensive. Energy stocks could be a pure play if you are a structural inflation bull. And gold can be another great inflation hedge.
Looking at the EMERGING MARKETS we have clearly a downtrend and a unstable situation
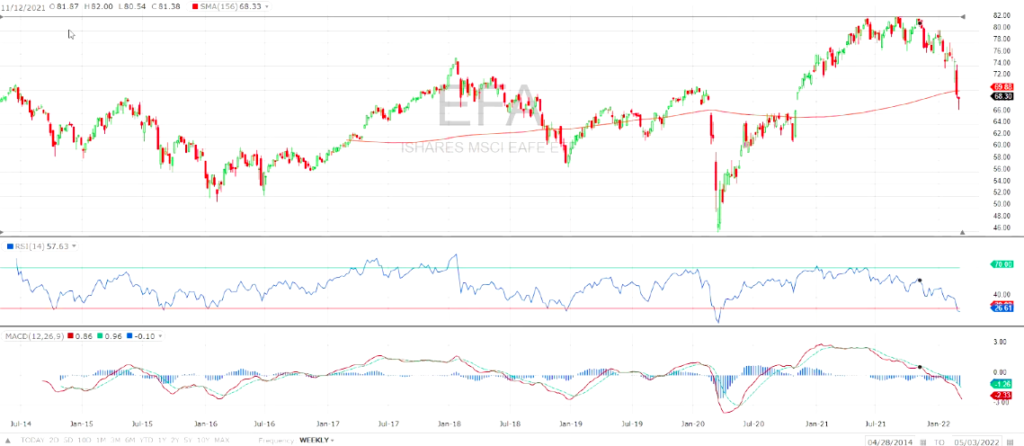
In Europe equities took a battering as the war in Ukraine ramped up; but we maintain our technical positive stance for European MATERIALS: which could outperform.
In our scenario based on previous market or macro shocks, central banks will be the lender of last resort to provide decisive support to the markets. Equity markets are getting cheaper but earnings forecasts have not been adjusted by consensus yet.
As rates rise, fundamentals such as earnings and valuation may become increasingly important. Stocks are unlikely to produce the strong returns they’ve delivered since the 2020 rate cut.
Historically, stocks have delivered lower returns immediately after the start of a period of rate increases, but returns have increased over the longer term. Certain sectors have also historically fared better than others when rates rise. Banks and other financial firms, for example, tend to benefit from high interest rates, as they can make more money on loans.
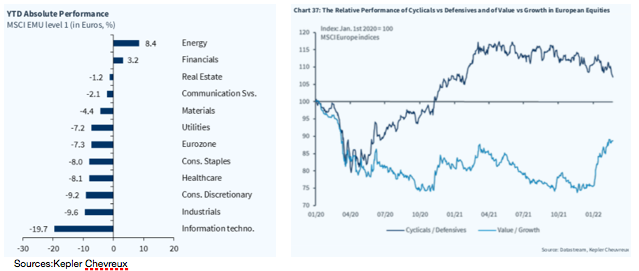
We think it’s safe to say that on a rate-of-change basis there is a transition underway, from accelerating returns to decelerating returns, from rising P/E ratios to falling P/E ratios, from growth to value, from disinflation to inflation, and to real assets.
What does this decelerating long-term trend, combined with near-term headwinds, mean for asset allocation? Based on historical analogs and recent return patterns, it appears that value is looking attractive relative to growth, and real assets (such as commodities) are looking attractive relative to financial assets.
Until next time !


