

RSI : Discussing A Stock Sell Signal
November, 27 2023
November has generated a short-term RSI sell signal.
US stocks are on pace for double-digit gains this year. The S&P is up roughly 18%, as of late November, after adding 8% thus far this month. Improving inflation data has sparked hopes of an end to the Fed’s restrictive monetary policy. But some Fedspeak lately has indicated the US central bank may not be done raising rates just yet. That, plus concerning housing data and lingering geopolitical developments, could put some of this year’s gains in jeopardy.
If you make shorter-term investing and trading moves, the relative strength index is an indicator that can help you evaluate which direction stocks may head over the short term. The gains that stocks have made this month have pushed RSI to an overbought reading, suggesting the November rally may lose some of its short-term momentum.
What is RSI?
Let’s dive deeper into RSI so you can get a better sense of the signals that it can give. Essentially, RSI is used to determine whether an investment is overbought or oversold by measuring the speed and change of price movements. It’s intended to evaluate the relative value of a stock, index, or other investment using recent price history.
RSI is a momentum oscillator, a type of technical indicator that fluctuates in a range, usually from 0 to 100. It is calculated using the average gain and average loss over a defined period of time. Like other oscillators, RSI is considered to be most applicable in non-trending markets (i.e., not clearly trending up or down).
The formula of the RSI is as follows
RSI= 100-(100/1+RS)
Where the RS is the average up closes of the last N days divided by the average down close of the same period.
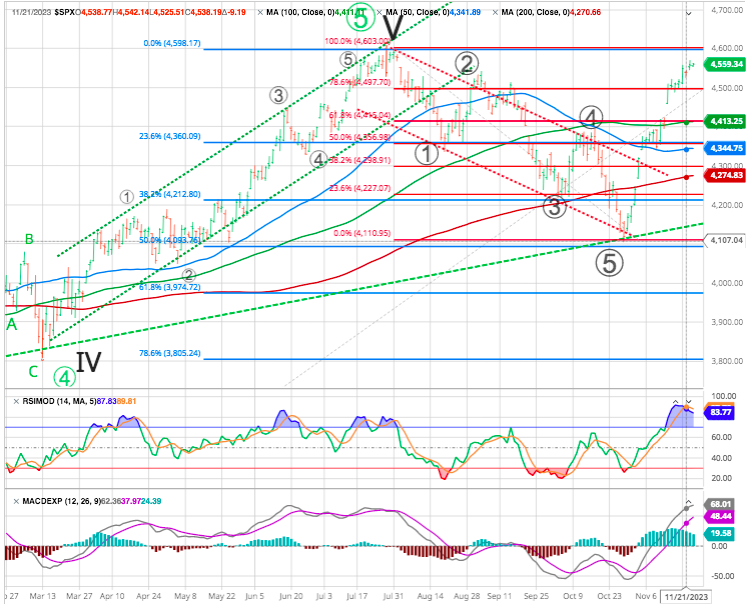
In the chart below, RSI is the green line in the section below the S&P 500 price. Investors using RSI generally stick to a couple of simple rules. First, low RSI levels, typically below 30 (red line), indicate oversold conditions—generating a potential buy signal. Conversely, high RSI levels, typically above 70 (green line), indicate overbought conditions—generating a potential sell signal.
Some RSI users adjust these rules based on their own preferences. Instead of using 30 and 70 as oversold and overbought levels, for example, one common modification is to widen the parameters to 20 and 80. Here, if RSI were to drop to 20, that would generate a buy signal. Alternatively, if RSI were to rise to 80, this would generate a sell signal.
Trading signals generated by RSI are generally thought to be most valid when values reach an extreme reading near the upper or lower end of the boundaries. An RSI reading near 100 (the top of the RSI scale) would be greater evidence of overbought conditions (a sell signal), while an RSI reading near 0 (the bottom of the RSI scale) would suggest oversold conditions (a buy signal).
Trading signals generated by RSI may also be given more credence when the reading rises above 70 and stays above that level for an extended period of time, or drops below 30 and stays below that level for an extended period of time.
However, overbought, and oversold assets do not necessarily rebound right away meaning that it is highly recommended to get confirmation from another indicator to verify the buy/sell decision and not to rely solely on RSI signals.
What RSI says about stocks now
The chart of the S&P 500 above shows how stocks have recently recouped roughly all of their summer decline. That has helped put markets back on pace for a double-digit advance during 2023.
The November rally has also pushed RSI over 70—an ovebought reading. However, this doesn’t necessarily generate a hard sell signal, especially for those that prefer to use the 80 RSI level as a sell signal line.
It’s also worth noting that the S&P 500’s RSI is not at extreme levels nor has it been trading above a sell level for very long. In sum, the recent gains for stocks have generated an RSI sell signal, but traders using RSI may want to monitor stocks for additional evidence of a stronger sell signal.
More uses of RSI
RSI can remain in overbought or oversold territory for an extended period of time (weeks or even months). That is, if RSI were to move above 70 or below 30, it would not be uncommon for it to remain above or below those levels for some period of time without retreating back to neutral RSI territory between 30 and 70 (or between 20 and 80, depending on the levels that you use).
In addition to the overbought and oversold signals that RSI can generate, it is possible to dig a little deeper into the relationship between RSI and the price action of the stock or index.
A positive RSI reversal, for example, might occur when RSI makes a higher highs (a relative low point on the chart that is higher the most recent previous low) although the price is still dipping. This would be a bullish move generating a buy signal.
A negative reversal could occur when RSI forms a lower high, but the price forms a higher high. This would be a bearish move, generating a sell signal. The S&P 500 has not recently exhibited a positive or negative reversal.
Trading the RSI
Overbought/ over sold: the over bought is defined as when the indicator lies anywhere above the 70 levels and the oversold zone is when the indicator is anywhere below the 30 level. Accordingly, a simple strategy is to sell when the RSI crosses down the 70 levels and buy when the RSI crosses up the 30 levels.
For educational purposes only
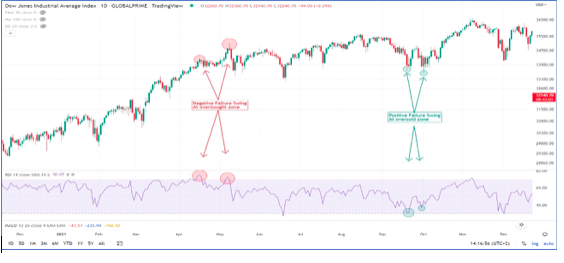
Failure swing: a negative failure swing occurs when the RSI reaches the overbought area (over 70) declines and then rises again to a level below the first peak. The sell signal is triggered when the bottom connecting the two peaks is violated. A positive failure swing occurs when the RSI breaks the 30 to the downside, rises, and then declines to a level above the first bottom. An upside breaks of the peak connecting the two bottoms is a buy signal
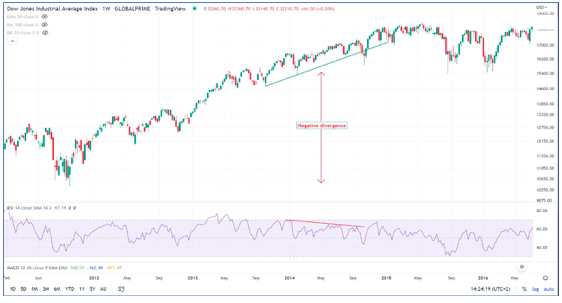
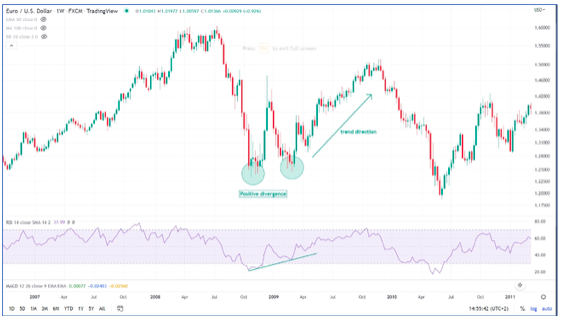
Divergence: a positive diverge occurs when eh prices make a lower low, while RSI makes a higher low. Usually, divergences are stronger if occurred at oversold levels. A negative divergence occurs when prices make a higher high while the RSI makes lower high, negative divergences are stronger at overbought levels.
RSI in action
It should go without saying that you shouldn’t trade on this indicator alone. RSI and other chart indicators should be used in conjunction with fundamental analysis, business cycle analysis, and any other information that aligns with your strategy.
More importantly, trends in inflation, potential moves by the Fed, earnings results, and other factors have the power to override any chart trends. With that said, the charts may be giving a caution sign as we approach the end of 2023.
NOTE :
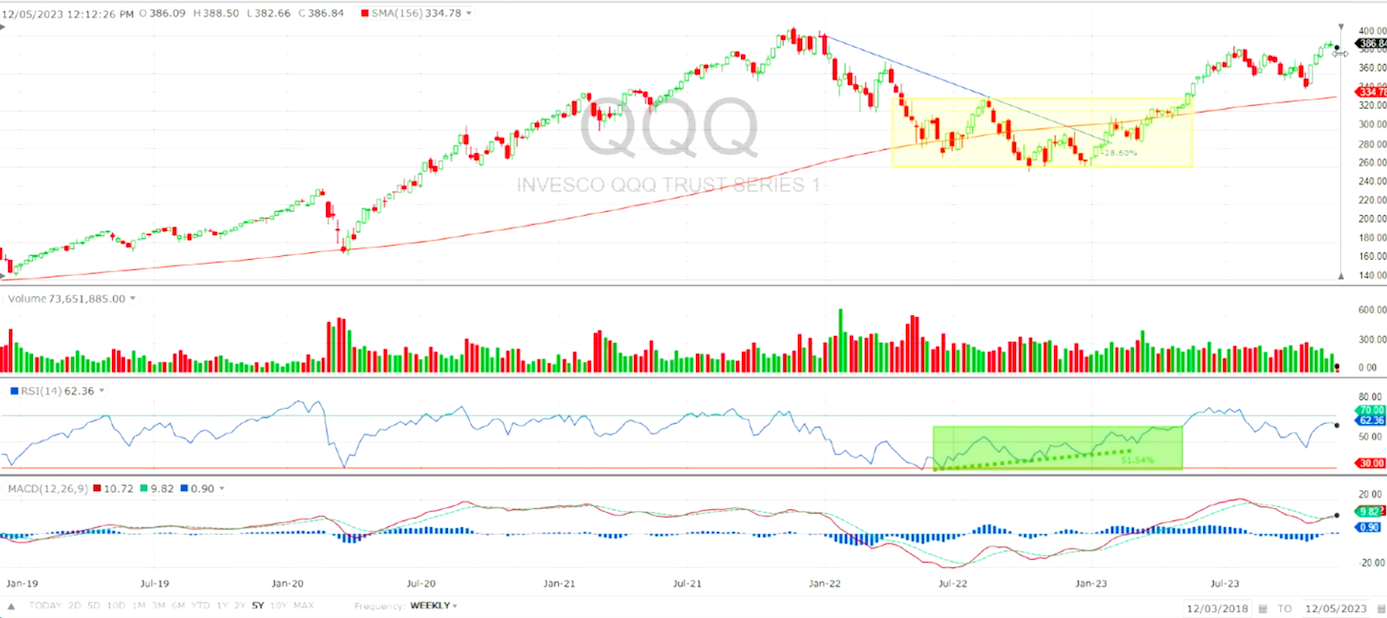
You can also see on the graph that the MACD oscillator is still trending up along the RSI. However both indicators measure momentum in a market, but, because they measure different factors, they sometimes give contrary indications. You can see on the QQQ graph that the MACD oscillator might turn down ( never anticipate a signal !).
For example, the RSI may show a reading above 70 for a sustained period of time, indicating a market is overextended to the buy side in relation to recent prices, while the MACD indicates the market is still increasing in buying momentum. Either indicator may signal an upcoming trend change by showing divergence from price (price continues higher while the indicator turns lower, or vice versa).
The various signals generated by MACD appear to have supported a bounce several months back, and now are somewhat mixed. This potentially suggests short-term caution may be warranted, according to this indicator.
SEE also MACD signals caution for stocks and Our Multi Time Frame Oscillator System + The Decider : The Market is always Right
Until next time
*Sources : Fidelity Investments