

Our Toolbox : Chart Trend Indicators (2)
January, 05 2024
Benoit Mandelbrot, the mathematician who discovered fractal geometry, once said: “Financial markets, like nature, exhibit a fractal geometry where patterns repeat at different scales. Understanding these fractal patterns is key to deciphering the complexities of market behavior.”
By understanding the underlying forces driving these patterns and accurately pinpointing a price’s position within the cycle, traders can gain a significant edge in identifying optimal trading opportunities and honing their risk management strategies.
To help us there are many possible approaches. In our toolbox we use the Fibonnaci ratios and the Elliott wave theory coupled with our Multiple timeframe oscillator system.
Today let’s review the moving average crossover system following last week golden cross identification see Our Toolbox : Chart Trend Indicators (1)
Moving Average
A moving average is a lagging technical analysis indicator of which its main function is to smooth prices thus decreasing price noise and creating constantly updated average price. That said, moving averages would identify price trends, support and resistance levels.
Moving averages can be set for different periods. The most used periods are 10, 20, 50, 100 and 200 moving averages. The longer the moving averages, the greater the lag, the 200 days moving average will have greater lag than the 20 days moving average because it contains price averages for 200 days be it simple, weighted or an exponential moving average.
Moving Average Crossover System
Moving averages used to identify trends and act as support and resistance. Entry and exit levels can be identified as follows:
![]()
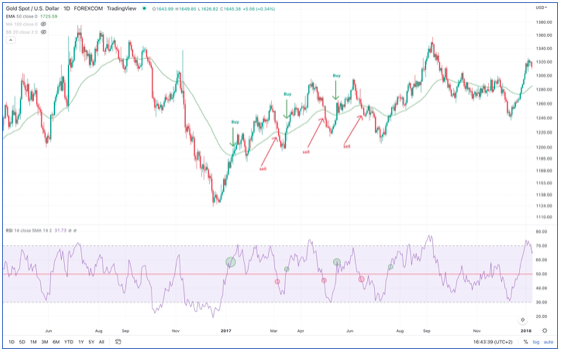
- When MA (here 20 in orange) intersect below prices we get a bullish signal warning such as early in 2023 in January and early April (green dotted circles). Respectively when the MA intersect above prices we have a warning bearish signal as in August 2023 (red dotted circles).
- A short term MA signal may be too erratic, investors might well wait to get a confirmation signal with a longer MA (here the 50 days in blue), in circles.
- We can set a moving average crossover system where we use the 20 days and the 50 days moving averages to confirm where we are on the index and decide accordingly. (See the Green and Purple Arrows showing the intersections).
- Usually a golden cross is identified as the crossing of 50 DMA and 200 DMA.
As long as the trend above (respectively below) the stock/index price we stick to the trend (Arrows).
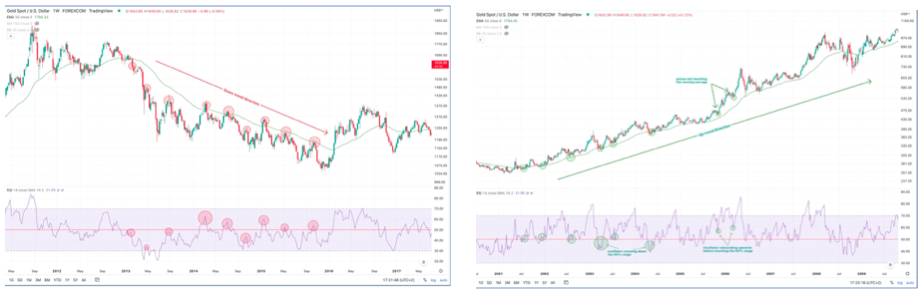
On a monthly basis, as we like to have a long term time horizon for investments, we also use the 6 month and the 10- month exponential moving averages to identify where we are on the index, ETF or stocks and which of them are in position to be bought/sold.
If the 6-month moving average is above the 10-month moving average, then it point to a buy. We call this setup being in bullish alignment. When the 6-month moving average is below the 10-month moving average, the setup is referred to as a bearish alignment.
On the chart below you can see that the moving average crossover system provided some excellent long term buy and sell signals that would have allowed investors to capture long duration moves in the index. The red arrow shoes the last Major Trend SELL SIGNAL Avoiding costly drawdowns allows to meet the objective of capital preservation.
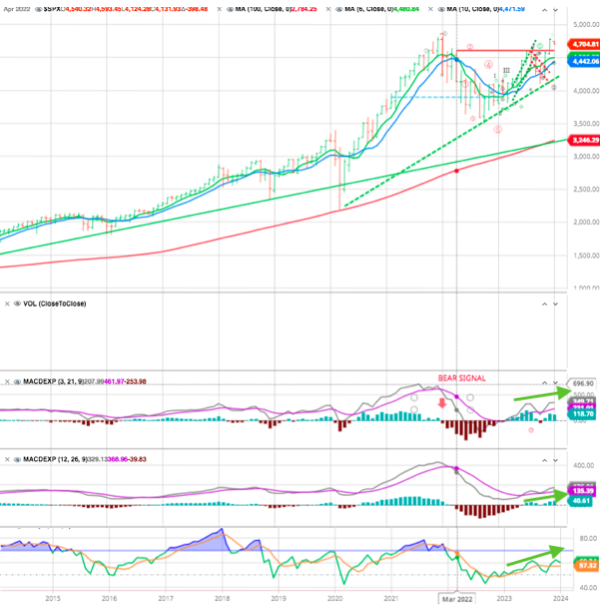
Moving averages are lagging indicators mainly used to identify trends and it is usefull to use them with other technical indicators such as Relative strength indicator or MACD oscillator which signals over bought and oversold status of the security by measuring the magnitude of price movements.
see our previous articles in this section
On the above monthly price graph we add the MACD s.t and m.t as well as the RSI. We can see that all of them are moving higher which is positive for the long term investments at the moment.
Combining Relative Strength Index With Moving Averages
As stated above, moving averages are lagging indicators mainly used to identify trends while the RSI is a leading momentum indicator which signals over bought and oversold status of the security by measuring the magnitude of price movements.
For educational purposes only
The drawback of this tactic is that the trader might fall in the pitfall of whipsaws or false breaks and overtrading.
Price crossover: in a trending market, a trader can take a long position when the RSI crosses the 50% upward and the prices close above the moving average. Same applies for taking a short position when the RSI crosses the 50% range downward and prices close below the moving average. The drawback of this tactic is that the trader might fall in the pitfall of whipsaws or false breaks and overtrading.
Stay tuned
BONUS