

Our Toolbox : Chart Trend Indicators (1)
January, 03 2024
Global stocks plunged in 2022, but the market’s trend has been strongly positive in 2023. The MSCI World Index is up 20.5%.
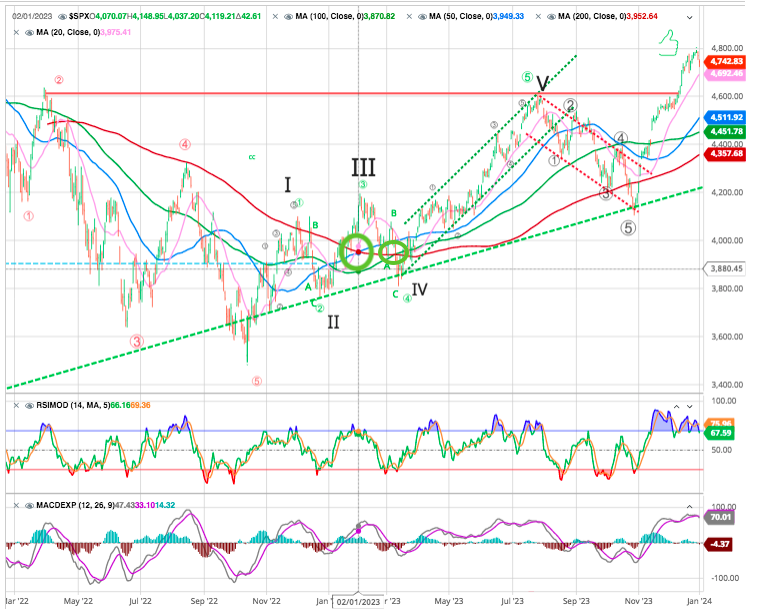
The January barometer—which notably has been accurate multiple years in a row—gave a positive signal for 2023. Then, after flirting with a crossover signal in February, a golden cross appeared in the charts in the spring.
A golden cross is a bullish moving average crossover signal that occurs when a shorter moving average (50 days in blue) crosses above a longer moving average (200 days in red). S&P 500 makes a golden cross in February (green Circle ) and confirmation in March (100/200) golden cross, since then the S&P has gained more than 15% . The rally has erased almost all of 2022’s losses and has pushed US stocks back near new all-time highs
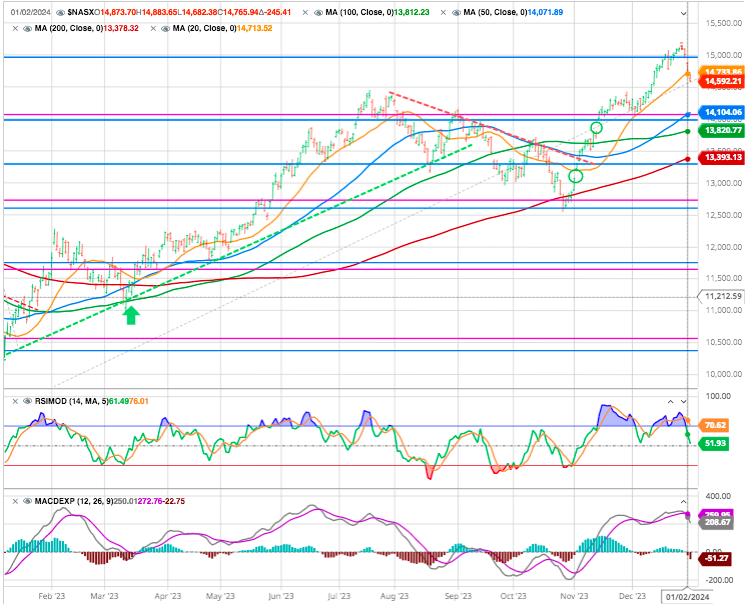
As well as the NASDAQ : see green arrow
Also see our previous articles in this section
So Goes January
From an investment management perspective, we can look at some of the statistical evidence for January to gain insight into future performance tendencies. From this analysis, we can gain some respect for the risks that might lie ahead.
According to StockTrader’s Almanac, the direction of January’s trading (gain/loss for the month) has predicted the course of the rest of the year 75% of the time. From a broad historical perspective, the chart below shows the January performance from 1900.
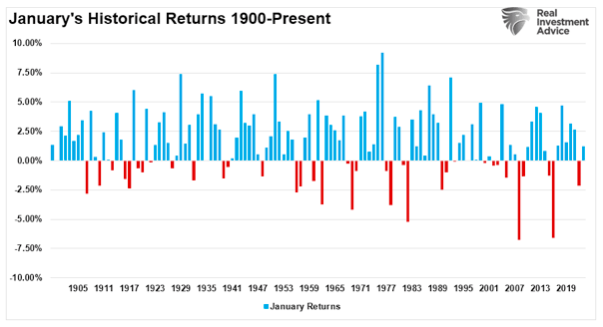
The critical point is that January tends to be one of the best return months of the year, while February and March are significantly weaker. Furthermore, twelve of the last sixteen presidential election years followed January’s direction.
Looking ahead, chart users might strongly weigh this coming January’s market performance—given that the January barometer technical indicator has been reliable in recent years—as well as keep an eye out for future moving average crossover signals that could hint at a trend reversal.
Interest rates and prices for goods dominated investors’ attention in 2023. Slowing inflation growth helped investors look past rising rates throughout the year.
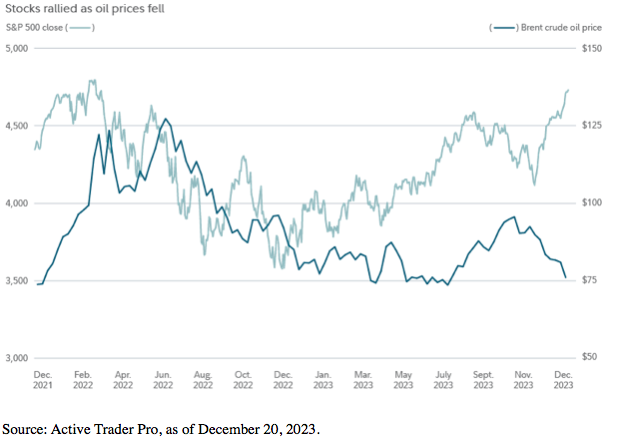
A chart of oil prices and the S&P 500 shows that, once oil receded well below $100 a barrel, stocks began their rebound (see Stocks rallied as oil prices fell chart).
Gas prices, which can greatly impact consumer spending, are down roughly 7% t in 2023 and are down more than 20% from the 2022 peak. But energy prices, which are always a key factor to watch, can swing in either direction at any time.
Meanwhile, many investors expect rates may move lower this year, but Federal Reserve officials have not signaled that multiple rate cuts are assured in 2024. Whereas widespread expectations heading into 2023 were for rates to rise, the forecast for rates in 2024 might not be as certain.
Big tech bolsters large caps
For the fourth straight year, large-cap stocks—and mega caps in particular this end of 2023 year—are on pace to outperform both mid-cap and small-cap stocks :
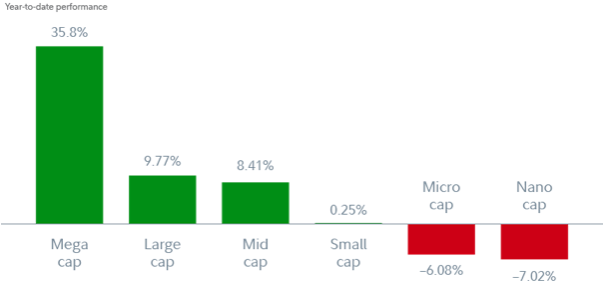
Source: FactSet, as of December 20, 2023.
Big tech’s resurgence—including the FAANG stocks—was a primary driver of mega-cap outperformance. After tech and communication services were among the worst-performing sectors in 2022 (losing 29% and 41%, respectively), they have rebounded in a massive way in 2023. Significant cost cutting, exuberance about artificial intelligence, and expectations that interest rates might peak all helped bolster many mega-cap tech and communication services companies.
Will large caps once again lead in 2024?
 It’s important to remember that performance variation by market cap can vary significantly as economic cycles change, along with other factors. Typically, large-cap stocks outperform when investors are looking for less-variable earnings and revenue streams. Relatively smaller-cap stocks may outperform during phases of the business cycle when economic growth is accelerating.
While large caps have far outpaced other market caps recently, medium-cap and small-cap stocks have outperformed large caps over the past 25 years. The big rally for large-cap stocks in recent years has made them relatively more expensive versus other market caps, which may bode well for investors that are interested in rotating, to some extent, to medium- or small-cap stocks.
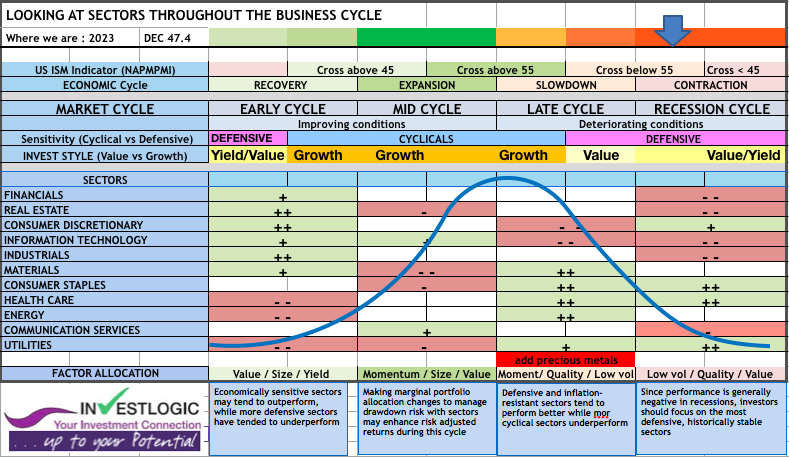
With that said, according to our ABS model the US and most other developed economies are in the late /recession stage of the business cycle—which tends to favor larger, more stable investments.
Charting 2024
2023 was a year for the record books. The Dow surpassed 37,000 for the first time ever (is Dow 40,000 on the horizon?). Gold prices shot past (and finally held above) $2,000. US home prices are at record highs. There’s no shortage of market factors for investors to stay on top of going into the new year. Keep an eye on the charts for clues to help best position yourself.
Check second section in Chart trend indicators (2)
Until next time
*source Fidelity Investments