MARKETSCOPE : The Trend Is Your Friend
January, 17 2023
Circus World
As January goes every year, this week the World Economic Forum is starting its first winter meeting in the Swiss ski resort of Davos since before the pandemic, but there are big China- and Russia-shaped holes in the delegate lists.
On the agenda – the cost-of-living crisis, the threat of natural disasters and extreme weather events, geo-economic confrontation and failure to mitigate climate change – the top risks over the next two years according to a survey of WEF members.
Other usual suspect the coming Washington psycho drama on the ceiling of the Federal budget and its traditional closures. While the issue is usually one of political theater that tends to be resolved before the country shoots itself in the foot with a voluntary default, things may turn out a little differently this time. This year it might weigh on the markets.
Meantime the World Bank has slashed its 2023 global growth forecast by almost half – from 3% to 1.7% – as elevated inflation, higher interest rates, reduced investment and Russia’s invasion of Ukraine constrain economic activity. If that wasn’t enough, the Washington-based lender warned that any new adverse shocks could push the global economy into recession.
Over in the U.S., the economy is expected to experience 0.5% growth in 2023, 1.9 percentage points below previous forecasts and the weakest performance outside of official recessions since 1970. There is a lot of debate about whether the U.S. and the eurozone will go into recession or manage a soft landing.
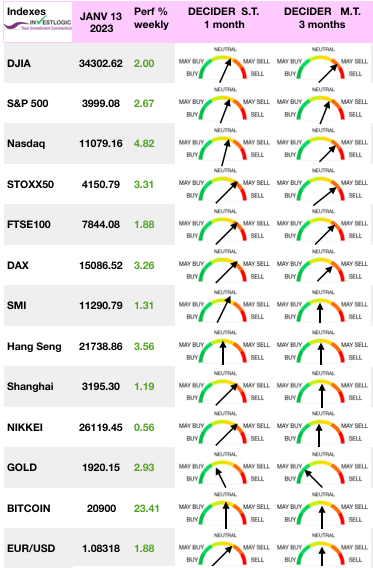 Stocks pushed higher Friday as the three major market benchmarks booked their best weekly percentage gains since November, after companies began reporting their fourth quarter earnings results, kicked off by several of the big banks. Bank of America, Citigroup, J.P. Morgan and Wells Fargo all ended higher even as some said they are expecting a mild recession. The Nasdaq and growth-oriented sectors outperformed, helped by rebounds in some mega-cap technology-related names.
Shares in Europe rallied for a 2nd consecutive week as early data suggest German economic growth stagnated in Q4. Eurozone jobless rate stays at record low; investor moral rises.
On the economic front, the University of Michigan consumer sentiment index climbed in January to its highest level in nine months, which followed December’s consumer price index data released Thursday showing prices declined slightly, headline prices fell 0.1% in December, a tick lower than expected and the first decline since May 2020. The drop brought the year-over-year gain to 6.5%, its lowest level since October 2021, boosting hopes that the Federal Reserve may soon slow its pace of interest rate hikes.
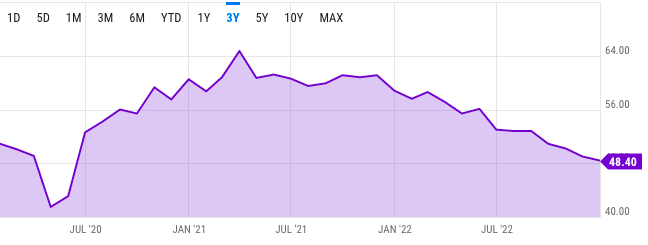
The December Manufacturing PMI registered 48.4 percent, 0.6 percentage point lower than the 49 percent recorded in November. Regarding the overall economy, this figure indicates contraction after 30 straight months of expansion. The Manufacturing PMI figure is the lowest since May 2020, when it registered 43.5 percent.
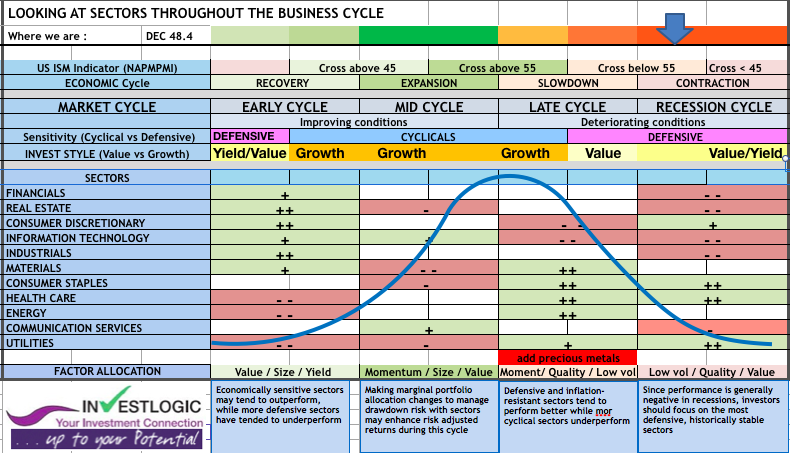
As discussed in the past, throughout our career, we have leaned on two key indicators that have proven to be reliable signals of a future recession—the Treasury yield curve and the ISM Manufacturing Index. Anything above 50 indicates growth, and anything below means shrinking. Historically, when the index falls below 47, there is a confirmed recession. See ABS- Allocation to Business Cycle System
SEE our ABS presentation and Business Cycle & Sector Rotation also check previous comments and bottom
Stocks have a tendency to turn down before a recession even starts and then to rebound well before it’s over. In recessionary periods, as shown in our proprietary ABS Matrix defensive sector are the best positioned. See also 12/22/22 What are the charts telling us? and the next one .
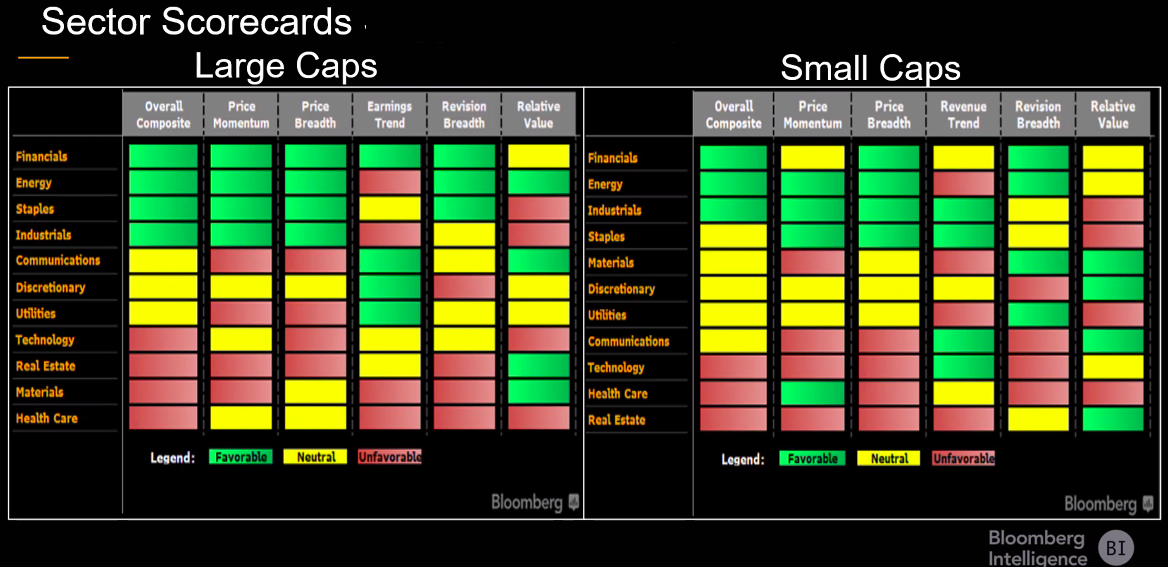
source Bloomberg Intelligence
The week will also includes a heavy slate of speeches from Federal Reserve members as the critical January 31-February 1 meeting of the FOMC starts to get closer.
In Europe, the economy is still resilient, as evidenced by a more robust than expected industrial production in November, according to Eurostat. However, there is still a sense of caution in the background, as investors are having difficulty accurately assessing the damage that rising rates will have on the economy in the months ahead.
MARKETS : A bird in the hand is worth two in the bush
The market has been hot out of the gate to start the new year. Perhaps too hot as the applause for softer inflation blocked out the noise that these lower prices happened because of serious recessionary red flags.
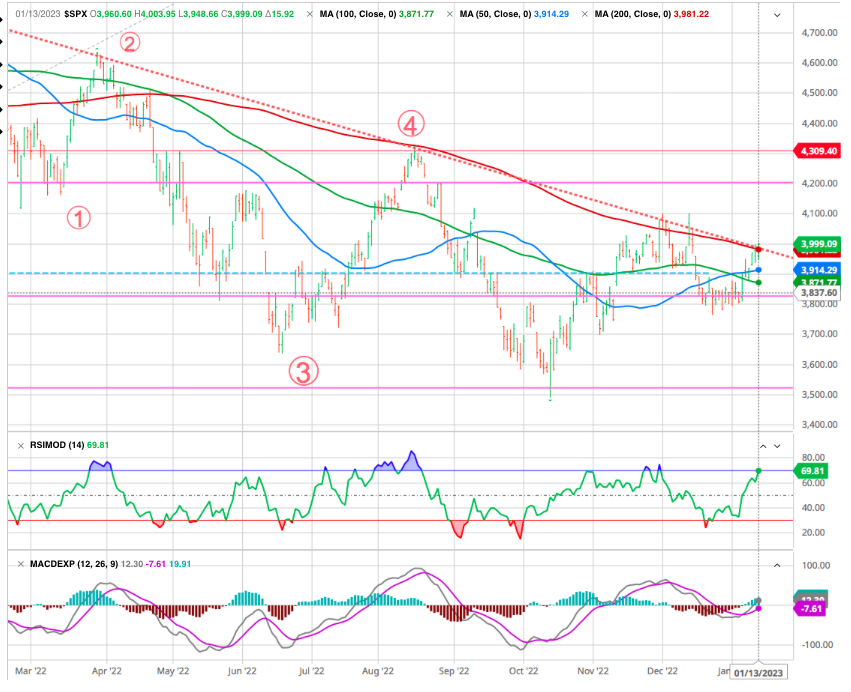
The main thing creating a lid on stock prices at the moment is a combination of the 200 day moving average at 3,990 followed by the psychologically important 4,000 level.
You could call that a double reinforced resistance level that will be hard to crack without clear and decisively bullish news from the Fed.
With the market approaching the downtrend line from last year’s peak, and as shown below, a higher low and tightening consolidation suggests a higher move is possible. While the market is short-term overbought, the MACD buy signal continues to suggest the possible counter trend rally.
Importantly, this is just an improving technical picture for the market short-term. The breakouts have not happened yet, and may not. However, given the technical improvement, a break above the downtrend and the 200-DMA will set targets between 4200 (50% retracement) and 4360 (61.8% retracement) of last year’s decline.
We do need to keep an eye on price action in the meantime with the 200 day moving average being of most pressing concern. The biggest trick with this statement is what does it truly take to break above and stay above.
As you can see from the S&P 500 year to date chart there have been a few times we broke back above the 200 day only for it to fail. Thus, hard to appreciate why right now would be different with the economy on the verge of recession.
While the current counter trend rally appears to be higher, there are still many risks to the market. Such is especially the case as we head into earnings season and the next Fed meeting.
Note that the US has not had an inflation induced recession since the 1980’s, so investors are a bit out of tune on how to handle this rare environment. Meaning they are far too interested in watching inflation data and predicting the likely Fed response as opposed to what they should be doing. That being to monitor the health of the economy as their guide of whether to be bullish or bearish.
If recession is on the way, that begets lower corporate earnings (typically 20% drop in EPS) -we discuss it below- and this begets lower stock prices given what investors are willing to pay for that weakened earnings profile.
Putting it altogether the fundamental investor in us still strongly foresees a recession and deepening bear market evolving in early 2023. Therefore, it is important to remain cautious until the markets declare themselves. We remain overweight in cash, and our bond duration remains short of our benchmark index.
However, we will adjust our holdings accordingly if these technical patterns mature. The trader in us hates to be on the wrong side of the 200 day moving average and will not fight that tide for long.
Yet with the recessionary clouds darkening and earnings season off to a rocky start and the Fed likely to repeat their hawkish “a long time” mantra at the February 1st meeting…where they are likely to pour cold water on bulls once again. This is why it’s very hard to be bullish at this time.
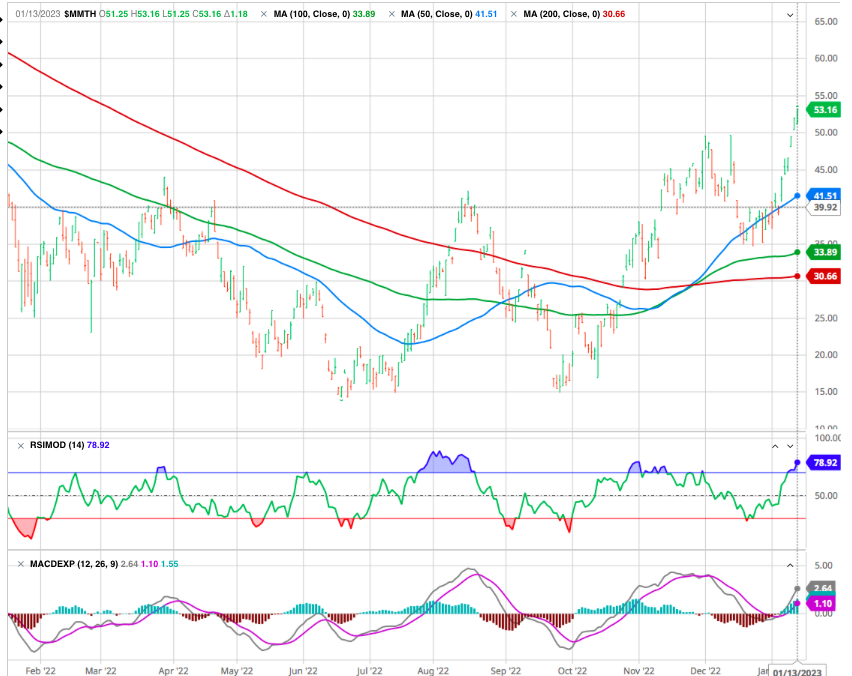
Number of stocks above their 200 DMA
To sum it up, we expect stocks to remain in this 3,800 to 4,000 trading range until we hear from the Fed. Or more specifically we think it will be very hard to break above that range.
USD
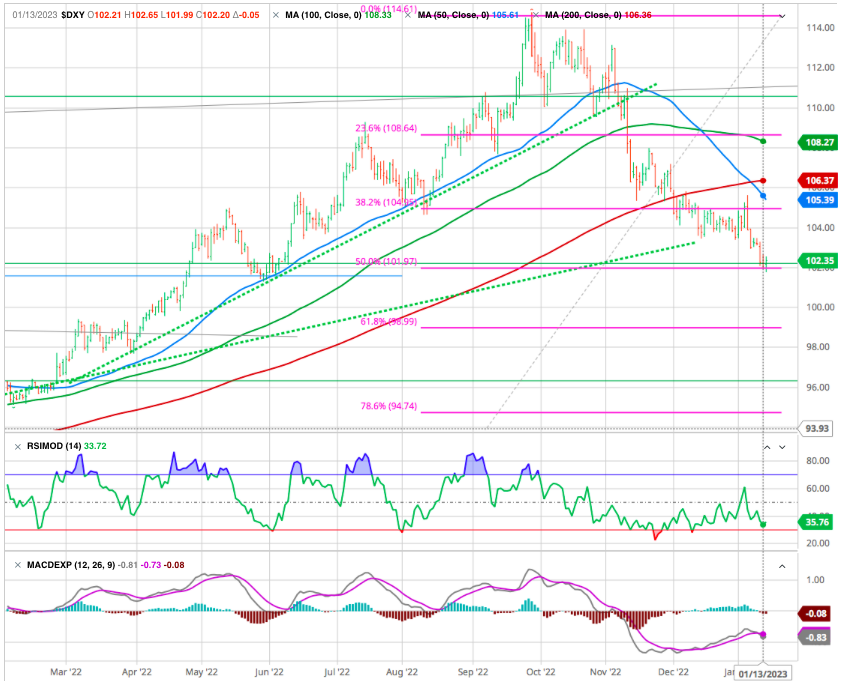
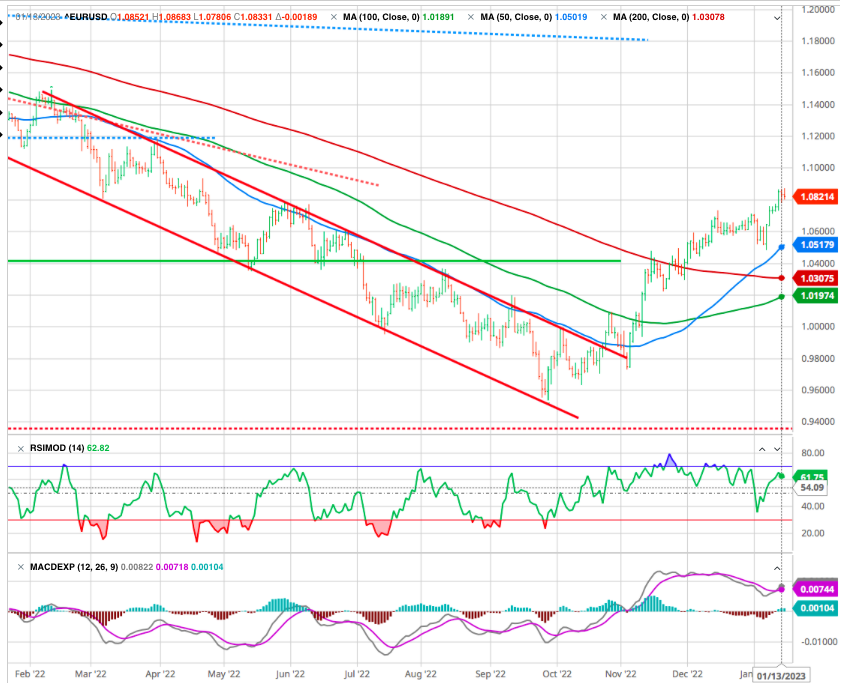
The U.S. dollar remained under pressure for most of the week, consistent with financial market sentiment that the Fed will be softer than expected in the coming weeks. The euro rallied to $1.08, its best level since April.
The dollar index made a local high at around 115 before a reversal sent it back below a series of key technical supports, including the 200-day SMA. A daily close below the 50% Fib retracement would trigger further decline towards the next support holding at 61.8% (98.8):
DXY
EUR USD
The EURUSD has been in a bearish channel since 2008. After hitting a low in 2016, the momentum improved, and then made two failed attempts to break 1.20 in 2021. But both failed, and then fell below a series of supports, including the former 2016 low of 1.03.
After a low of 0.95, the momentum resumed, and it broke a series of resistance levels (including the upper band of the bearish channel dating back to March) brightening the technical outlook. This pushed the pair above both its 200-day SMA and resistance at 1.0614 (the 38.2% Fibonacci retracement of the 2021 bearish sequence). ST, the RSI has been forming a bearish divergence, and a pause towards the 200-day SMA, (currently at 1.0310 would present a buying opportunity,
Cryptocurrencies
Crypto-investors can, at last, smile a little this week. Bitcoin is up more than 11% and back above $20,000 The cryptocurrency ecosystem will need to find strong internal catalysts to regain investor confidence after the destructive events of 2022.
Earnings Season Will Hang on Price-to-Recession
see John Authers in Bloomberg Opinion
Let’s press forward with a discussion of earnings season. The previous quarter was likely one of the worst in years as earnings estimates got slashed precipitously for coming quarters. Another round of that would be harmful to stock prices.
Here again, the average recession leads to a 20% reduction in EPS expectations. That is certainly not factored into stock prices at this time.
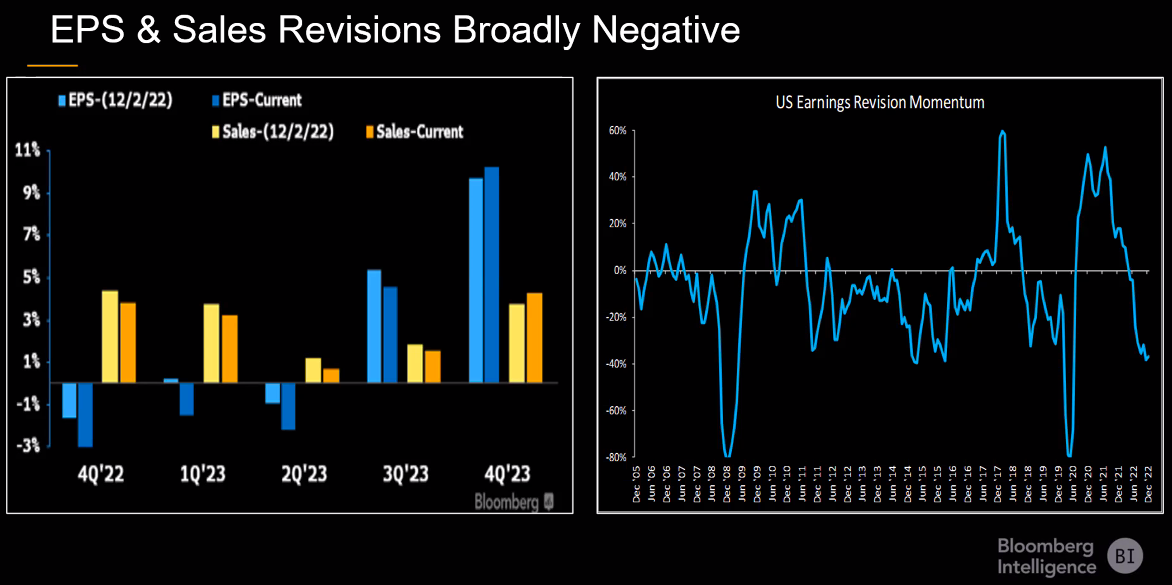
Globally, economies are slowing down, affecting profits of S&P 500 companies and increasing recession risks. All of this has played out into unusually gloomy earnings sentiment as the announcements approach.
The right chart below shows downward revisions running at a rate which in recent years has presaged a recession.. The left side is the EPS estimates
A certain amount of pessimism is reasonable. Bloomberg Intelligence analysts expect S&P 500 earnings to have fallen 3.1% in the fourth quarter, compared with a year earlier. They also forecast the S&P 500 EPS recession to kick off with January reports — and to last until the second half of 2023, with sales growth decelerating to a near-zero pace by midyear.
Consensus from top-down asset allocators thus far is, and has been for a while, that estimates are way too high. And because of this over-projection, the results are likely to disappoint investors, which will then lead to an additional bear-market decline of 10% to 20% from the current level.
If reported earnings this year merely match the likely final 2022 level of $181, then the current price-to-forward earnings (estimate P/E ) ratio is 21. In 2023, if earnings tumble just 20% from 2022 levels, then the correct current P/F ratio is 26, hardly a bargain.
It would still seem that earnings, and profit margins, will continue to get pressured between high borrowing costs and inflation, still suggesting downside risk to asset prices.
Instead, the Fed would most likely welcome such an outcome of a “controlled burn” lower in asset prices, a reversion of valuations, and a stable but slow economy. Such would allow the Fed ample operating room to reset its monetary policy tools for the next economic downturn.
Therefore, the ONLY reason the Fed will pivot concerning the monetary policy to an easing regime is if something breaks economically or financially.
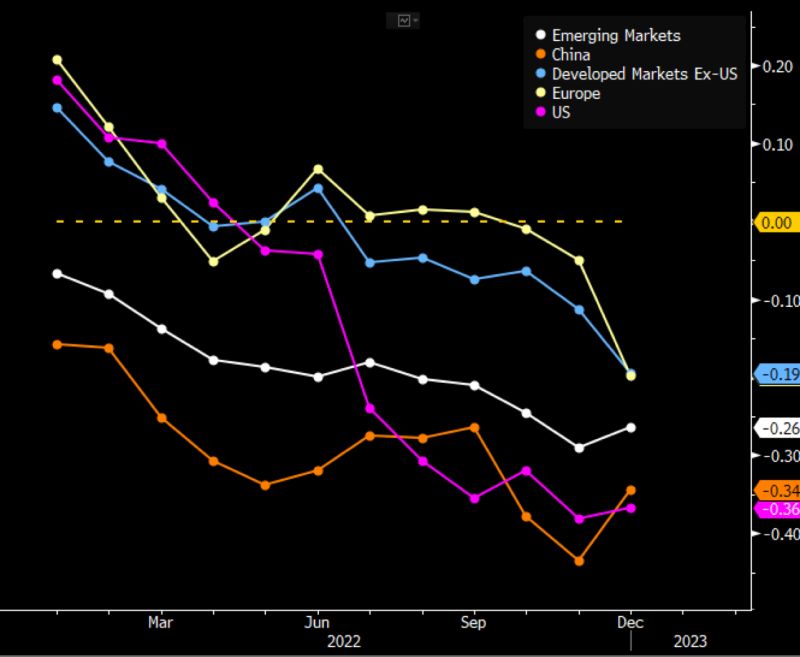
Gina Martin Adams • 1st Chief Equity Strategist at Bloomberg LP has just published this interesting chart
Invest wisely and live richly !
Happy trades
BONUS


