

MARKETSCOPE :The Market is Always Right
April, 15 2024

The stock market always acts to fool the greatest number of people
The financial markets were in turmoil this week, first reacting to better-than-expected US inflation data, then to lower-than-expected US producer prices and hopes of a rate cut in Europe in June. The week was the worst one for the S&P 500 since October 2023.
The major US equity benchmarks retreated for the week amid heightened fears of conflict in the Middle East and some signs of persistent inflation pressures. Large-caps held up better than small-caps, with the Russell 2000 Index suffering its biggest daily decline in almost two months on Wednesday. Growth stocks fared better than value shares.
For the third month running, US inflation showed signs of rising. CPI Core was up by 0.40% on a monthly basis, against an estimate of 0.30%. The new watched “supercore” inflation (services prices excl. energy and housing costs) jumped 4.8% yoy, substantially higher than expectations and its biggest increase in 10 months.
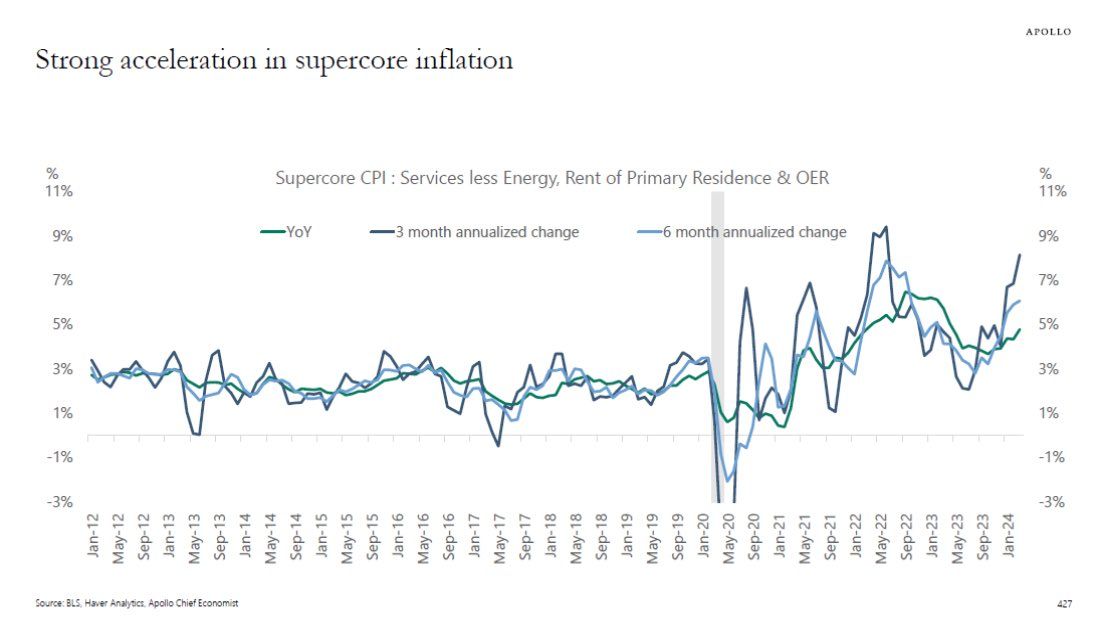
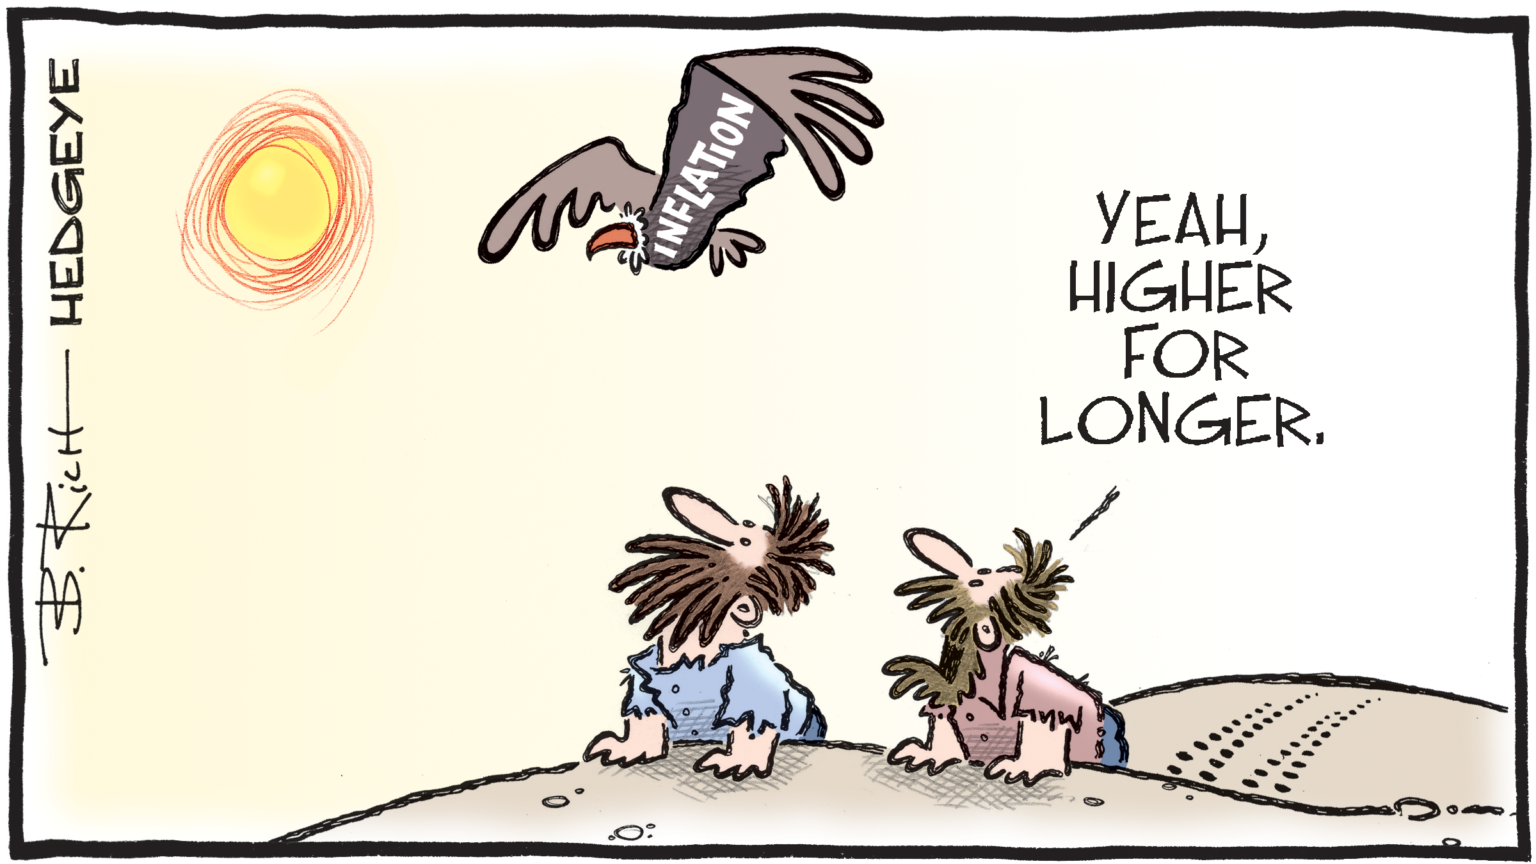
The 3-month annualized change in supercore inflation is now over 8% and accelerating. The Fed is not done fighting inflation and rates will stay higher for longer.
Against this backdrop, it’s no surprise to see yields tightening to the point of taking the US 10-year yield to the key long-term resistance level of 4.60%, pushing the dollar higher. It can also point to some choppy trading for the near future, just as the first-quarter earnings season kicks off.
The action of the European Central Bank (ECB) also played a crucial role. As expected, the ECB kept its key rates stable, while hinting at the possibility of an easing of monetary policy as early as June, should the economic situation so require. The STOXX Europe 600 Index ended 0.26% lower.
The Nikkei 225 gained 1.4% as the yen tumbled to fresh lows. In addition, the latest economic data from China, notably concerning inflation and the trade balance, did little to reassure us about the country’s current economic momentum.
Ahead
After a colorful week for central banks, macroeconomic news will focus on US retail sales (Monday) and China’s first estimate of Q1 GDP (Monday night).
The economic calendar will continue to garner attention following the recent spate of hotter-than-anticipated labor market and inflation indicators. Investors will be focusing on the March retail sales report scheduled for Monday and a reading on U.S. industrial production on Tuesday. Also on the docket will be housing starts and existing home sales data.
The corporate calendar includes some forty quarterly earnings releases from companies worth over $50 billion. These include Goldman Sachs, UnitedHealth, Johnson & Johnson and Netflix in the US, and LVMH, ASML, Rio Tinto and L’Oréal in Europe.
See the full list on Seeking Alpha’s earnings calendar.
MARKETS : Don’t throw the baby out with the bathwater.
The % of Bulls in the Investors Intelligence survey has moved up to 62.5%, the highest since April 2021.
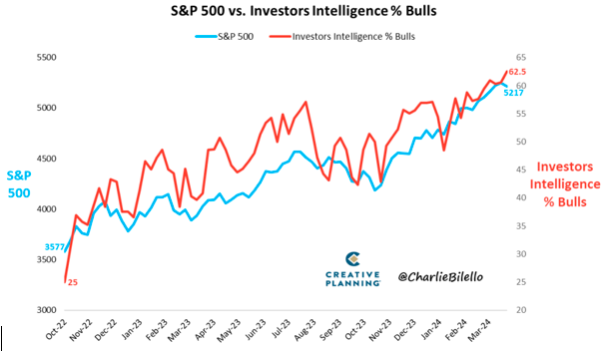
Should investors be fearful of this sign of greed, as Warren Buffett once admonished?
Moving from 6 interest rate cuts in 2024 to 3 to one or none cuts and the yield of the long bonds on the way to 4.75 % to 5.00 %, again, this may now play out.
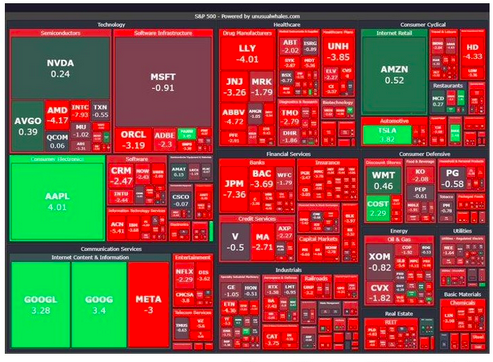
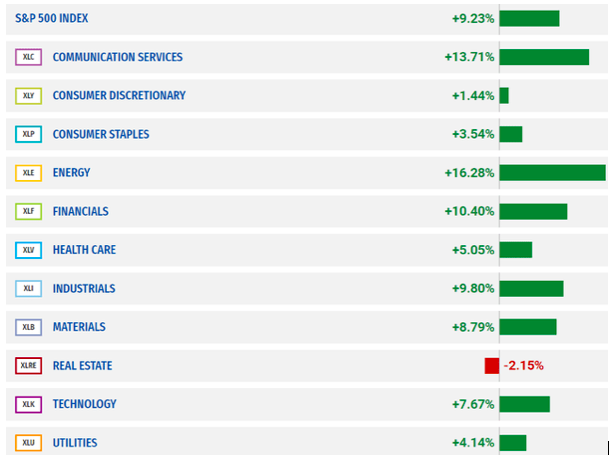
The S&P 500 rally YTD actually broadened to cyclicals such as Energy (XLE), Financials (XLF) and Industrials (XLI).
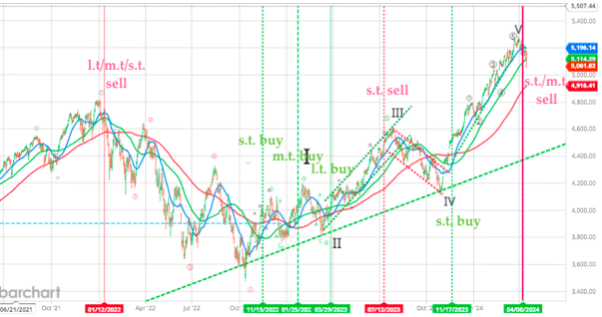
We can see a break below the trendline, and if confirmed by a weekly close, the trend reversal should be firmly in place.
Most of the market participants are glued to the chart. These are the trend-followers and momentum traders. They buy simply when the price is rising, and sell when the price is falling. Thus, obviously, the bearish phase has to be verified with the chart.
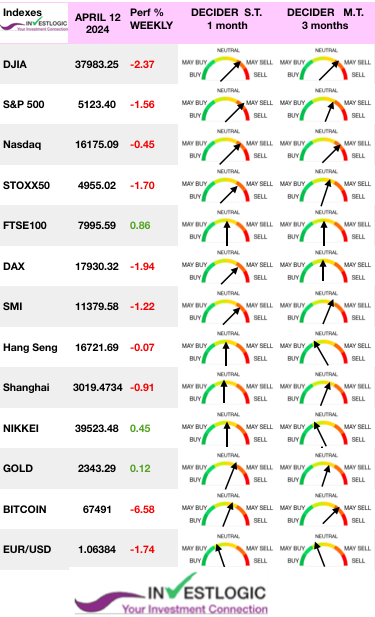
Last week, we discussed the current bullish trend’s ongoing, mind-numbing, narrow channel. We issued a short term sell signal from our oscillator system. The market confirmed that “crack” to this “unstoppable” bullish rally on Friday and a m.t. sell signal. Please note crucially, this signal does not mean to “sell everything and go to cash.”
The S&P 500 came close to our 5280 targets in April, so the bullish phase seems to be complete. The current S&P500 chart shows that the momentum is changing. The point is that the index price is starting to confirm the loss of momentum and a possible trend change, which is consistent with the deteriorating fundamentals.
For more on our multi time frame oscillator methodology
And MACD and our TOOLBOX 1 and TOOLBOX 2.
The market did break below the previous low on Friday after failing to reclaim that previous support at the 20-DMA. The failure to reclaim that support turns the previous 20-DMA into resistance and makes the 50-DMA at 5’105 new critical support over the next few days. Technically, the key support will be the 100 dma at 4920.
Nasdaq
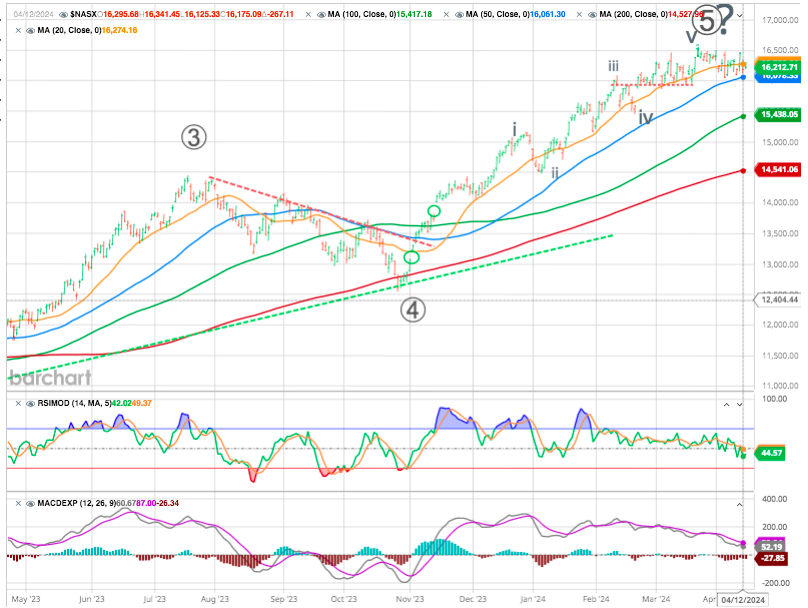
The uptrend is weakening, but the sentiment is still positive, and the uptrend could continue due to the sentiment alone, particularly in the mega-cap stocks, and especially if the earnings don’t disappoint.
IWM inflexion
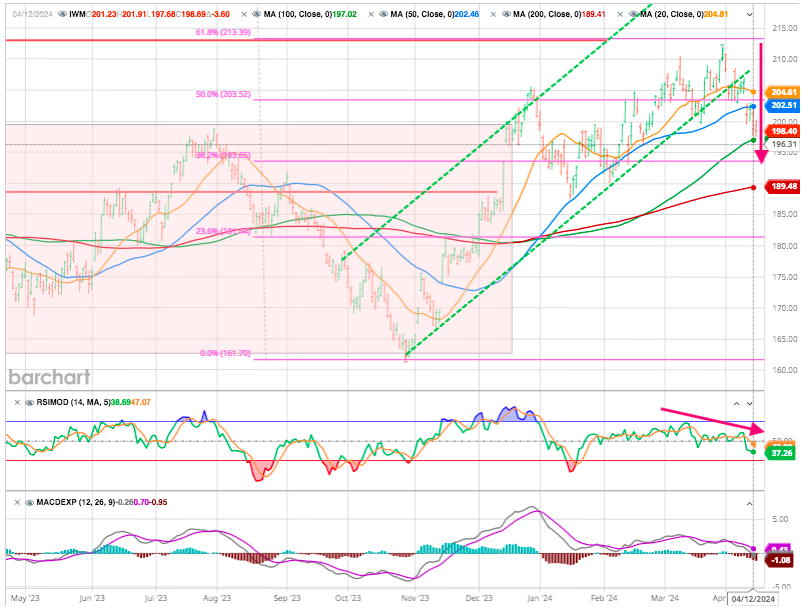
Using the Russell 2000 Ishares ETF (IWM) for technical analysis, to the first support at around 193. > close below 189 would clearly point to another leg down.
Where the Yen Goes So Goes The Japanese Market
Japanese stocks have long been thought to have a linear relationship with the yen. Treating Corporate Japan as though it’s effectively one giant exporter (it isn’t), the relationship between a weak yen and a strong Topix has been ironclad for the last two decades.
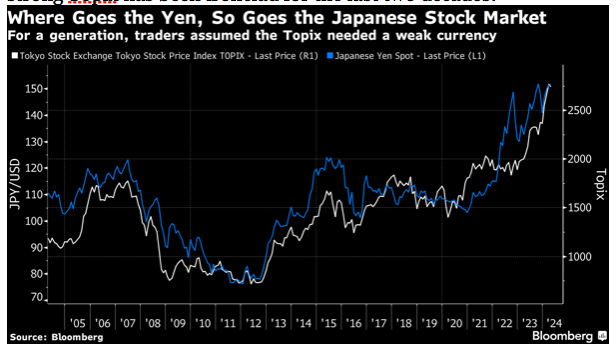
That relationship hasn’t gone away. Trading this month has already seen a big selloff for the Nikkei 225 on speculation that the government would intervene to strengthen the currency.
The risk of intervention is very real; but that’s another powerful reason for the Japanese authorities to avoid it if they possibly can.
Earnings Season
The broad stock market tried to sell off after each “hot” inflation reading in February and March, but the earnings results from companies such as Meta and Nvidia kept the uptrend momentum intact. Earnings season may play a big role in sustaining price trend.
The bullish phase was entirely based on the PE multiple expansion for S&P 500, which suggests that the market was building very high expectations about future growth. Thus, most of that growth is actually priced in.
The bubbles burst when the growth expectations disappoint. Thus, the Q1 2024 earnings season will be important. Given the expectations that tech companies front-loaded AI-based spending in 2023 due to the fears of being left behind, it is very likely that some of these mega-cap tech firms will disappoint with earnings or guidance, for example Nvidia.
But more importantly, on the macro level, the earnings expectations for 2024 and 2025 don’t consider the possibility of a recession.
Given our macro view (below) the recession is very likely, either towards the end of 2024 or beginning of 2025. Thus, the mega-cap tech earnings expectations will have to be significantly downgraded. Given the heavily concentrated market and the outsized influence of big tech, the broad market could fall sharply.
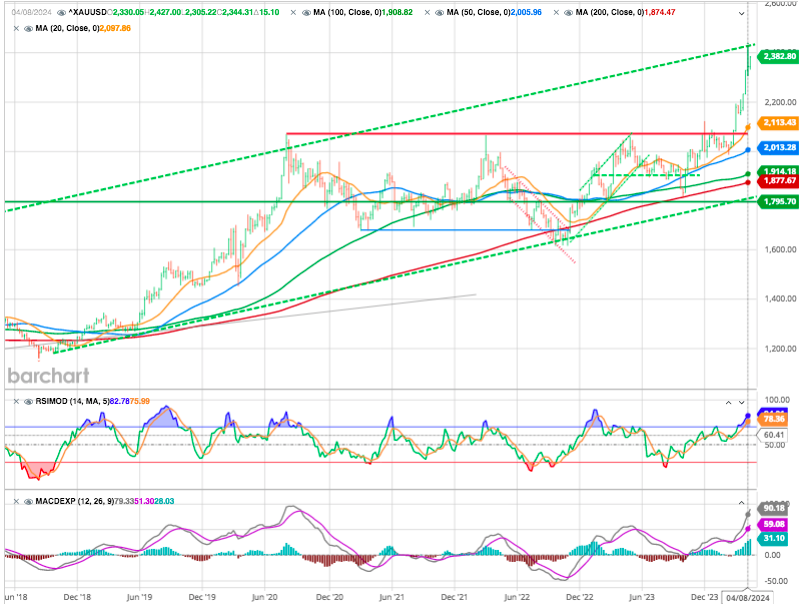
GOLD
Gold also set all-time record, as it broke the USD 2300 barrier for the first time.The metal reached its long term uptrend channel line and corrected lower.
The price of gold is extremely sensitive to the direction of the Fed’s monetary policy. In this respect, the slightest hint that a rate cut is on the horizon in June is a major boost for gold.
Gold’s role as a neutral asset with millennia of history as money is experiencing a resurgence relative to US Treasuries for global central bank reserve accumulations.
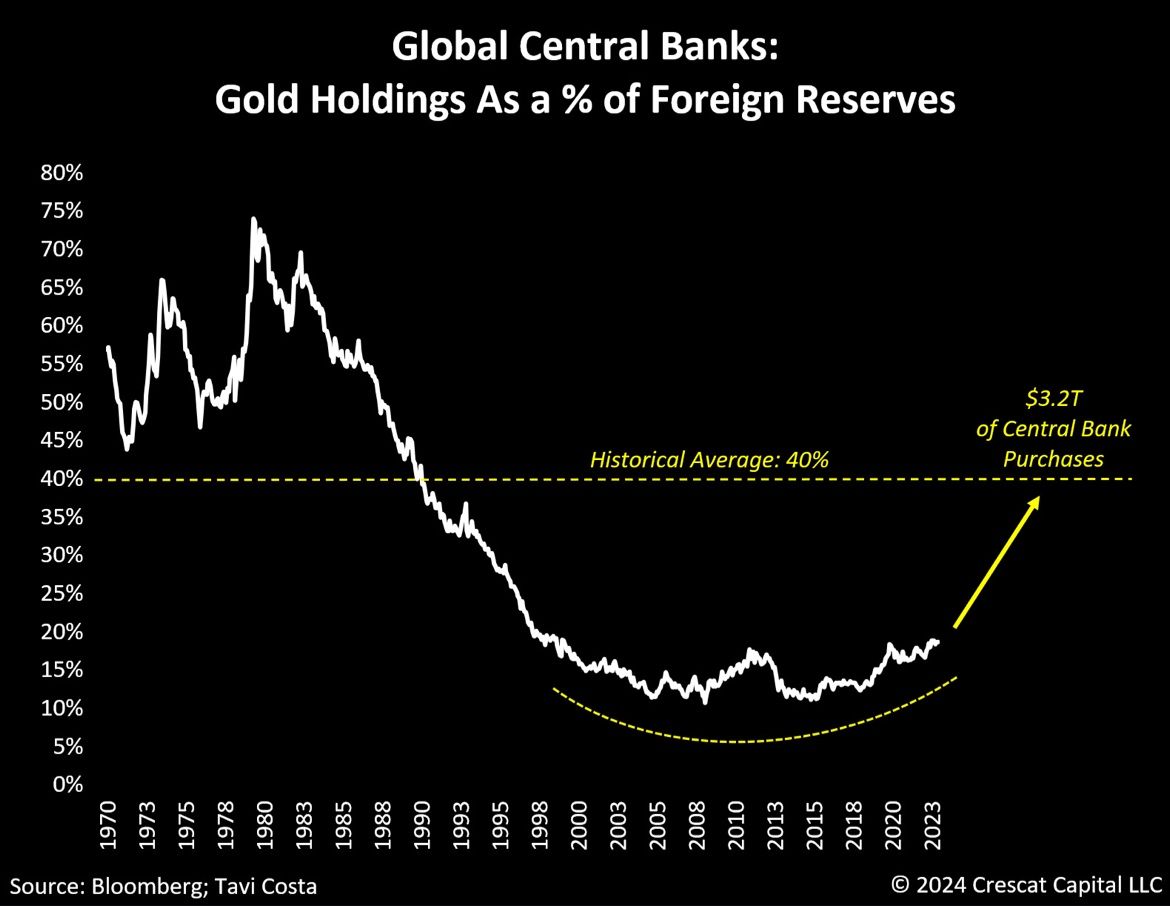
Source crestcat LCC
By the way, he performance of the gold miners is miserable compared to gold itself, so the position in some miners might be a good play . FreeportMcmoran (Copper Play) at a bit north of 45 USD and Newmont Mining at a bit north of 35 USD.
Commodities
The current scenario is setting the stage for what is likely to become one of the longest commodity bull markets in history. In other words US stocks seem to be too expensive compared to commodities.
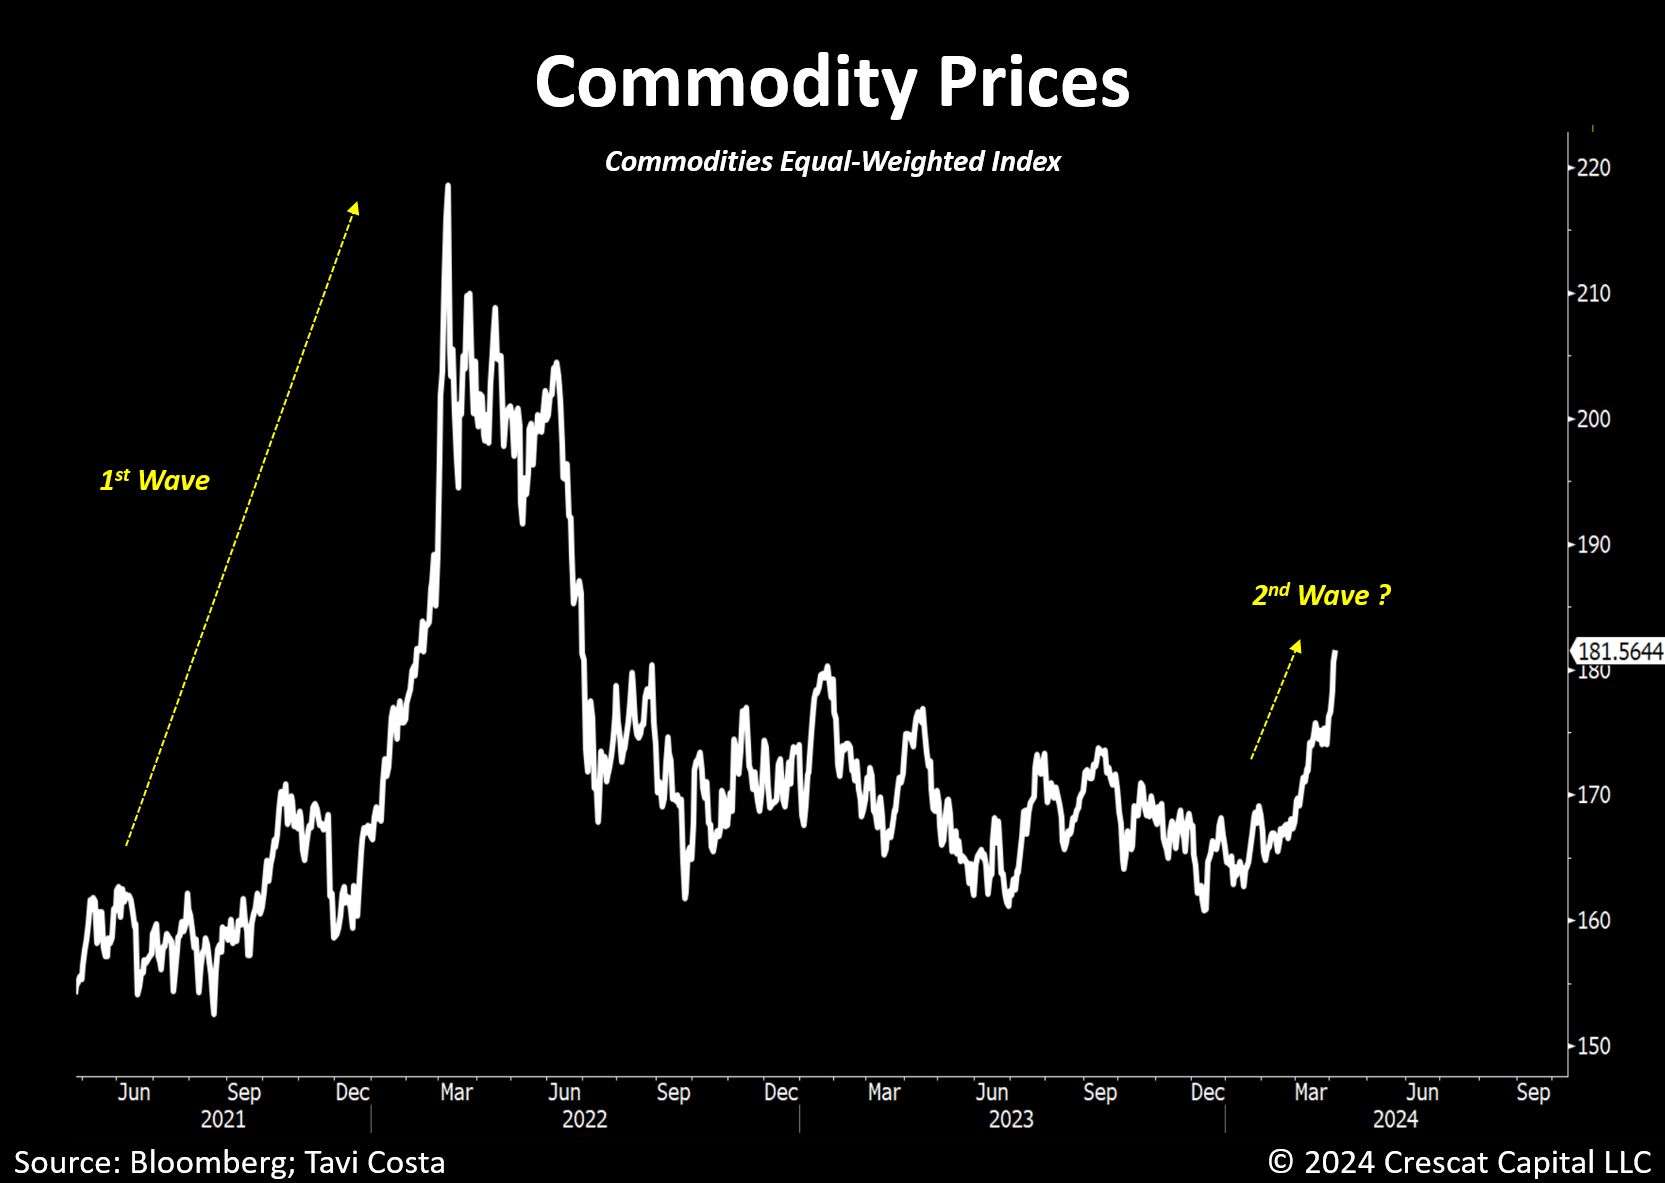
Source crestcat LCC
When weighted equally, commodity prices are currently experiencing another major wave of appreciation. While it is often underestimated, the structural issues driving resource prices upward are far from being resolved.
Cryptos
Bitcoin stabilizes below $70,000 this week, up 0.7% since Monday. Capital flows into Bitcoin Spot ETFs have fallen sharply since the beginning of April compared with the previous month.
From now on, investors will be looking ahead to Bitcoin’s Halving Day, scheduled to take place between April 18 and 19. This event halves the number of Bitcoins issued for each transaction block. After Halving Day, not 6.25 bitcoins will be redistributed to miners who validate blocks, but 3.125 bitcoins, suggesting difficulties for miners with shaky financial health.
As for the bitcoin price, Halving has always been historically favorable for its progression in the months following the event. Will we see the same surge this time? We’ll find out in the coming weeks.
The FED and Inflation :
Each successive number is adding to the picture being assessed by the data-dependent Federal Reserve. It’s now looking increasingly likely that the “last mile” of the inflation fight will be the most challenging, with a higher for longer theme coming into view due to “sticky” inflation.
Economic growth is also strong at the moment, so the central bank doesn’t feel intense pressure to cut rates. However, policymakers also don’t want to risk falling behind the curve again, like they did at the beginning of the latest cycle, and may have to act earlier than expected to pull off a so-called soft landing.
Some Fed officials even warned that recent increases in inflation “had been relatively broad-based and therefore should not be discounted as merely statistical aberrations,” according to the minutes of the last FOMC meeting on March 19-20.
With regards to quantitative tightening, officials also started discussing a process to slow the balance sheet runoff, which the Fed has indicated would be “fairly soon.”
The bearish thesis for second half of 2024
In our opinion, the Fed is not going to be able to prevent the forthcoming recession with the credit event (maturity wall) and the stock market is currently facing a correction as the Fed’s interest rate cut expectations get repriced.
The recent “hot” inflation data reinstated the “higher-for-longer” policy, meaning no cuts in 2024 (until a recession).
The economy accelerated in 2024, and ISM manufacturing is now over 50. That’s the problem. The Fed prematurely eased the financial conditions, and now inflation is accelerating as well. Thus, the Fed will be forced to delay the cuts – until the recession. That’s bearish.
The bearish thesis for the second half of the year is based on the prediction that inflation would start rising as the base effects expire in June, at which point the Fed would be forced to make a hawkish turn – this means the interest rates would start rising again.
Happy trades