

MARKETSCOPE : Don’t Be Fooled !
June, 07 2023

The Answer is Blowing in the Wind
Back from a few weeks of sailing under northern skies, sometimes threatening and other times clement under a brilliant light, typical of these regions, I was able to observe the direction of the waves, to listen to the winds identifying the mood of the ocean and to steer accordingly with the best sail adjustment. It’s a feeling of freedom and complete communion with the elements. -check BONUS at the bottom-
It was not without evoking my daily life as asset manager and the choices to be made in the calms and storms of the financial markets.
Attempting to determine the path of the global economy (with its implications for inflation and interest rates) is never easy but is made more challenging by the current plethora of conflicting signals. It is in circumstances such as this that we find the practice of thinking in terms of probabilities to be most valuable.
Once again, I realized that it’s important to hold on to the helm and the cap, as the answer is blowing in the wind.
As we are fond of saying, as investors we don’t have the luxury of dealing in certainties but in probabilities. Experience has taught me that “playing the odds” produces the best results. Of course, probabilities must be recalculated as new information becomes available, which means that, as investors, we must be prepared to change our opinions when warranted.
This new MARKETSCOPE will try to catch up with the markets as we review the past month and command our attention in the upcoming June.
The Market is Always right
“Markets can stay irrational longer than you can stay solvent.”
— John Maynard Keynes
As an article rightly put it a few weeks ago: the US recession has been two months away for a year. The market is finding it hard to believe, especially as employment and real estate continue to hold up, despite the perverse effects of higher key interest rates.
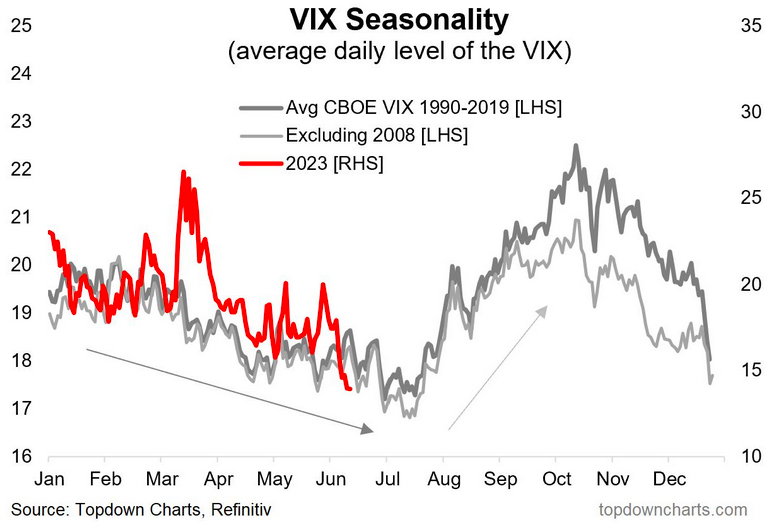
Volatility seems to be fading a little more every day. The VIX (SPX volatility) lost 6.7% on Friday, settling at 14.60 at the bell. This is the lowest closing level for the VIX since the beginning of the covid, so the market seems to have decided that Fed rate hikes are all but over, and that any future hikes will not be likely to create headwinds. The market also believes that inflation is under control.
But there’s another factor to be taken into account to explain the color of the indices. At the same time, the world of finance has developed a passion for artificial intelligence. It’s important to understand that this is helping to improve the overall mood. But why? Because the presumed beneficiaries of the presumed revolution are also the champions of the last decade. So they already carry a lot of weight. And they’re getting heavier. In short, it’s always the same people who win.

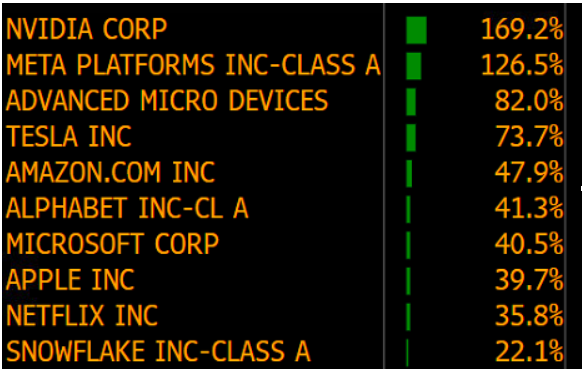
“Magnificent Seven”
The SPX is up 11.53% since the start of the year. 88% of this performance is attributable to 8.8% is attributable to the AI-related “Magnificent Seven” (the name is Bank of America) (Apple, Microsoft, Google, Amazon, Nvidia, Meta and Tesla). And consequently 1.1% is attributable to the average of the other 493 cases.
Even French luxury goods, the only ones to hold their own against the big American digital companies on the stock market, seem to be pales in comparison lately. At this stage, no one has yet found a way to fit AI into a Vuitton bag or a Hermès square. Technology bets are all the rage: last week, U.S. equities recorded $13.3 billion in inflows, according to BofA calculations, including $8.5 billion in technology.
The contrarians, called grumpy by those who haven’t missed the bandwagon, argue that AI is the tree that hides the forest. In the meantime, it works quite well. Admittedly, the second-largest flows of the previous week were channelled into value stocks, which are perceived as more traditional, less risky bets. This still represented $2.5 billion, a sign that not all equities are comfortable with the AI boom underway. But for now, the winners are positioned in technology, not elsewhere.
After a 50% drawdown, FANG+ is now just 7.8% from its all-time high.
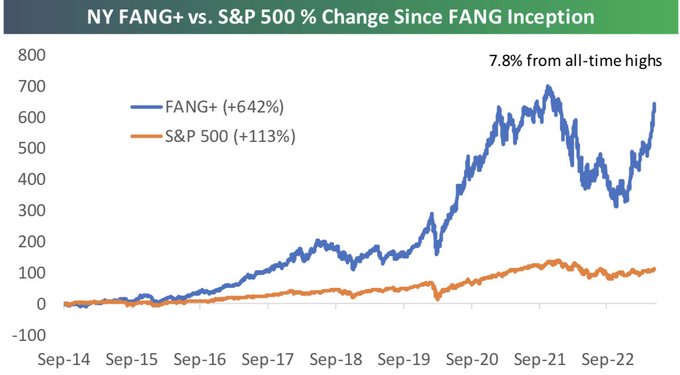
Source Bespoke
It is legitimate to think about positioning oneself for the long term in artificial intelligence. Nvidia broke through the tunnel, and many other firms are either about to enter it or have already done so.
Yes the innovations of the last three decades changed all our lives, and eventually created wealth for shareholders. But it took time for them to work out exactly who would win, and there were some mistakes along the way.
The AI boom has already taken some inveterate bulls by surprise; as Shuli Ren points out for Bloomberg Opinion, even Cathie Wood missed out on it. The potential is obvious, and doubtless much money will be made.
Even in Europe, there’s plenty to do: in a note, Bank of America sketches out a few names, mentioning in particular a Geneva-based firm…
See bonus
But May’s tech blowout suggests that there will be plenty of opportunities to lose money. Invest with optimism, but keep your eyes open.
What goes up must come down… unless you have diamond hands. Some cracks are beginning to appear in the recent AI stock rally, with C3.ai (AI) plunging 22% AH last Wednesday after giving a disappointing outlook during its FQ4 results.
We are starting to let our guard down in the trading rooms, so be careful not to become complacent.
MARKETS : Unsinkable.
 Last week was rich in macroeconomic indicators. Investors learned in no particular order that the Chinese recovery still has the vigor of an anorexic chick, that European inflation is a little less dramatic than expected and that the US labor market is still solid, even if the unemployment rate has tended to rise over the past month. The markets continue to pick and choose what interests them in order to convince themselves that the Fed is done with rate hikes. And it’s working quite well.
The US equity rally had picked up steam. This has been accompanied by a surge in yields as #markets position for a #Fed that (i) will now be pressed harder by data to hike in June and/or July and (ii) will be less hesitant to do so because of the resilient labor market.
There is unlikely to be any monetary tightening in the US on June 14. Some central bankers continue to claim that there will probably still be some afterwards, but investors only listen to stories of artificial intelligence and the return of technology. The Nasdaq 100 gained 32% in 2023. The Dow Jones, zero.
Let’s come back to what happened in the last weeks. Starting our usual tour with the performance of popular equity benchmarks around the word, we observe that it was a good month … if you concentrated your equity risk in the Nasdaq that is ! Unless you are concentrated in (a few) long-duration Nasdaq stocks, the Wall Street adage “Sell in May and go Away” may actually resonate with your equity performance.
For everybody else, the week was, well… uh … a bit more challenging. Even if you were investing in the S&P 500, you had to be picking the right (highest market cap) stocks, otherwise, you probably had to write a red number by last Friday’s close.
We think the monthly heat map of the index says it all:
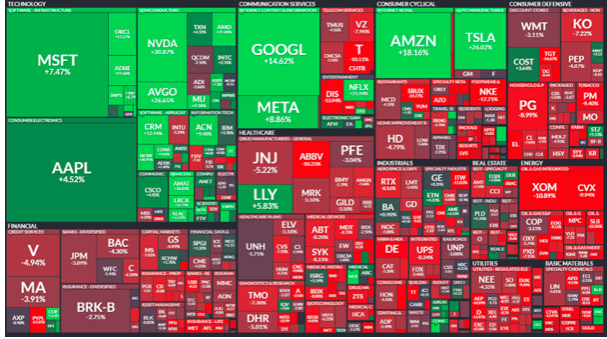
So, we already established that the market is pulled higher by a few, select heavy-weight lifters:
Those can largely be defined as the 10 members of the NYSE FANG+ index (right column are YTD returns):
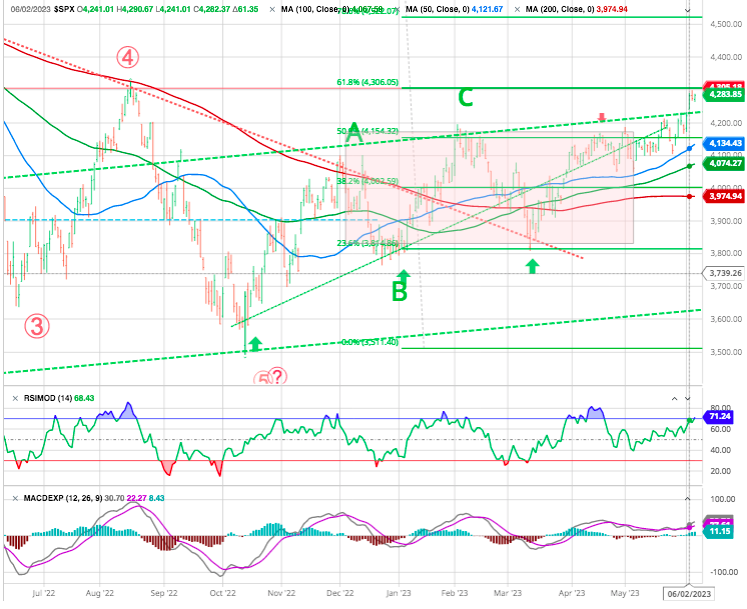
Of course one could argue that S&P 500 index has now broken above key resistance levels (4200), but given the lack of breadth, i.e. narrowness of participating companies to the upside, the next resisitance at 4300 (previous August high) and 61.8 % fibo retracement will be strong.
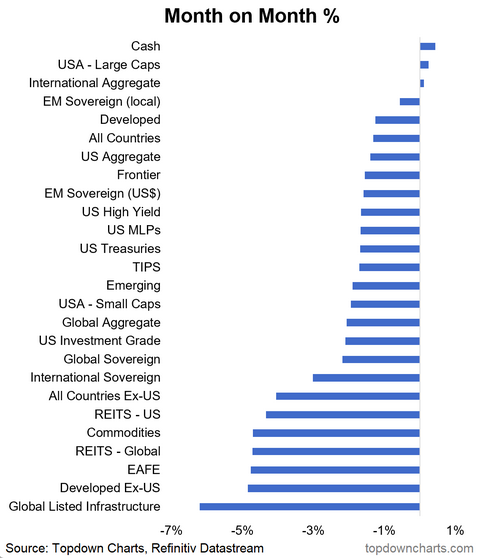
If each stock in the US flagship index, the S&P 500, had the same weighting in the index, the index would have fallen by 0.35% since the start of the year, whereas it is largely up.
The explanation? The rise is concentrated in an extremely small number of stocks.
- In the US, it’s Big Tech.
- In France, it’s luxury goods and energy.
- Other stocks are lagging behind.
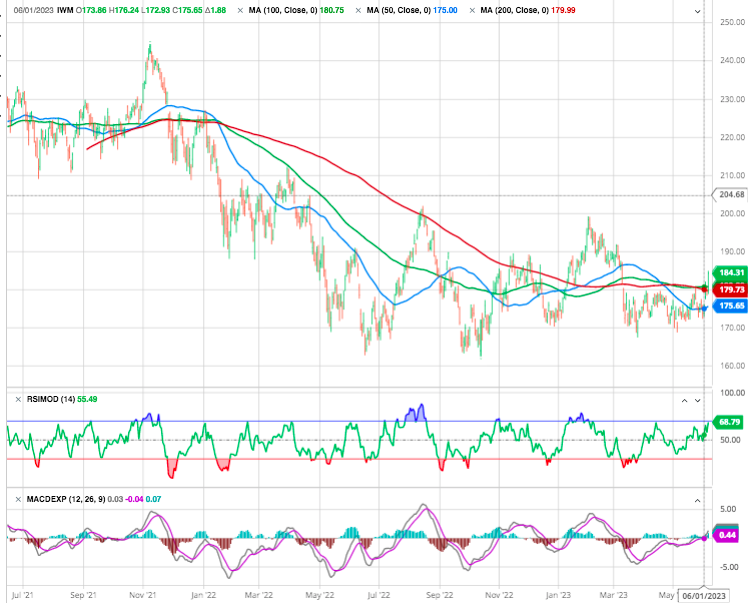
- And this is even truer for small and mid-caps. -see Russel 2000 index-
NDX is entering clearly overbought territory, and this is something to watch closely, especially as positioning in the NDX futures market is at its most bullish since the end of last year, while on the SPX side, this same positioning is at its lowest (bearish) since 2007.
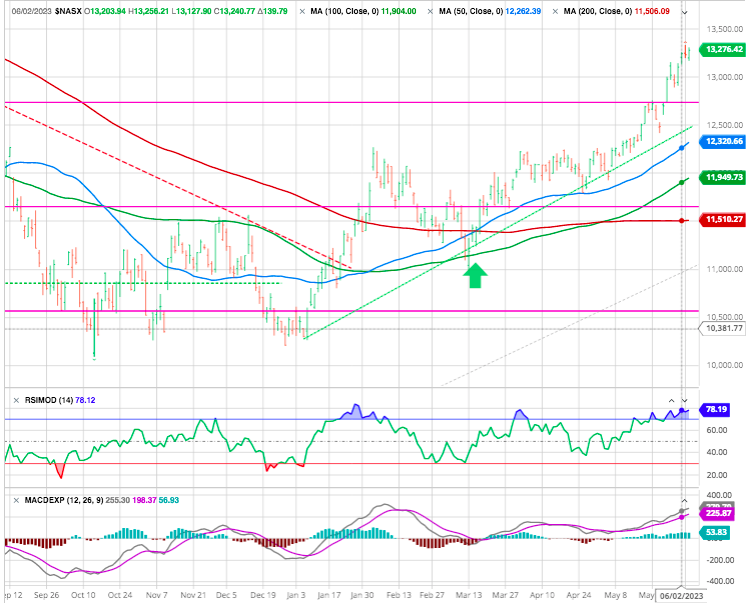
The uptrend is clear (green dotted line). But we do not like to chase stocks so but better they come to us. Here a set back to 12500 level.
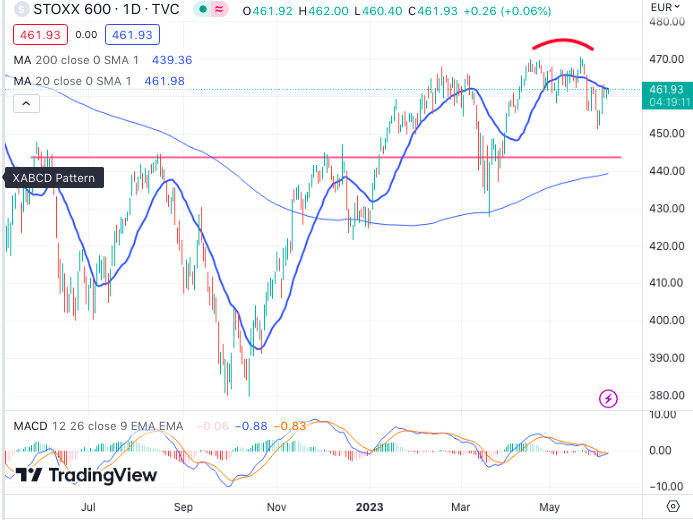
Let’s turn our attention to Europe then now. Here’s the broad STOXX Europe 600 index (including such secessionist countries as Switzerland or the UK). It was not such a good month for European stocks, which actually registered a key reversal downtrend pattern.
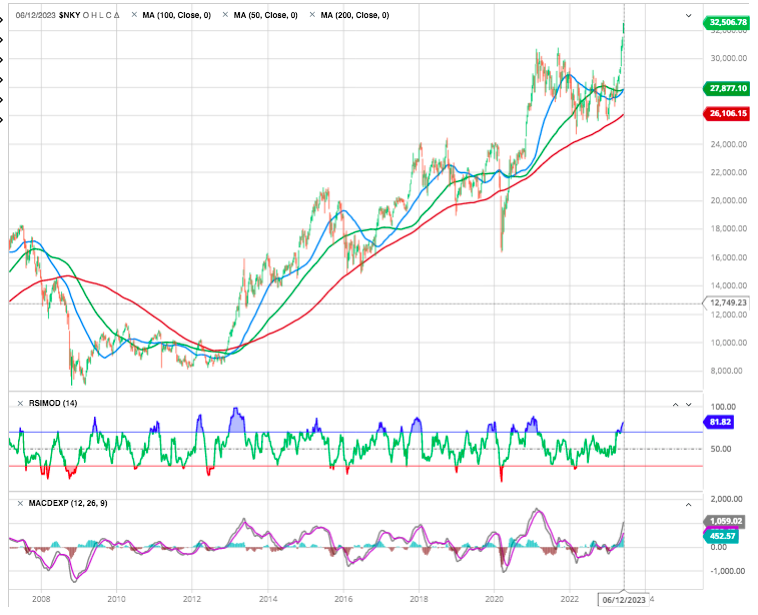
And then there is the newly found Asian champion: Japan! The Nikkei is at levels not seen since 1990: check our stragtegy
Time to have a look at equity sector performance,
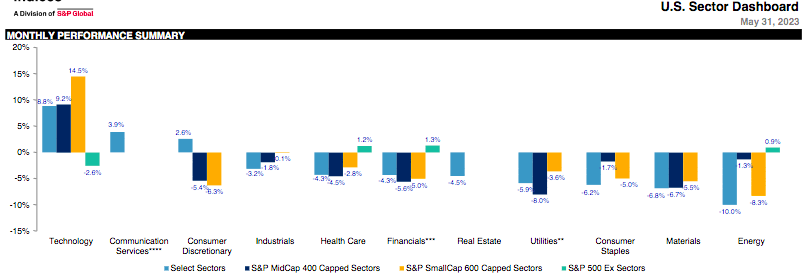
Technology-heavy Select Industries led in May, with Semiconductors and Technology Hardware up 14% and 13%, respectively.
Oil & Gas Equipment and Metals & Mining posted the largest declines for the month, falling 9.0% and 9.9%, respectively.
Indeed! Except for technology and closely related communications stocks, all other sectors were down at a global level in May.
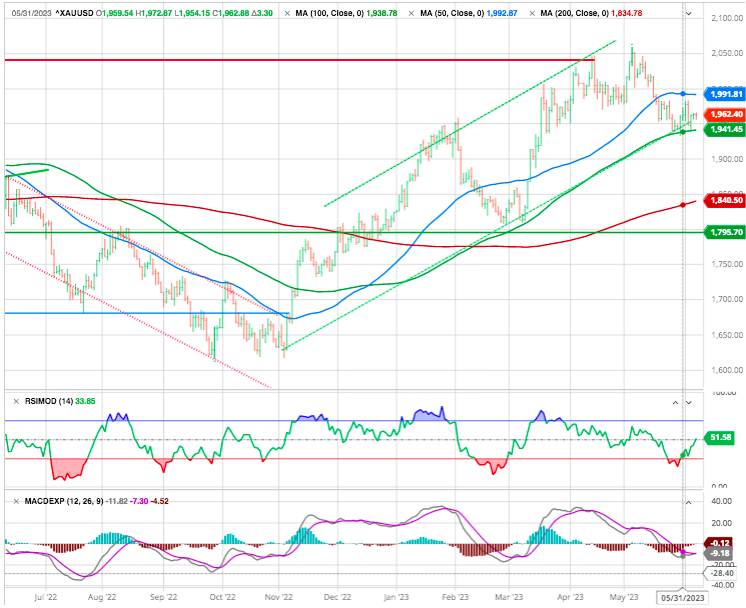
GOLD
Gold reached briefly an all-time high just above $2,080 the ounce during the month, but eventually got rejected again at this resistance area above $2,000.
Now Gold is holding from an important support zone (1940), a break of this level would put the next buying opportunity to $1,800. We continue to be bullish, on the long term, knowing it is an hedge against USD fiat money.
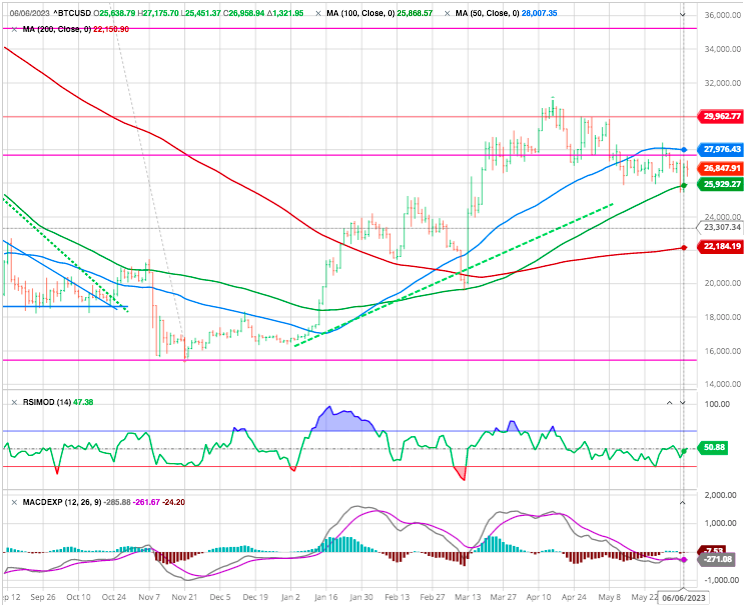
CRYPTOS
Bitcoin closed its first month in the red in May, after four months of consecutive gains since the start of the year. This week follows the same trend as the previous month, with bitcoin down almost 4% and hovering around $27,000 at the time of writing. After a strong start to the year, the leader in digital currencies is slipping back, and has not benefited from investors’ enthusiasm for technology stocks in recent weeks.
Here’s a history lesson brought by Hedgeye for those of you who didn’t trade the Dot Com blow up. The Nasdaq had 11 rallies of more than 10%. Meanwhile, 4 of those rallies were between 28% and 49%.
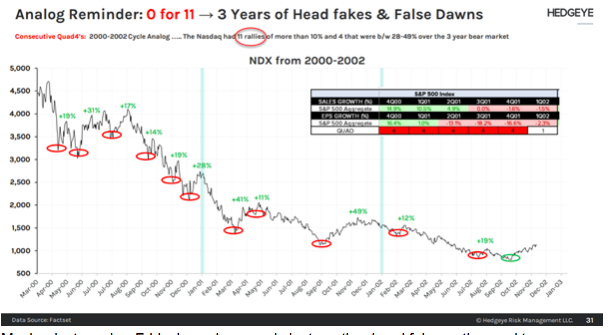
Also see our “Anatomy of a Bear Market” – see at the bottom of it-
Maybe, just maybe, Friday’s exuberance is just another head fake on the road to perdition? Maybe there’s a boogeyman lurking behind the corner post-Debt Ceiling deal? Outside of the 7 stocks driving the S&P 500 and Nasdaq higher, maybe there’s actually good reason for pause percolating beneath the surface of Macro markets?
Let us explain.
Outside of the lagging economic indicator that is the Labor Market, here’s a quick review of recently reported economic reality.
- The ISM Manufacturing report has remained in contraction for 7 months straight now.
- Durable Goods Ex-Defense has fallen from 11% a year ago to 1.6% YoY most recently.
- Retail Sales has fallen from 8.8% a year ago to 1.6% YoY most recently.
Despite the bullish, “All-Is-Well!” orgy, all is not well inside the U.S. economy.
Leading indicators worsen
Yet investments have not yet fully reflected the concerns this signal appears to be giving.
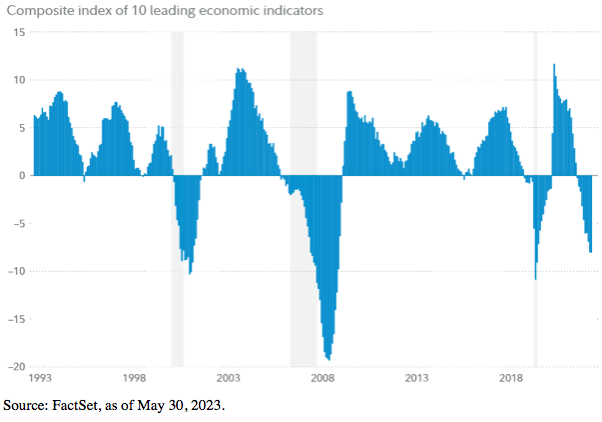
The US Index of Leading Indicators, a composite of 10 economic data points that includes things like the jobs market, consumer sentiment, manufacturing activity, and more, has continued to slide further into negative territory. Typically, this would be a worrying signal: Deep, negative readings for this indicator are perceived to potentially forecast changes in the overall economy and turning points in markets. This index is approaching the previous low set during the COVID pandemic, yet investor and business sentiment, broadly speaking, is not nearly as dour as it was then.
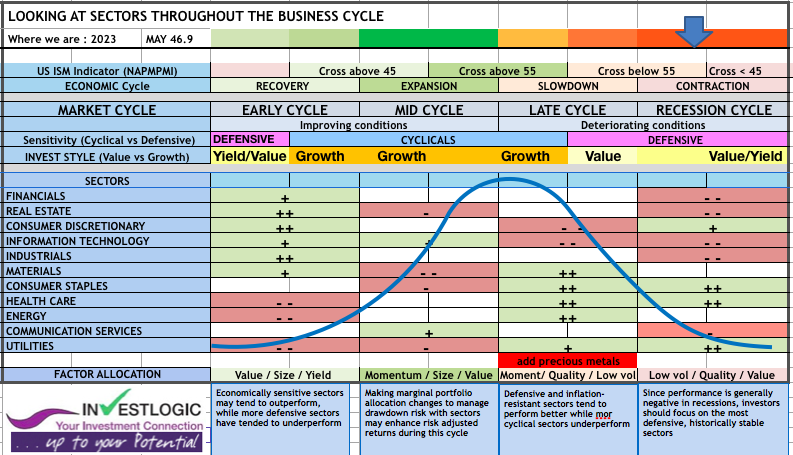
Manufacturing PMI fell to 46.9 last month from 47.1 in April. It was the seventh straight month that the PMI stayed below the 50 threshold, which indicates contraction in manufacturing, the longest such stretch since the Great Recession. The persistent weak readings in the PMI support analysts’ expectations that the economy will slip into recession this year. But there have been several periods, including the mid-1990s as well as mid- and late-1980s when prolonged readings of the PMI below 50 were not accompanied by a recession.
Our proprietary ABS matrix
With none of the scariest narratives being as yet verified, and earnings forecasts steadily rising after a very minor dip in the greater scheme of things, stocks can rise. As previous stories had prompted many investors to take evasive action, markets were positioned to allow a big rise on not too much good news. That’s what’s happening.
For now, the economy isn’t so cold as to tank earnings, or so hot as to force the Fed and other central banks into further aggressive hikes. One recent phrase for this narrative, rapidly gaining currency, is “Immaculate Disinflation.” Somehow, inflation could come down without inflicting pain.
In practical terms, the laundry list of potential geopolitical horrors is unchanged. Absent one of those coming to pass, the greatest danger confronting us at present would be a resumed downturn in earnings forecasts.
Happy trades
Until next time
BONUS _
Here are 15 stocks that are expected to benefit from the ChatGPT hype, as well as a brief explanation from BofA experts on why these companies are on this list in the first place.
- Microsoft (NASDAQ:MSFT) – OpenAI ChatGPT integration into Bing search engine;
- Alphabet (NASDAQ:GOOGL) – Google search ecosystem, DeepMind Sparrow LLM, Bard AI chatbot;
- Meta Platforms Inc (NASDAQ:META) – LLaMA large language model, GPU-enabled AI research supercluster;
- Apple (NASDAQ:AAPL) – iOS licensing for default search engine (Google vs Microsoft);
- Baidu (NASDAQ:BIDU) – Google of China, Ernie chatbot;
- Nvidia (NASDAQ:NVDA) – a leader in AI arms race with GPU accelerated computing;
- ASML Holding NV (OTC:ASMLF) – a leader in EUV lithography tools enabling Moore’s Law;
- Taiwan Semiconductor Manufacturing (NYSE:TSM) – a leader in foundry chip making for high-performance computing;
- Arista Networks (NYSE:ANET) – Rechenzentrums-Switches mit hohem Durchsatz für intensive KI-Workloads;
- Adobe (NASDAQ:ADBE) – Sensei KI-Plattform;
- Shutterstock (NYSE:SSTK) – generative KI-Bildpartnerschaft mit OpenAI;
- Nice Ltd ADR (NASDAQ:NICE) – KI-Datenüberwachungssysteme;
- SAP SE (NYSE:SAP) (ETR:SAPG) – Enterprise- und Business-Software KI;
- Relx PLC (NYSE:RELX) – KI-gestützte informationsorientierte Analyse- und Entscheidungstools;