

MARKETSCOPE : FOMO : Chill Out Bozos
February, 05 2024

Market Magnificence: Buy the Rumors, Sell the News
US equity markets remained stoic despite Fed Chairman Powell almost explicitly ruled out a rate cut in March as if investors believed that the US economy was in no danger, even if the start of the rate-cutting cycle was delayed. The impressive US employment figures for January, published on Friday, as well as ISM-PMI came in higher than expected to 49.1, only reinforced this sentiment.
The US economy is so strong that the Federal Reserve has little interest in cutting rates, at the risk of seeing activity surge again, which would probably lead to a resurgence in inflation.
Janet Yellen may have already hinted that changes in productivity and GDP growth could be stronger than pre-pandemic levels, and that may mean higher rates for longer, a big departure from just a year ago when she thought that persistently low inflation would return.
The benchmark 10-year Treasury yield up by a whopping 17 basis points to 4.02% and put an abrupt end to the bond rally, driving yields on two-year, five-year and ten-year debt up by 10 to 20 basis points.
The Dow Jones and the S&P 500 Index reached ATH, new all-time highs, and marking the 12th weekly advance out of the last 13 for the latter. The gains were relatively broad, although the small-cap Russell 2000 Index remained nearly 20% below its all-time intraday high.
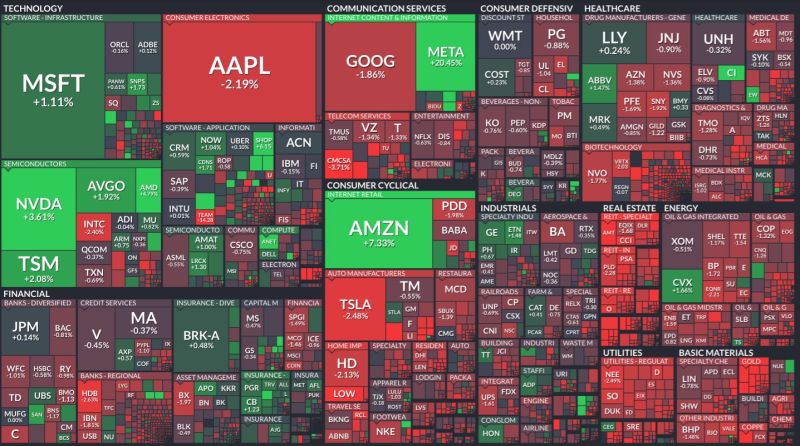
Friday’s market action tells a lot about what’s currently going on: 1) US large-caps, thanks to huge advance by META (+20%) and AMZN (+8%); 2) Underneath the surface, there is some selling taking place – the S&P 500 equally weight is down -0.08% on the day.
For us, the prospect that interest rates may not decline as soon as, or as much as, is currently expected by consensus opinion could shake the current extreme of investor optimism. The jarring of investor sentiment is the greatest potential catalyst for volatility in global markets. The addition of potential volatility produced by the fraught geopolitical scene raises the probability that global markets will be far more volatile than most expect.
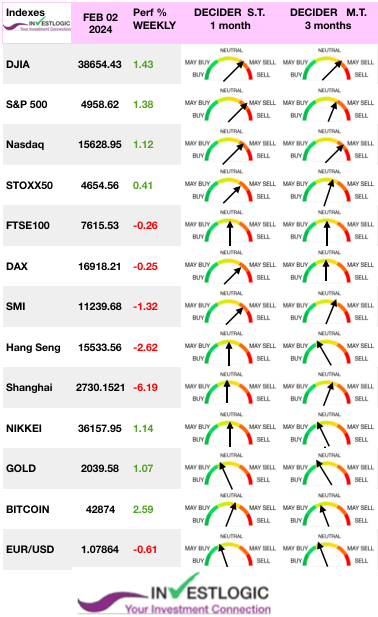 In Europe, inflation moderated in France, but rose slightly more than expected in Germany and Spain, which did little to alter expectations regarding the ECB, the Central Bank kept its key interest rates unchanged at record highs and reiterated that monetary policy would stay at “sufficiently restrictive levels for as long as necessary” to bring inflation down to the 2% target, even though growth figures for the main European economies came out rather weak. STOXX 600 Index (which include UK and Switzerland) ended 3.1% higher on encouraging corporate results and is less than two percent away from a new ATH set in 2022.
In China, -Check our article : The Wooden Dragon Year : Predictions– the second reading of China’s January manufacturing PMI came out slightly below market expectations, at 49.20 points, thus still in contraction territory. Chinese equities advanced after Beijing stepped in with forceful measures to support the economy. The blue-chip CSI 300 gained 1.96 while the Hang Seng Index advanced 4.2%. Beijing’s initiatives to revive the financial machine were not crowned with success, owing to the ongoing real estate debacle. Bank of Japan (BoJ) retained its ultra-accommodative stance, the Nikkei 225 Index fell 0.6% over the week.
The week will see earnings reports continue from more traditional companies. The list of heavyweights due to report includes McDonald’s, Caterpillar, Eli Lilly, Linde, Costco, Walt Disney, Philip Morris or ConocoPhillips for example in the USA. In Europe, BP Plc, UBS, TotalEnergies, Vinci, L’Oréal, Adyen, Kering and Hermès are on the horizon.
Federal Reserve members will also be back out on the speaking circuit following last week’s FOMC meeting.
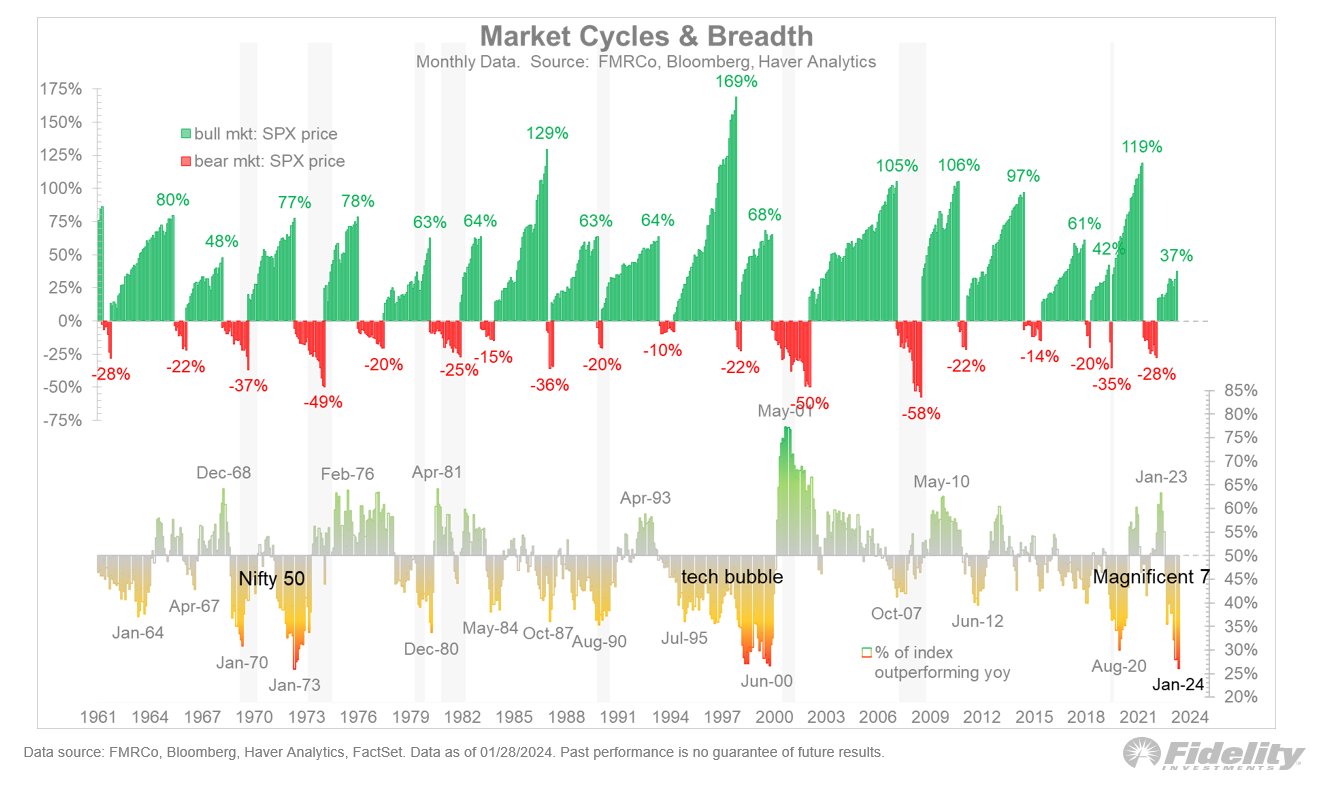
Heading To A Market Top in 2024
Technically we are bullish and fundamentally we are bearish !
While stock prices can deviate from immediate activity, reversions to actual economic growth eventually occur. Such is because corporate earnings are a function of consumptive spending, corporate investments, imports, and exports. The market disconnect from underlying economic activity is due to psychology. Such is particularly the case over the last decade, as successive rounds of monetary interventions led investors to believe ‘this time is different.
Highly speculative periods are characterized by investors trying to find novel reasons to explain the uniqueness of the current situation, frequently attributing the existing bubble to emerging technological advancements as a justification for frothy valuations.
A Bullish Stampede
Last wave up (Mar-Jul), it was the chase for “A.I.” that was driving the market while the majority of stocks dragged. The market remained overbought, trading in a defined trend channel as prices advanced. Then, the markets corrected by 10% into October, which is typical for any given year.
Today, we again see that same “unstoppable advance” with the same bifurcation in the market. The breakout to new ATHs is clear, short-term support is clear (4780) and the secular trend is clear. While the “Magnificent 7” stocks again drive the markets, another 5-10% correction over the next several months should be no surprise.
For a moment let’s not look at daily charts as day-trades, but rather take the long-term view through the longer term weekly chart lenses. As shown below, the current bullish stampede is very similar to what we saw from March to July last year.
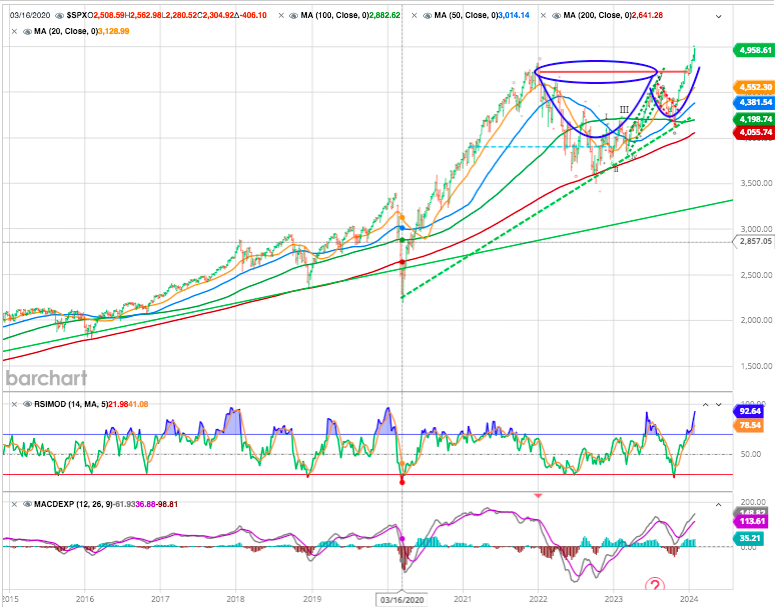
As you can see, a breakout has taken flight at 4780. The breakout looks pretty bullish, after 2-years of forming the top of the cup with handle bullish pattern -counts at a minimum to 5,600. However, a break of support at any point in time now will open the door for the larger pullback pointing down towards the 4350-4500 area.
There are only small windows of opportunity to increase equity exposure during substantial, bullish advances.
Nasdaq
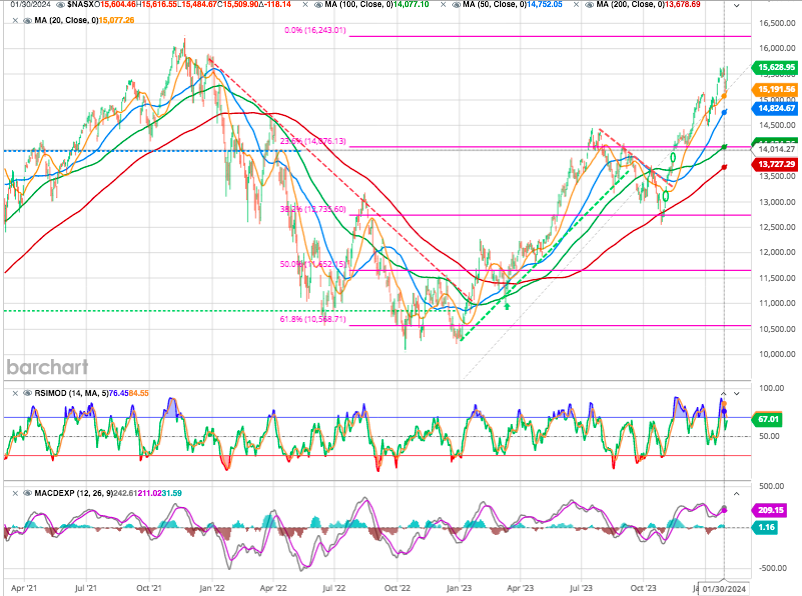
It is clear we are heading to the previous high (and next resistance at 16200 with the major support around 14’000.
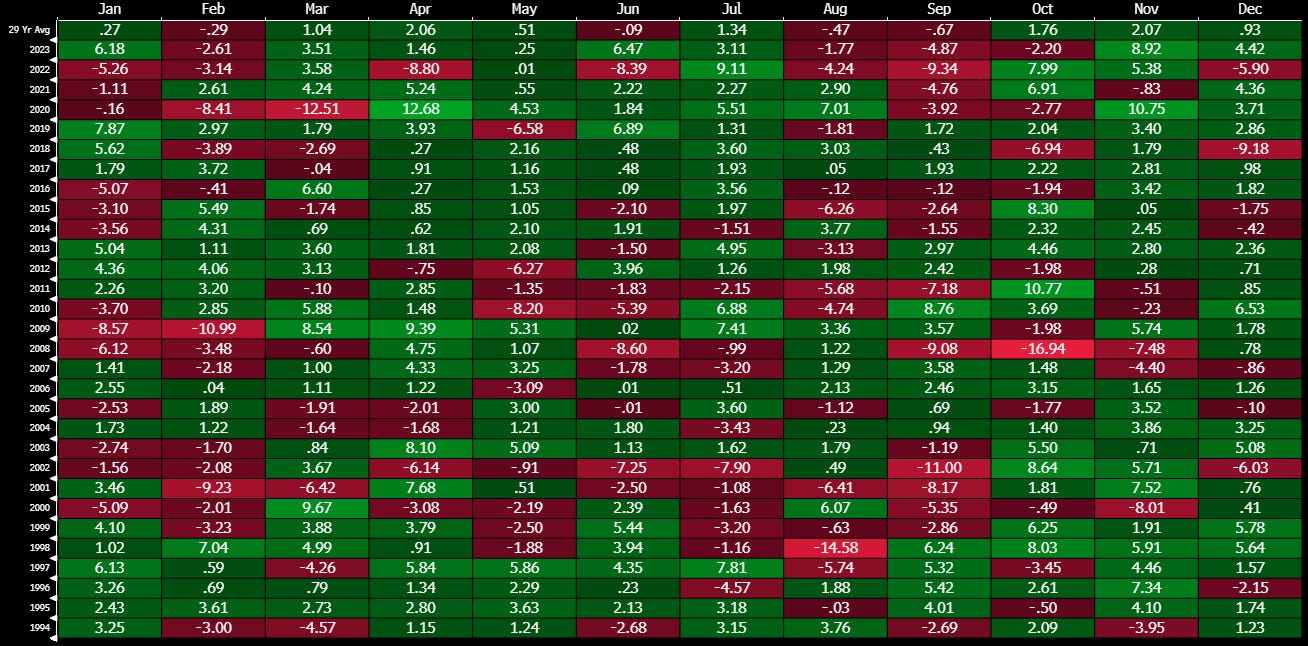
However, as is always the case, the current “bullish stampede” will end, and a reversal will occur. Having said that note that February has been over the past 30 years the third worst month for stocks (S&P 500), down 0.29% on average and down 15 out of 30 times. Only September was done more months (16).
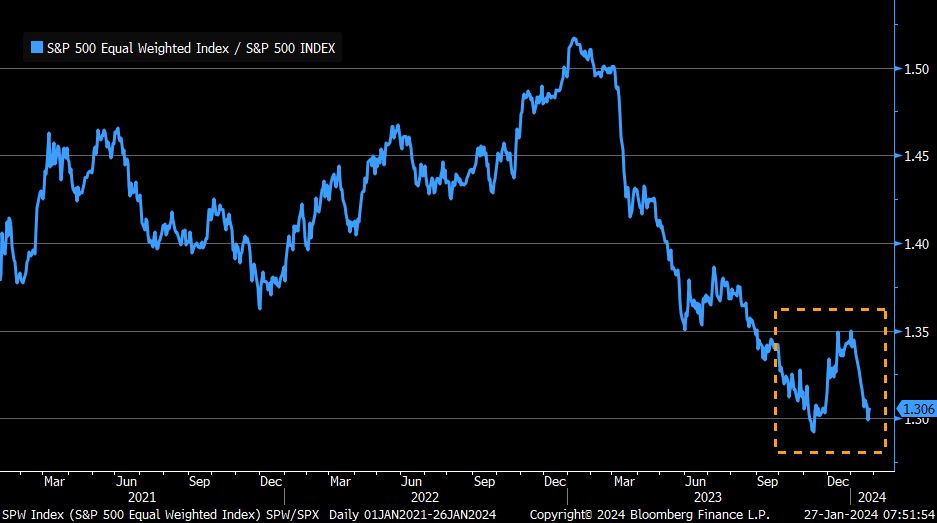
Equal-weighted S&P 500 has given back nearly all of its relative gain vs. cap-weighted S&P 500 since mid-November.
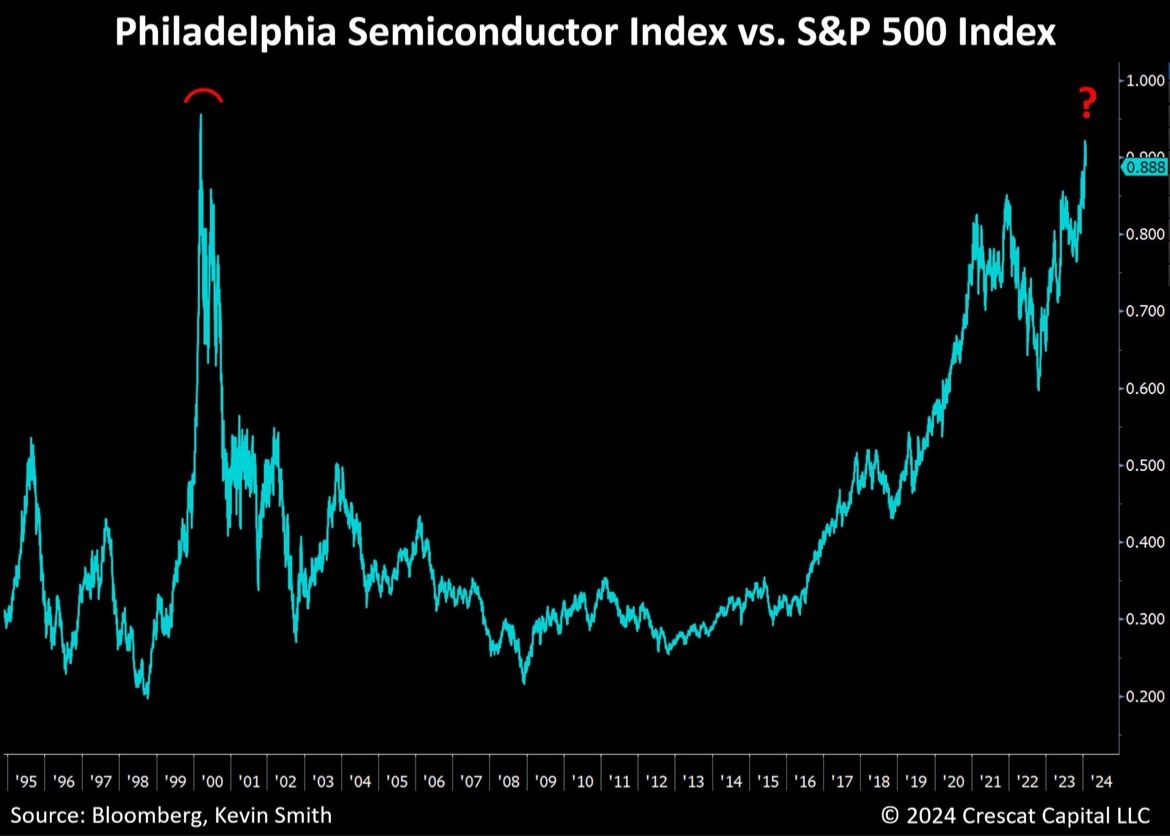
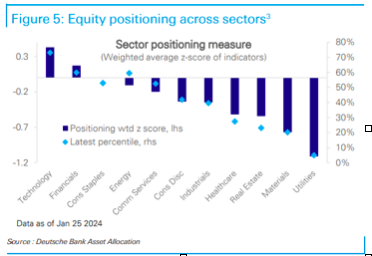
Megacap tech shares have driven most of the gains of the market. Data from Deutsche Bank Research show that positioning in tech is the only one notably above historical average, at the 73rd percentile.
Closer to a dotcom bubble than people think
Current S&P 500 rally is ‘far more similar’ to dotcom bubble than people think, according to JPMorgan quant strategists.
They have identified “a plethora of similarities” between the current rally in US stocks and the dot-com bubble, despite common dismissals of such parallels due to the distinct “irrational exuberance” of the latter period.
For the team, a key investor concern in 2024 should be the heightened and persistent concentration in the US equity markets.
This concentration echoes the dot-com era, particularly in the overrepresentation of technology stocks. Currently, only four sectors are represented in the top ten stocks of the MSCI USA, against a historical median of six sectors.
Globally very rarely have we seen the stock market leadership narrow to such a degree as it has recently. We are living in one of the narrowest markets in history, with only 26% of stocks outperforming the index. The last time this happened (1998-2000) it all ended in tears (down 53%).
This nifty chart is from Michael Hartnett of BofA Securities is instructive
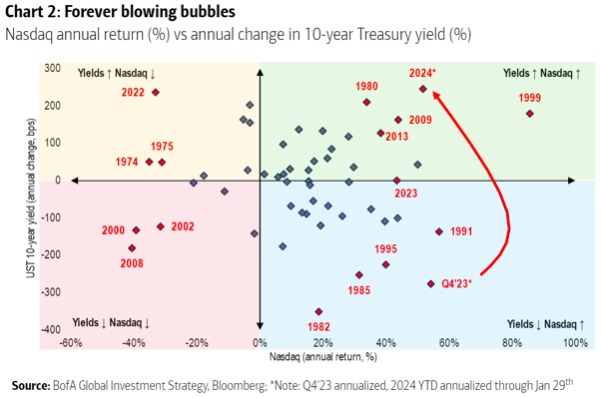
As reported by John Authers from Bloomberg : it’s important to point out that there is not a particularly strong relationship between changes in 10-year yields and the Nasdaq over history. But 2024’s combination of a bounce in yields and a great time for the Nasdaq is very unusual. The only more extreme instance came in 1999, when markets partied ahead of a burst bubble the next year. In general, this combination either happens after a bad recession (as in 2009) as yields rise and people also buy stocks, or in a bubble when people just don’t care.
The likelihood of the broader index outperforming the top ten stocks is increasing, and given the recent significant market moves and extreme equity positioning, the strategists anticipate potential market pullbacks, likely triggered by weaknesses in the top 10 stocks.
Historically, it has not been unprecedented for stock markets to overshoot fundamental macro indicators when a “bullish stampede” is afoot. However, the deviation from the historical fundamental underpinnings has previously served as a cautionary tale to investors.
We recommend to stay prudent and to be aware of the risk that historical deviations have led to stock markets correcting down to the fundamental underpinnings and not vice-versa. Investors must continue to hold some excess cash and wait for a better opportunity to deploy that capital.
EARNINGS
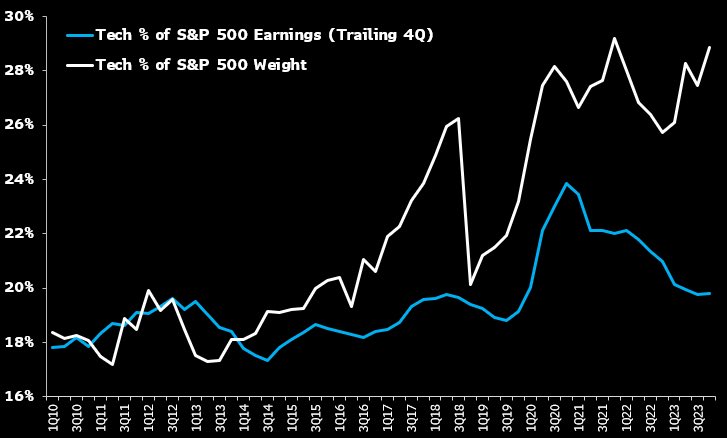
The pressure on tech companies to satisfy high expectations this earnings season is pretty intense. The spread between tech sector earnings share of the S&P 500 and sector weight share is even higher than it was in 2021.
@Gina Martin Adams
One by one, the stock prices of Amazon, Apple and Google veered up and down as the companies reported earnings this week.
Not all “Magnificent 7” stocks are created equal.
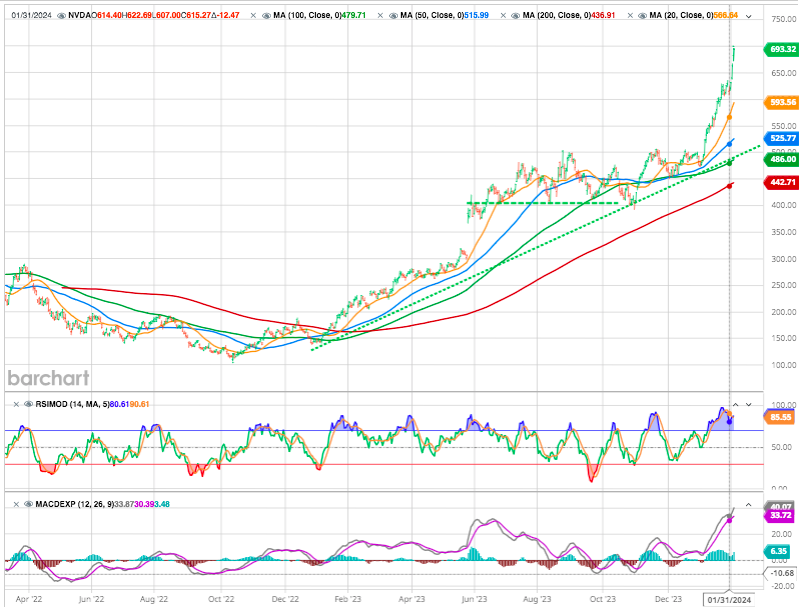
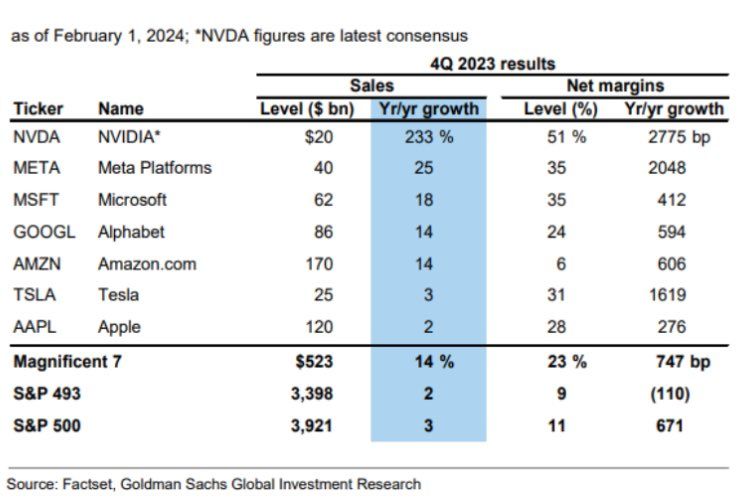
Nvidia is the only Magnificent 7 stock seeing an increase in earnings revisions. The company is almost the sole beneficiary of the recent AI advancements, contrasting sharply with others that have only experienced hype without any fundamental improvement.
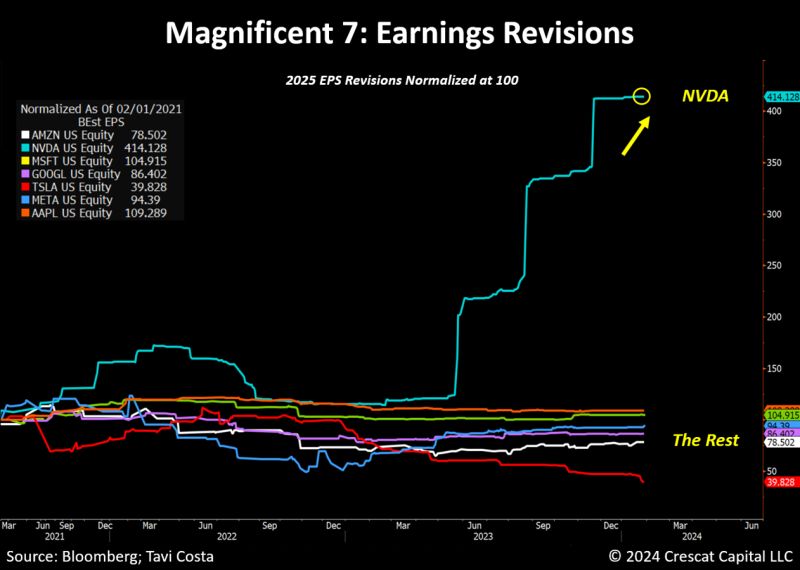
To put things into perspective: the Mag 7 generated $523bn in sales during 4Q, +14%YoY. Revenue growth for remaining 493 S&P 500 stocks was a comparatively paltry 2%. Margins for the mag 7 expanded by ~750 bp YoY to 23% vs. a 110 bp contraction to 9% for remaining 493 stocks in the S&P 500, Goldman has calculated.
@ HolgerZ, Goldman Sachs
The question of whether the “frenzy for AI has given birth to a new bubble” has become an unavoidable topic in the US stock market. Former hedge fund manager Leon Cooperman said, it is hard not to think of the fervent atmosphere of the market during the Internet bubble era when looking at NVIDIA.
In the year 2000, everyone on the Internet was shouting enthusiastically about Cisco. Cisco was priced at $80 at that time. When tech stocks declined, the market crashed, and its stock price fell by 90% to $6. Today, 23 years later, Cisco’s stock price still hasn’t reached the level of 2000.
Will NVIDIA become the next Cisco?
Investors blindly buying shares of Tech Giants based on narratives and name recognition will get mixed results at best.
Meta’s gain in market cap last week after its results was only just short of $200 billion (about the current market cap of the whole of Cisco Systems Inc.). That’s the largest one-day gain in value for any company ever.
But it’s true that the Mag7 are growing more differentiated as they compete against each other. Investors are beginning to assess exactly which ones will reap benefits from artificial intelligence.
Few analysts are bearish on Apple. See our As Apple Goes So Goes the Market
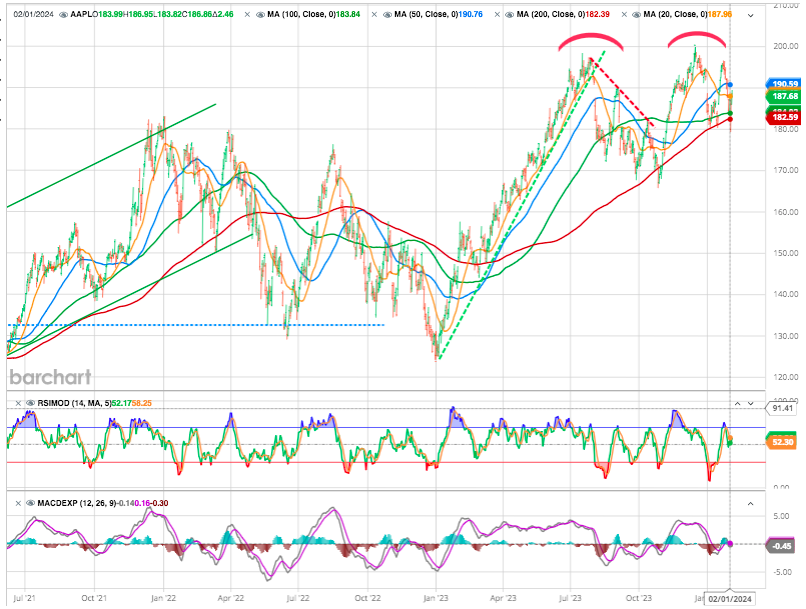
China gets all the blame from analysts when you talk to them about Apple, but it’s not just a China problem. If you really dig into their earnings statements, there were multiple red flags. Only one segment showed growth in the December quarter, and that was the iPhone, but that was because they were comping a 9% decline from a year ago.
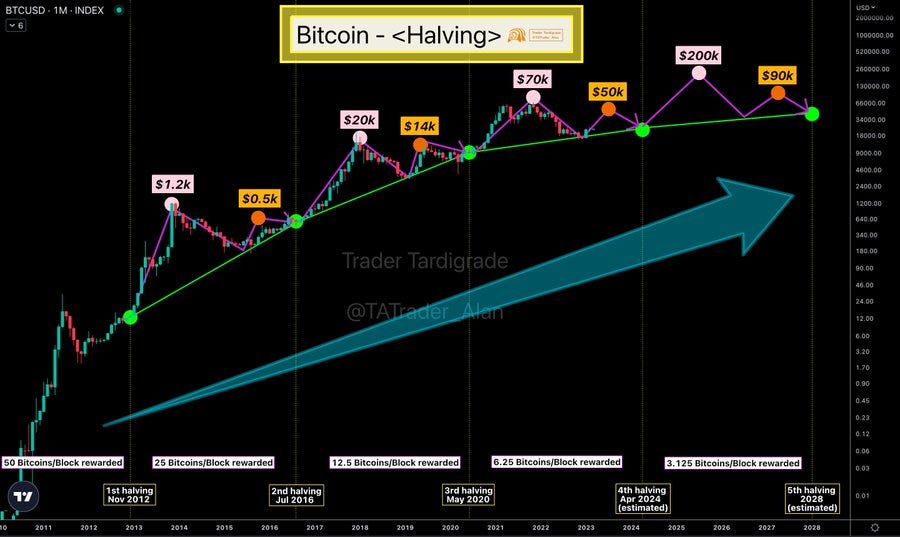
CRYPTO
The price of bitcoin rose slightly this week, back above the $42,600 mark and all this whilst the bitcoin disciples are getting all exited about the next halving.
An Unbelievable Economic Soft Landing
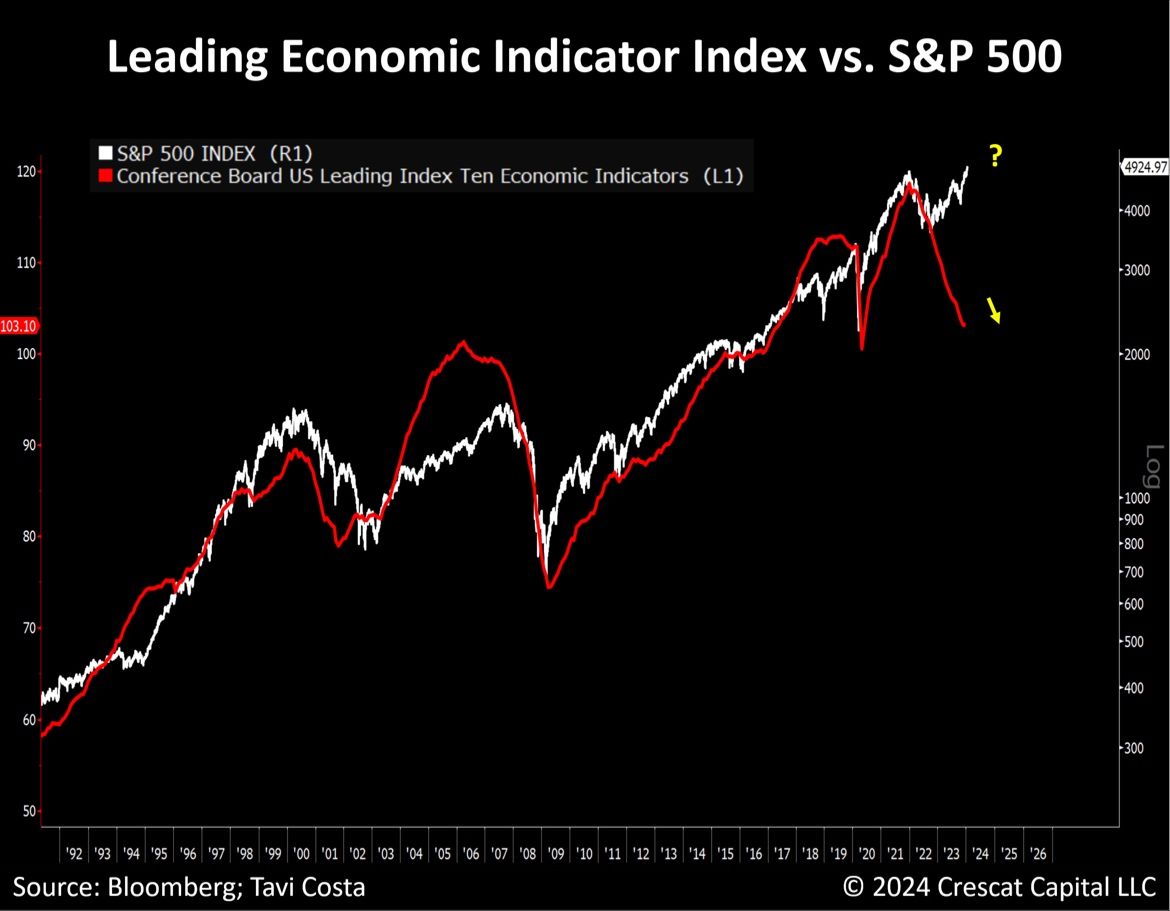
Other indicators also suggest that stock markets are too far ahead of themselves. One such indicator is the Conference Board’s Leading Economic Index (LEI).
The Institute for Supply Management (ISM) said on Thursday that its manufacturing PMI increased to 49.1. It was the 15th straight month that the PMI stayed below 50, which indicates contraction in manufacturing. That is the longest such stretch since the period from August 2000 to January 2002.
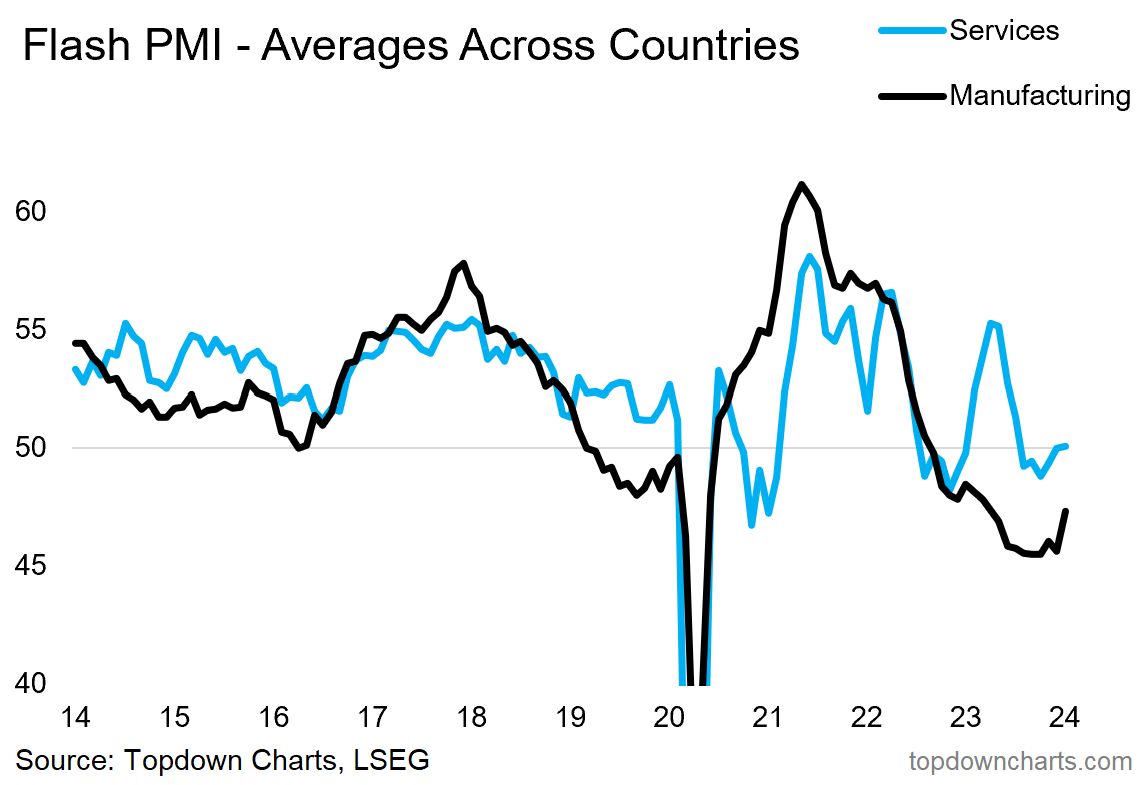
Nevertheless this period of slowing, seen quite clearly in the manufacturing PMIs in the chart below, looks to be turning the corner. And that means reacceleration (and all the interesting macro-market things that come with that….)
FED Jerome Powell Into Focus
The stock market got back to its Powell Fed ways last Wednesday with a big post-Powell press conference drop. Likely most in focus for Fed watchers was the dropping of the tightening bias; along with the fact that, about 35 minutes into the question-and-answer session, Powell mentioned that it is unlikely the Fed will cut rates in March.
The Fed has confidence in its policy decisions but needs to see a continuation of better data on inflation. Notably, the Fed does not see stronger growth as a problem in and of itself; but if the labor market were to weaken, that would argue for starting rate cuts sooner. Given the Fed’s meeting-to-meeting data dependency, we expect volatility around rate cut probabilities to persist.
The last major mistake for the Fed, t was “ignoring” the lag of the inflation curve from 2021 to early 2022, and the next major mistake may be inflating the “stock market bubble”. When Powell is well aware of this, he may reiterate his stance of not rushing to lower interest rates.
The subtext is that he’s determined not to repeat the mistakes of the 1970s and cut too soon, particularly when (unlike back then) there are no problems in the employment market.
As noted by Ed Yardeni A Fed’s rate cut cycle may boost the “irrational exuberance” of the US stock market. If the Fed “celebrates” the victory over inflation too early, it may exacerbate the risk of a significant increase in risk assets and give rise to a stock market bubble. Once the bubble bursts, an economic recession will follow.
Happy trades
BONUS
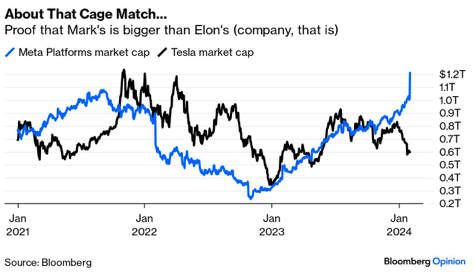
Last year, that competition saw Elon Musk, CEO of Tesla, challenge Meta’s Mark Zuckerberg to a cage match. The fight never happened, but financially, Zuckerberg has been inflicting a bruising ever since. Suddenly, the market says Meta is worth more than twice as much as Tesla
Before Meta’s blowout results, the Seven accounted for 45% of the S&P 500’s advance for the year — but the Magnificent Six, excluding Tesla, made up 71% according to Michael Hartnett of BofA Securities.
These are strange times. BofA suggests a “barbell” strategy of holding some of the big tech names and balancing them with investments that might do well if the bubble bursts. After 1999, that proved to be value stocks and emerging markets. They might prosper again.