

MARKETSCOPE : Endangered Species
December, 04 2023
Tribute
“Spend each day trying to be a little wiser than you were when you woke up. Day by day, and at the end of the day-if you live long enough-like most people, you will get out of life what you deserve.”
Charlie Munger
Perfect Landing
A touch and go hope triggers an “Everything Rally”.
Without doubt, November will go down in the history books as a banner month. The stock market rallied strongly on the back of a narrative that continues to revolve around falling inflation, a return to more accommodative monetary policy from the end of Q1 2024, and a soft landing for the US economy against a backdrop of AI-generated productivity gains.
The major US equity indexes ended higher for the week, with the S&P 500 Index and Nasdaq rounding out on Thursday their best monthly gains (8.9% and 10.7%, respectively) since July 2020.
FED Chair Powell said “tight monetary policy” was slowing economic activity, which traders chose to interpret as a signal that the Fed likely is done with rate hikes, even if the central bank hasn’t actually said so. The benchmark 10-year Treasury yield, which hit 5% in October, fell 24 basis points this week to end at 4.225%, its lowest yield since early September.
In the Eurozone, inflation rate continues to drop, although policymakers said it’s not time for rate cuts. The STOXX Europe 600 Index ended the week 1.35% higher while euro bond yields dropped. the German bund, after hitting the 3.01% target, has just broken its 200-day moving average at 2.55%.
Time to look back at the month just gone by :
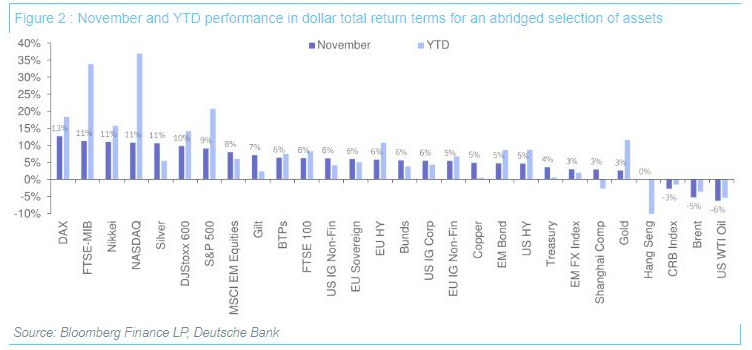
Source : ZeroHedge
Without doubt, unless you were unlucky enough to be China overweight, it was difficult not to create a very positive performance contribution in November (dark blue bars).
Which assets saw the biggest gains in November?
- Global Sovereign Bonds: Hopes for a soft landing drove the rally in sovereign bonds, as US Treasuries rose +3.6% in November, their best performance since August 2019. EU Sovereign bonds gained +3.0%, with specific advances for bunds (+2.6%), BTPs (+3.3%), as well as gilts (+3.1%).
- Equities: The risk-on tone meant that the S&P 500 gained +9.1% in its best month since July 2022, and the STOXX 600 rose +6.7% in its best month since last November 2022. The Hang Seng was an outlier, which traded flat at -0.2%, marking its fourth consecutive monthly decline.
- Credit: Demand for risky assets and the global bond rally saw US IG non-fin credit rise +6.2%, and European IG non-fin gained +2.4%. European HY and US HY rose+2.8% and +4.6% respectively.
Which assets saw the biggest losses in November?
- Oil: As fears of regional escalation of the Israel-Hamas conflict abated, Brent and WTI crude fell -5.2% and -6.2% respectively. Record high US crude oil production also added to the downward price pressure
Fourteen out of the nineteen benchmark indices now exhibit double-digit performance and only two markets remain negative year-to-date.
A busy week lies ahead for the market, especially following a weak ISM manufacturing report, which showed that stagflation may be becoming entrenched, as the continuing claims show that the unemployment rate may be on the rise. The macroeconomic agenda will be dominated by November’s US employment figures, on Friday. If this week’s data disappoints, it will likely lead to further yield curve steepening as the 2-year rate falls to the 10-year.
Chinese indicators (services PMI on Tuesday, credit figures on Wednesday and inflation on Friday) will also be closely scrutinized.
MARKETS : Christmas in November

November was truly a month of bad news being good news for stocks…’Hard’ data (red line) hits a 14-month low as S&P 500 surge back near record highs.
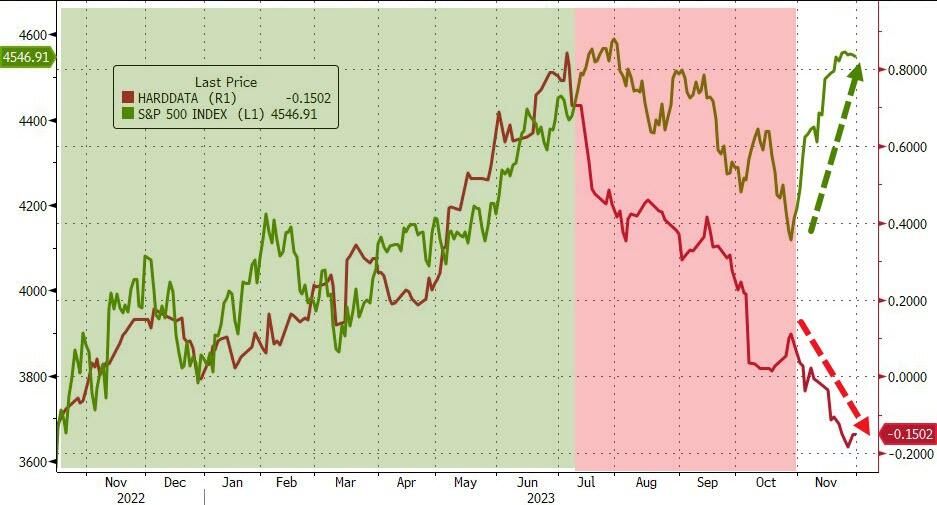 Bloomberg
As for sector performances
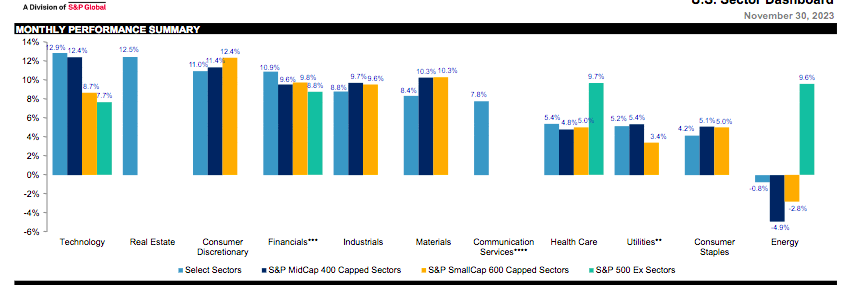
Long-duration sectors Technology and Consumer Discretionary have done surprisingly well. On the other side of the performance gamma we meet defensive sectors Consumer Staples and Health Care, and making a bit more sense, Utilities, which are often considered a bond proxy.
The NASDAQ index is five percent away from the following two achievements:
a new all-time high and a 50% year !
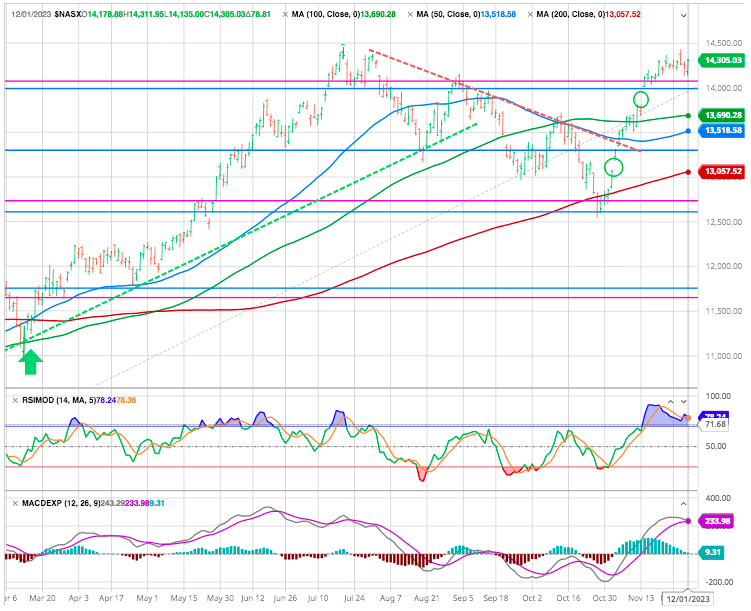
We now expect a consolidation or correction over the next three weeks before the year-end “Santa Rally.”
Let us provide some technical guidance as to what we are seeing right now.
As we were approaching the 4100 S&P support region we outlined in our previous comments, many were again expecting a continuation lower. However, we clearly noted that we were expecting a rally back to the 4350-4475. Now that the market has rallied back towards the recent highs, we have to be extra vigilant at this time.
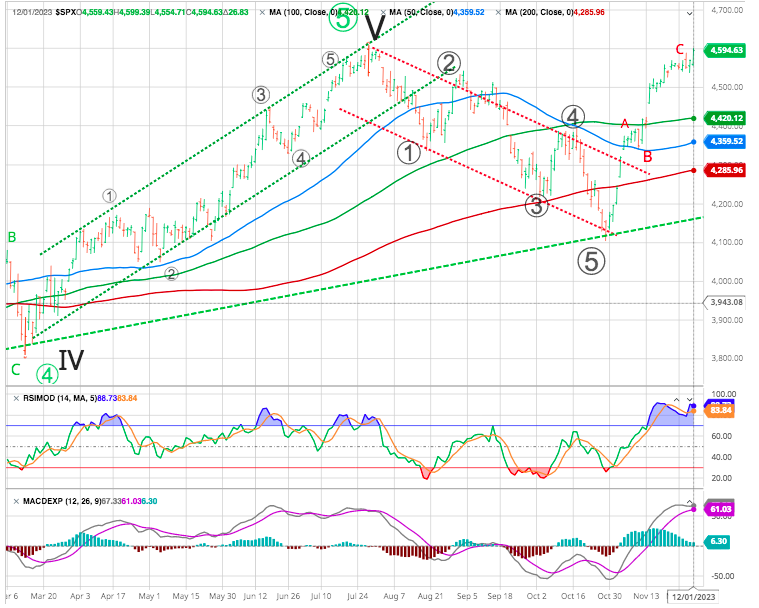
This is where Elliott Wave analysis can provide market context as to how the view the next step the market provides to us.
Thus far, we have seen a 3-wave rally off the low, which we classify as an a-b-c structure. While the b-wave was unusually small, it still fits well within that view. Moreover, the c-wave segment of this rally off the 4100SPX low has been hitting its head at the point wherein the c-wave was equal to .764 times the size of the a-wave. The great majority of the time, we see equality between the a-waves and the c-waves. Yet, that ratio does satisfy a reasonable sizing for a c-wave rally relative to the a-wave.
So, here is the kicker as to how we will see the market as we look towards 2024. If the market remains below 4610 S&P, and then declines below 4420/4450 support in a five-wave structure, that would suggest it was setting up for a market crash, which will initially point us down to the 3500-3700 area.
However, if the market should either continue to the a=c point at the 4630/40 level before breaking down below 4420/4450, or if the market should stay below 4610 and decline below 4420/4450 in a corrective manner, then we are likely setting up for a rally to 4800+ as we look towards 2024.
In the former scenario, a more direct move to 4630/40 would still likely provide us with a larger corrective pullback before we begin the move to 4800SPX.
These are the clues we shall follow over the coming weeks. And how the market takes shape over the coming weeks will likely tell us if we can get to a new all-time high before that long-term downtrend begins in earnest or if that bear market has already begun.
Let’s check long term evolution
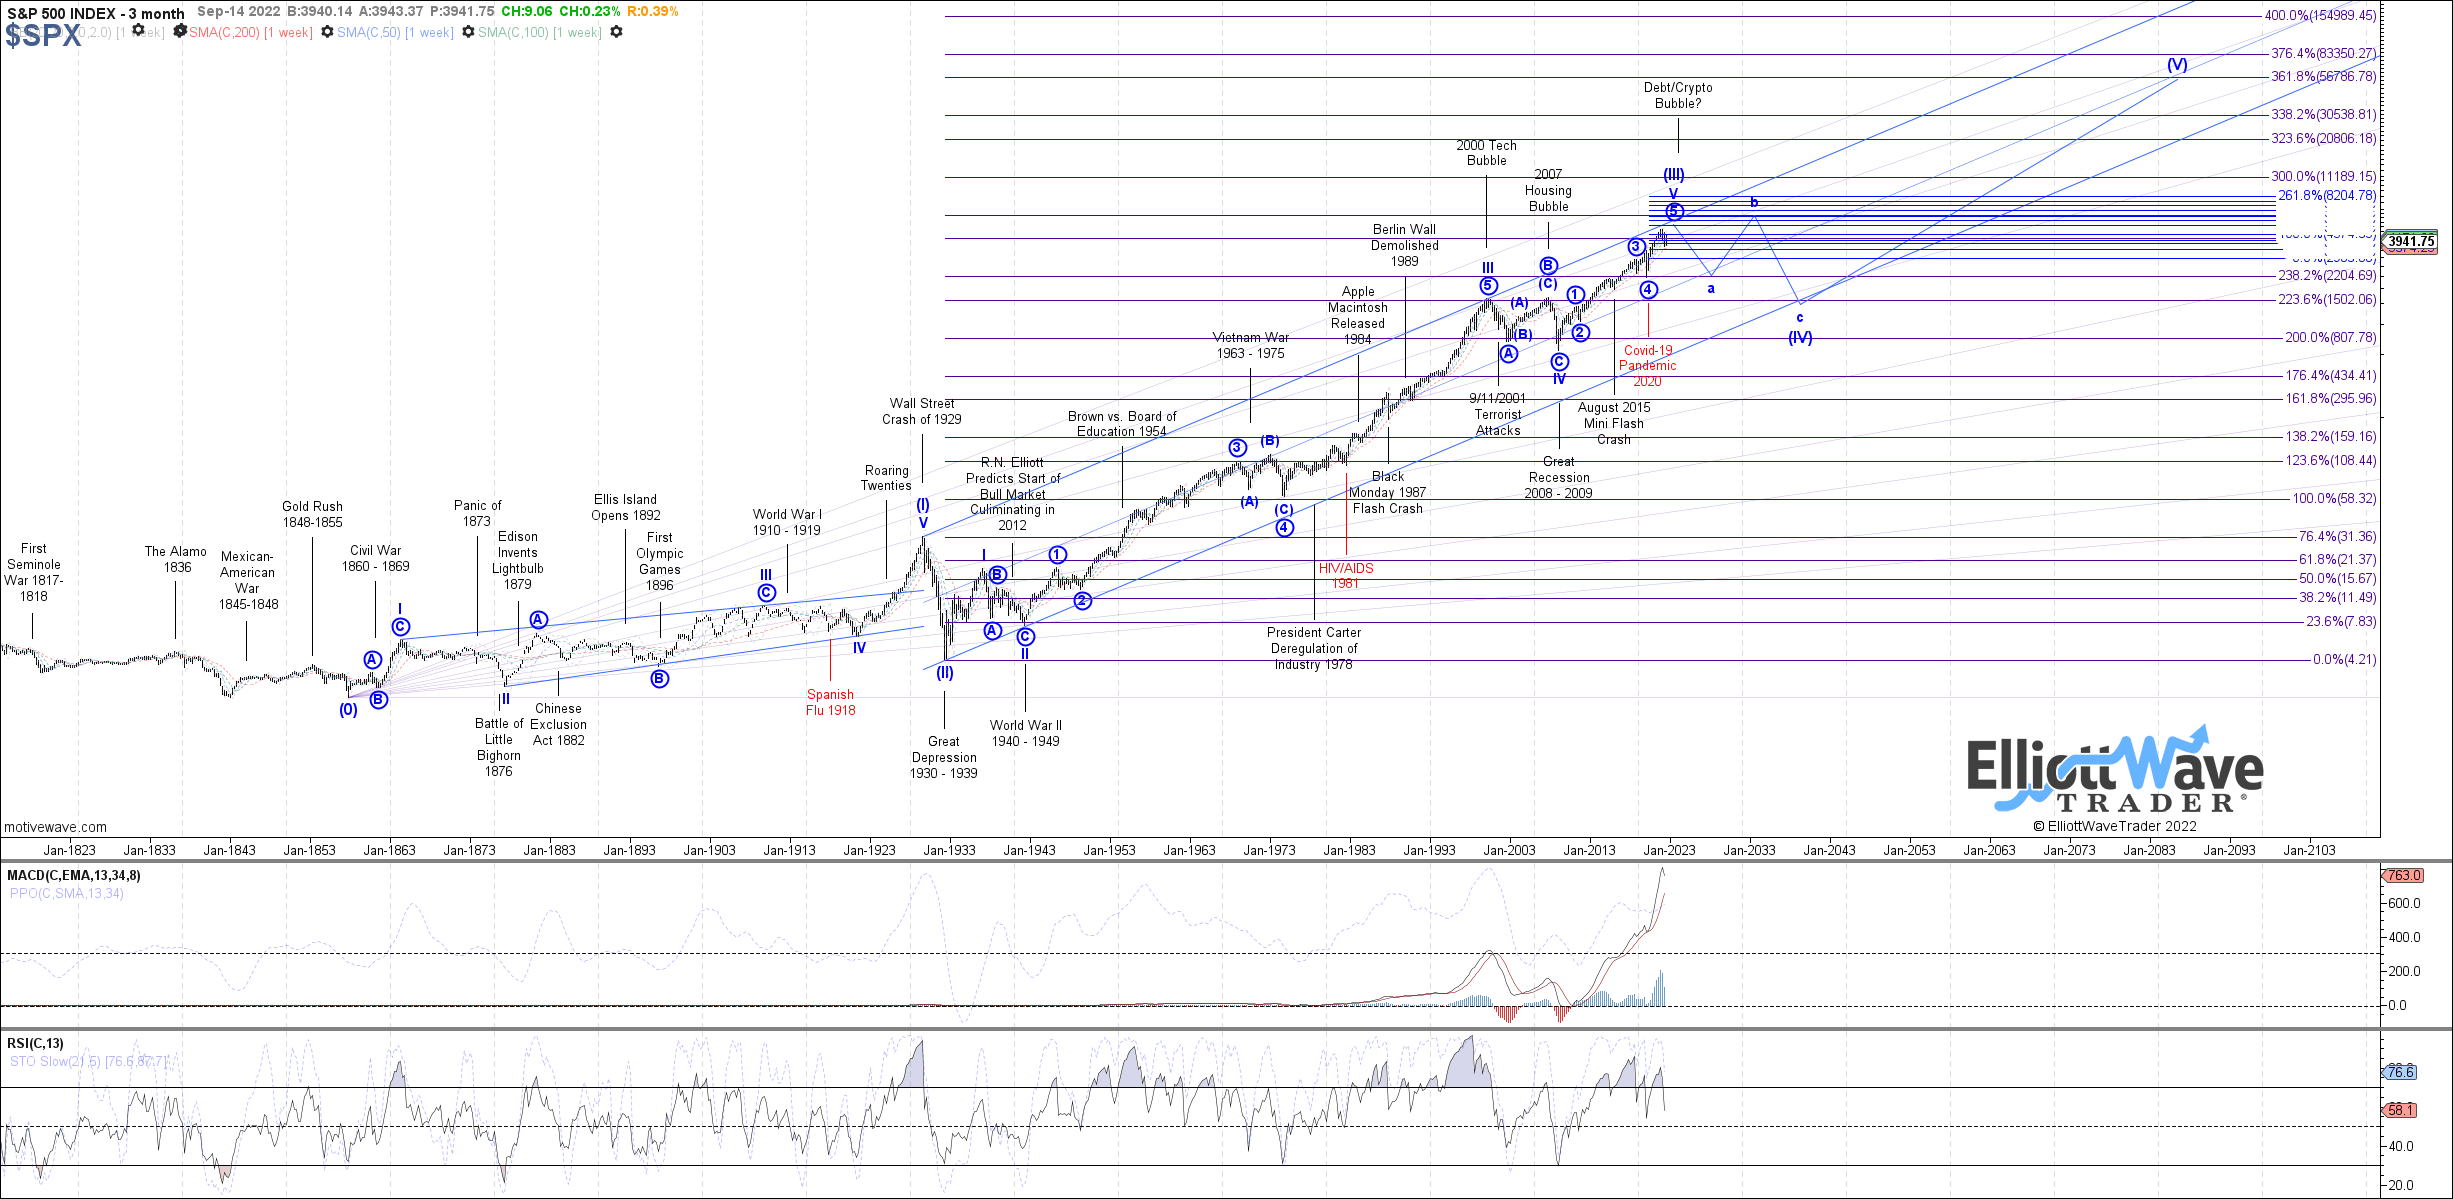
As you can see from the chart above, a very large and potentially long-term dull market could develop over the coming years. Our expectation is based on the completion of a long-term bull market, which will then likely usher in the longest consolidation/correction phase.
Also check our older presentation Point Break : L.T. cycles Kondratieff and Elliott waves
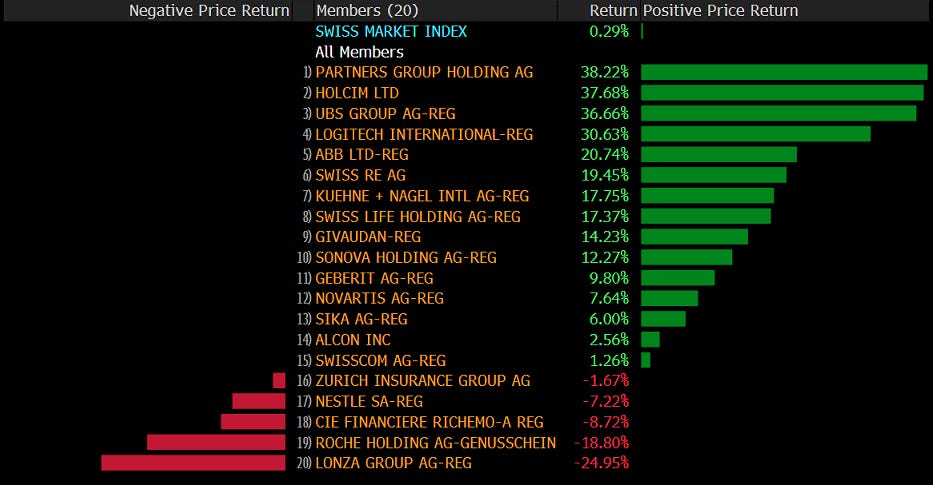
Scrolling back up to the performance table above, we note that two ‘European’ markets, UK and Switzerland, are the third and fourth worst-performing markets out of those 19. Albeit both exhibit small positive YTD performances, but in both cases thanks to November.
STOXX 50 looks good :
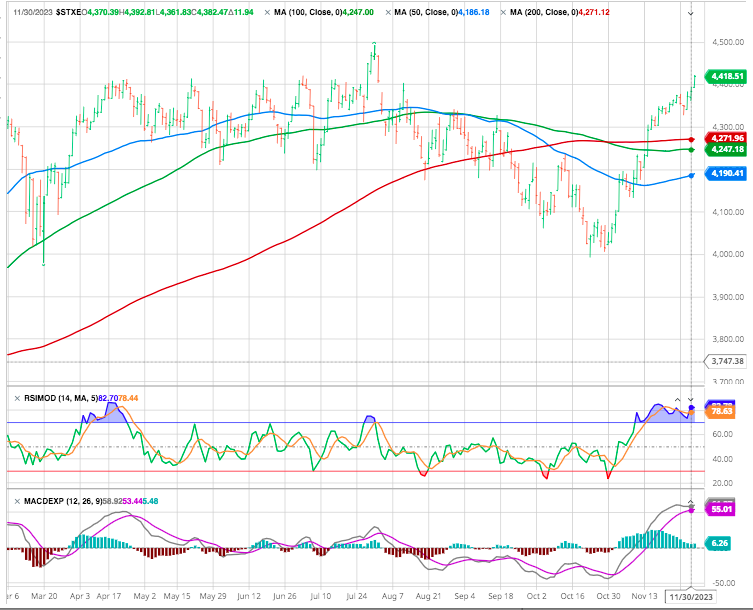
And here’s the chart of Switzerland’s SMI, which continues to look unhealthy:
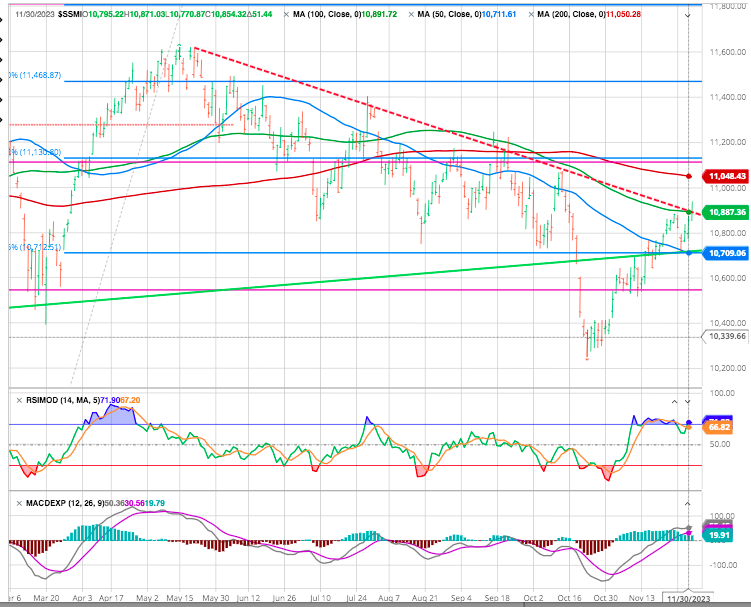
Maybe it is the fault of some big weights in the index, Roche and Nestle for example that pull the SMI down?
GOLD
Precious metals, too, were on the move again this week. Gold just had its highest monthly closing price since …. waitforit … EVER and not a lot of people seem to be talking about it after a triple top it finally broke.
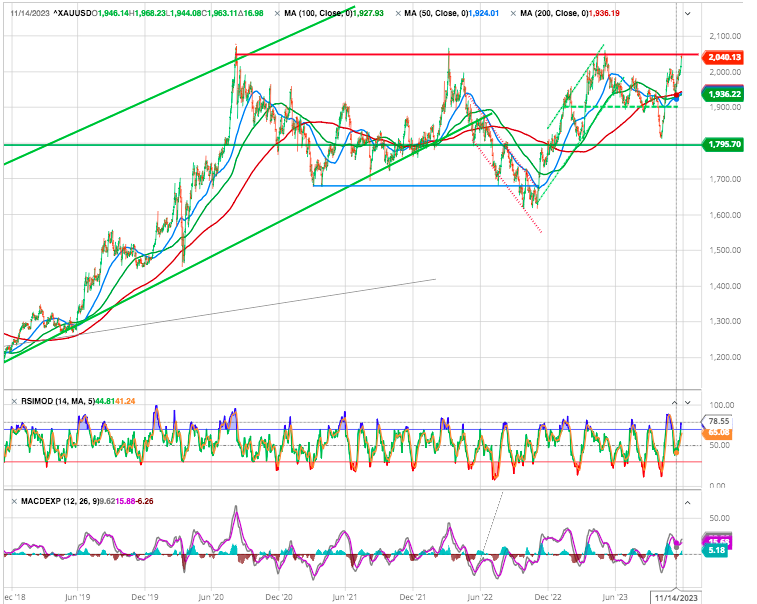
We had been keeping a strong allocation to the yellow metal as an hedge all over the past couple of years- Maybe time to take some profits although we have a target of 2700 (1.618 x the last wave up) . see strategy and asset allocation
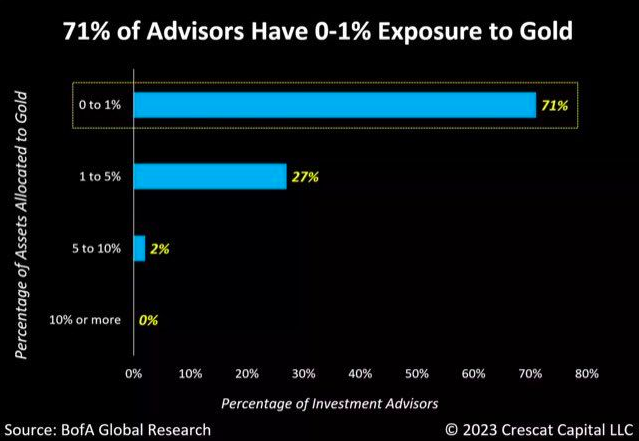
As highlighted by Tavi Costa, one of the positives for gold today is the consistent neglect of the metal as a defensive alternative over the past few decades.
This is evident in the significant underrepresentation of precious metals among traditional investment strategists.
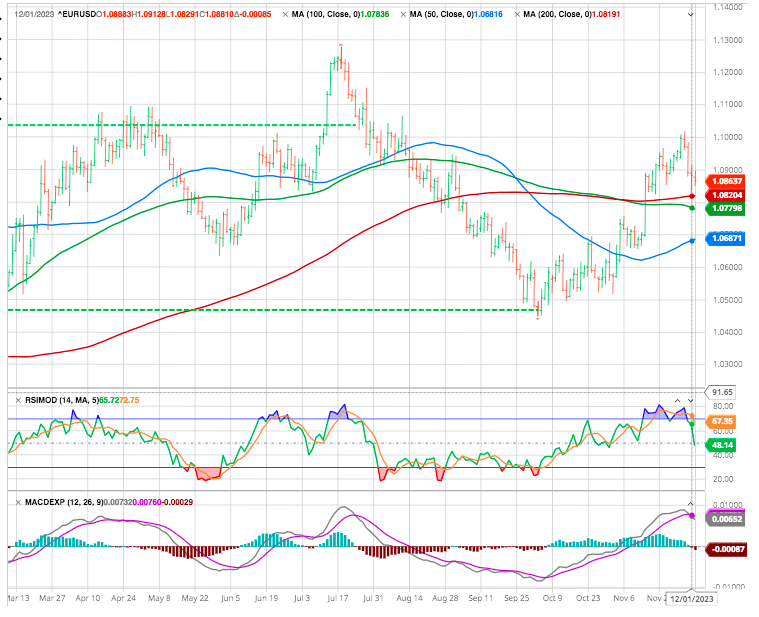
USD
“Fed-driven dollar weakness will be a story for 2024,” writes ING. The most likely path to a weaker dollar will probably have to come from softer U.S. macro data. Given that a US slowdown is more likely in the next coming quarters rather than this one, we therefore expect EUR/USD to end the year around this actual level. Into 2024, however, we expect the short end of the U.S. curve to start moving lower ahead of Fed easing next summer and the dollar to turn lower.
Cryptos
Bitcoin is on course for its seventh consecutive week of gains, rising from $27,000 to over $40,000 in the process. The forced departure last week of the CEO of the world’s largest cryptocurrency platform, Binance, definitely had no direct impact on the BTC price.
Overvalued Magnificent 7 compared to the market
Year-to-date, the seven mega techs have seen a serious run-up.
This chart from Apollo Group’s Torsten Slok compares an “S&P 7” index with an S&P 493 that includes all the rest. The gap is astonishing
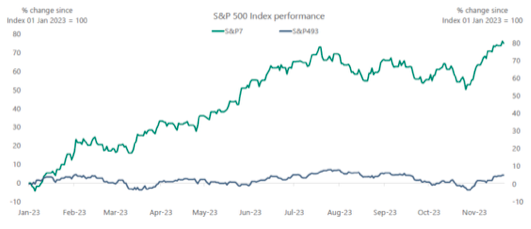
Source Bloomberg Opinion John Authers
Despite reports of rainbows and puppy dogs and “the U.S. consumer is in great shape” narratives, a tiny sliver of the S&P 500 is generating any returns YTD. Seven mega-cap tech stocks are up 80% collectively for the year, while the remaining 493 other stocks that make up the S&P 500 are up just 4% in 2023.
Despite strong Q3 earnings results, valuations of the Magnificent 7 are severely stretched. Through October, the Mag 7 forward P/E was 29x vs. the S&P 500 at 19x. Looking ahead, this level of performance seems unsustainable as investors begin to recognize the overstretched valuation framework of these stocks.
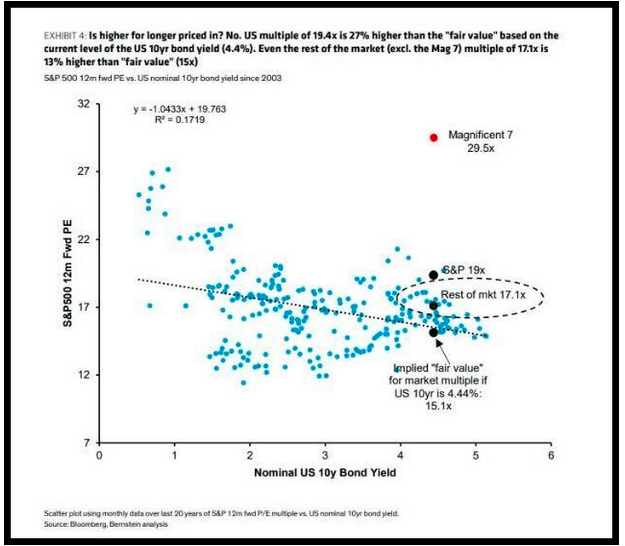
Bloomberg, Bernstein Analysis
Most indexes have doubled since early 2018, with Apple and Microsoft maintaining the largest weights.
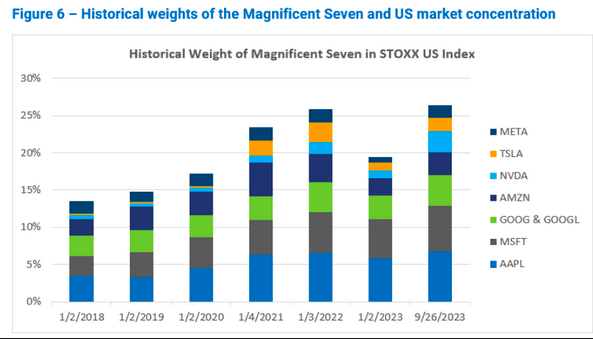
(Qontigo.com)
This could leave them and the overall market vulnerable to a pullback as we head into 2024. these mega-caps are likely to face much stronger headwinds in 2024. Not only because of much higher valuations but because a recession seems likely in the coming year. Or, as the old adage says, trees don’t grow to the sky.
Happy trades
BONUS :
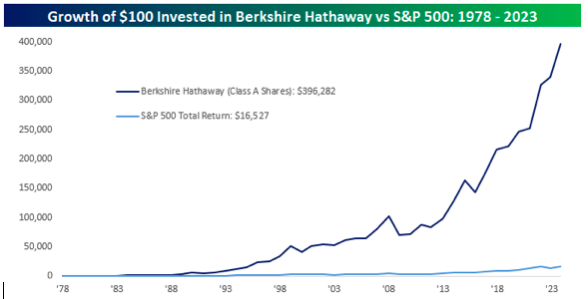
The chart below compares the growth of $100 invested in Berkshire Hathaway when Charlie Munger officially joined the firm in 1978 to the growth of $100 invested in the S&P 500 on a total return basis.
Source Bespoke
While $100 invested in the S&P 500 in 1978 is worth $16,527 today, that same $100 invested in Berkshire Hathaway is worth nearly $400,000! Not bad for two guys who started out in an Omaha grocery store. RIP to Charlie Munger.
Source Bespoke