

Fibonacci Sequences and Elliott Wave Theory
October, 31 2023
Key takeaways
- The Elliott Wave theory is a technical analysis of price patterns related to changes in investor sentiment and psychology.
- The theory identifies impulse waves that establish a pattern and corrective waves that oppose the larger trend.
- Each set of waves is within another set of waves that adhere to the same impulse or corrective pattern, described as a fractal approach to investing.
- Fibonacci retracement levels connect any two points that the trader views as relevant, typically a high point and a low point.
- The percentage levels provided are areas where the price could stall or reverse.
- The most commonly used ratios include 23.6%, 38.2%, 50%, 61.8%, and 78.6%.
- These levels should not be relied on exclusively, so it is dangerous to assume that the price will reverse after hitting a specific Fibonacci level.
- Fibonacci numbers and sequencing were first used by Indian mathematicians centuries before Leonardo Fibonacci
We are going to take some time to explain how we view the current structure from an Elliott Wave perspective. Moreover, we will go into a lot of basic instructions regarding Elliott Wave patterns . So, you may want to learn more (plenty of tutos on the net) or to stop reading if you really do not want to learn something about Elliott Wave analysis.
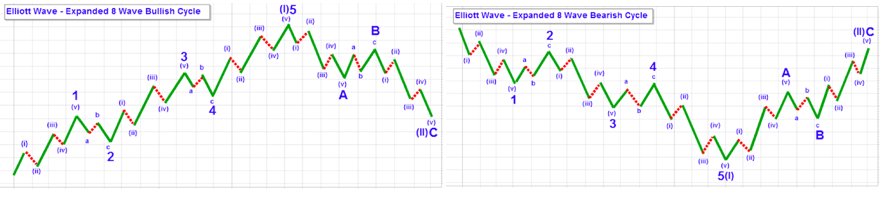
The trend decomposition is an example of the fractal nature of the Elliott Wave patterns. A fractal is a curve or geometric figure, each part of which has the same statistical character as the whole, and anything that resembles this type of formation is said to be fractal.
Within the Elliott Wave structure, this is evidenced by the expanding and contracting similarity of wave structures.
In looking at the larger market picture, the bearish perspective would view the initial decline from the 2021 high to the 3500SPX region that was completed in October of 2022 as a major 5 wave correction-wave, the rally to the 4607 level was a corre tion I-II-III or ABC wave, and that we have now begun another downtrend into 5 wave sequence pointing us down to the 2900-3300 region.
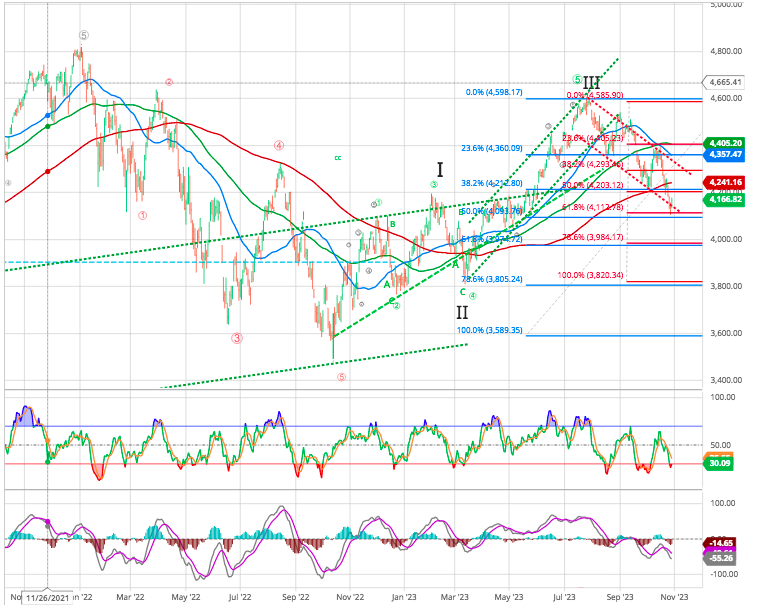
Therefore, we would count the initial 5-wave structure decline from 4607 currently being in wave v of 1 in the downtrend-wave.
Now, within diagonals, our Fibonacci Sequence methodology tells us that wave v often targets the 1.618-1.764 extensions of waves i and ii. In our case, that is the 4060-4100 range, with the 1.382 extension being around 4165.
Example

Source : investopedia
Should the market see a sustained break of the 4165 level, and continues down to the 4060-4100 area, then we have no choice but to view this decline as wave 1 of the 5-wave pointing us down to the 2900-3300 range as we look towards 2024.
One of the nice things about this approach is that you only have to count to 5, and you only need to know the letters a-b-c within the alphabet. But, in being able to count to 5, we understand that once we complete wave 1, then it is reasonable to expect wave 2.
1-2-3-4-5 waves
Therefore, as long as we hold the 4000-4100 support, then it is reasonable to expect a 2nd wave counter-trend rally back to the 4375-4475 range before wave 3 begins to take us down in earnest into 2024.
Now any durable market’s drop below the 4100 target, it will provided an environment that can set up a market crash which would point down to the 2900-3300 area before another multi-year bear market rally begins.
Will it actually happen? Well, we cannot say that with a high degree of probability just yet. It highly depends on how the next rally takes shape. But, make no mistake about it. The drop to 4100, unless a bear trap, has certainly increased that probability.
Trying to share some very basic lessons in Elliott Wave and Fibonacci Pinball may be a bit confusing to those that have not had any prior exposure to this type of analysis.
Of course, there are other ancillary factors to the standard EW and Fibonacci Sequences structures. Therefore, we provide our perspective by ranking probabilistic market movements based on the structure of the market price action AND primary fundamental analysis as to how the market might be affected and will move next.
Stay tuned