MARKETSCOPE : Heads I Win, Tails You Lose !
July, 10 2023Stocks stumbled through a choppy trading session to end lower Friday, as investors digested the latest nonfarm payrolls report following hotter than expected private hiring data the previous day.
This week was a radical change compared to the previous one, with a clear return to risk aversion as investors realized that the Fed and ECB will continue to tighten monetary policy between now and the end of the year. At the same time, fears of recession have regained some momentum, while the latest statistics from China and the Eurozone have highlighted a further contraction in activity.
The U.S. government report showed the economy created 209,000 jobs in June, well below expectations and the smallest increase since the end of 2020. The data was taken by some as a sign that the Federal Reserve’s interest rate hikes were finally starting to cool the labor market, but other details of the report such as stronger than forecast wage gains suggested the Fed may have reason to resume raising rates later this month, with a possible further tightening in September and this will weigh on growth.
The latest update on inflation in the U.S. will drop on the lap of investors, with June CPI report scheduled to be released on Wednesday.
Even if this has been repeated over and over again, it seems that the financial community is only just beginning to take this on board. So we’ll be watching for the start of any paradigm shift.
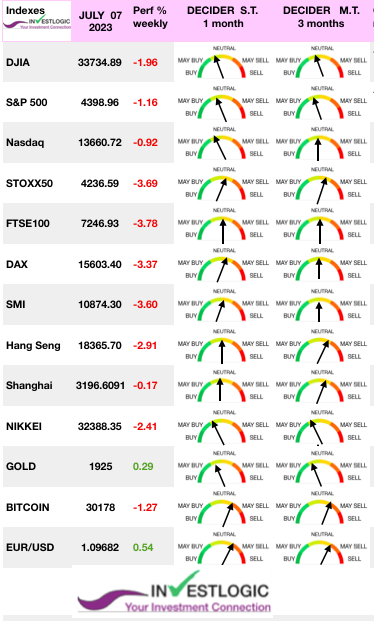 The S&P 500 was down -1.2% last week, while small-cap stocks underperformed large-cap equities. Growth stocks held up modestly better than value shares.
The longer-end US 10-year yield was up 2 basis points to 4.06% while the more rate-sensitive 2-year yield was down 7 basis points to 4.94%.
The STOXX Europe 600 Index fell 3.09% on fears that central banks might need to keep tightening monetary policy. Investors were also disappointed by a lack of specific measures to bolster the Chinese economy despite more pledges of support from government officials. Japan’s stock markets fell over the week, with the Nikkei 225 Index registering a 2.4% loss.
After the mixed US employement data, equities may be ripe for a pullback following big gains in June and in the second quarter, which could lead to choppiness and consolidation heading into earnings season.
With Q2 earnings season set to start this week, the current momentum behind the market remains strong as investors continue to buy even the slightest dips in fear of missing out (F.O.M.O.) on further upside. Unfortunately, the bulk of the advance remains driven mainly by only a small handful of stocks.
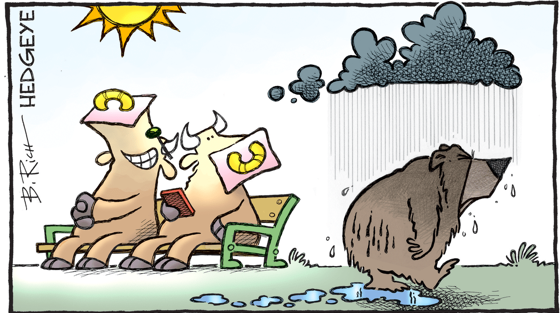
MARKETS : The time to worry is when nobody is really worried.
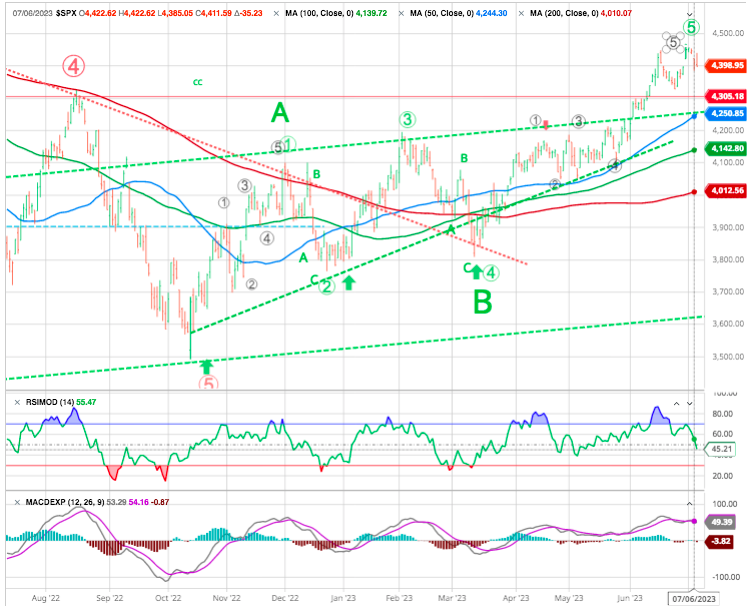
The market remains short-term overbought and deviated above longer-term moving averages. While momentum will continue to propel markets, such does not preclude an eventual correction resetting some of the overbought conditions.
In the short term, the RSI has formed a bearish divergence from an extreme level and the price made a bearish “island gap reversal”, a pattern consistent with a trend inversion. The 4325-37 support area in the S&P500 (SPY) has been highlighted for several weeks now and was finally tested last week. Surprisingly, there was no real capitulation to flush out the last of the bulls, and the 4325 major support was never breached.
It is unknown when such a correction will occur or what will cause it. However, such a correction would provide a much better entry point to increase portfolio equity risk. The current market conditions warrant a careful and proactive approach. As defensive sectors continue to capitulate, investors may need to reevaluate just how long bullish optimism is warranted. We are skeptical it can for much longer, as examples like 1987 show us.
EARNINGS
The earnings season kicks off with major banks some of the heavyweights stepping into the earnings confessional. The readout on what major banks say about deposit flows and loan growth is also anticipated to have an impact on regional banks’ stocks. Some analysts have warned that large banks’ earnings have peaked as net interest income is likely to continue to decline, credit costs are gradually normalizing and increasing, and expenses are pressured by inflation.
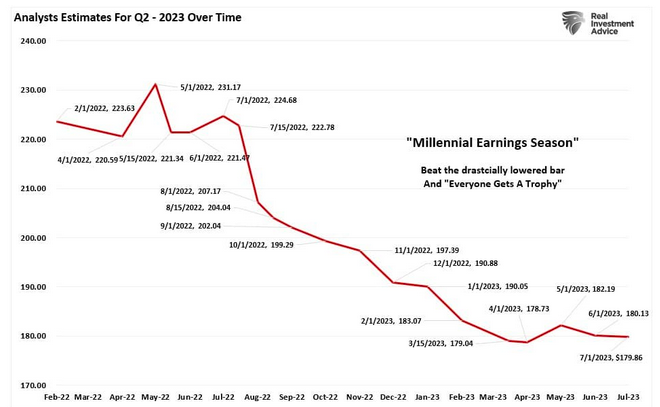
The chart below shows the estimate changes for Q2 earnings from February 2022, when analysts provided their first estimates.
U.S. corporate profits hit record levels in 2022, even as stocks fell into a bear market and inflation reached 40-year highs.
Given these headwinds, investors are watching corporate fundamentals very closely. Corporate profit margins provide a buffer against higher borrowing costs and price pressures and for many reasons, they are a key measure of financial health.
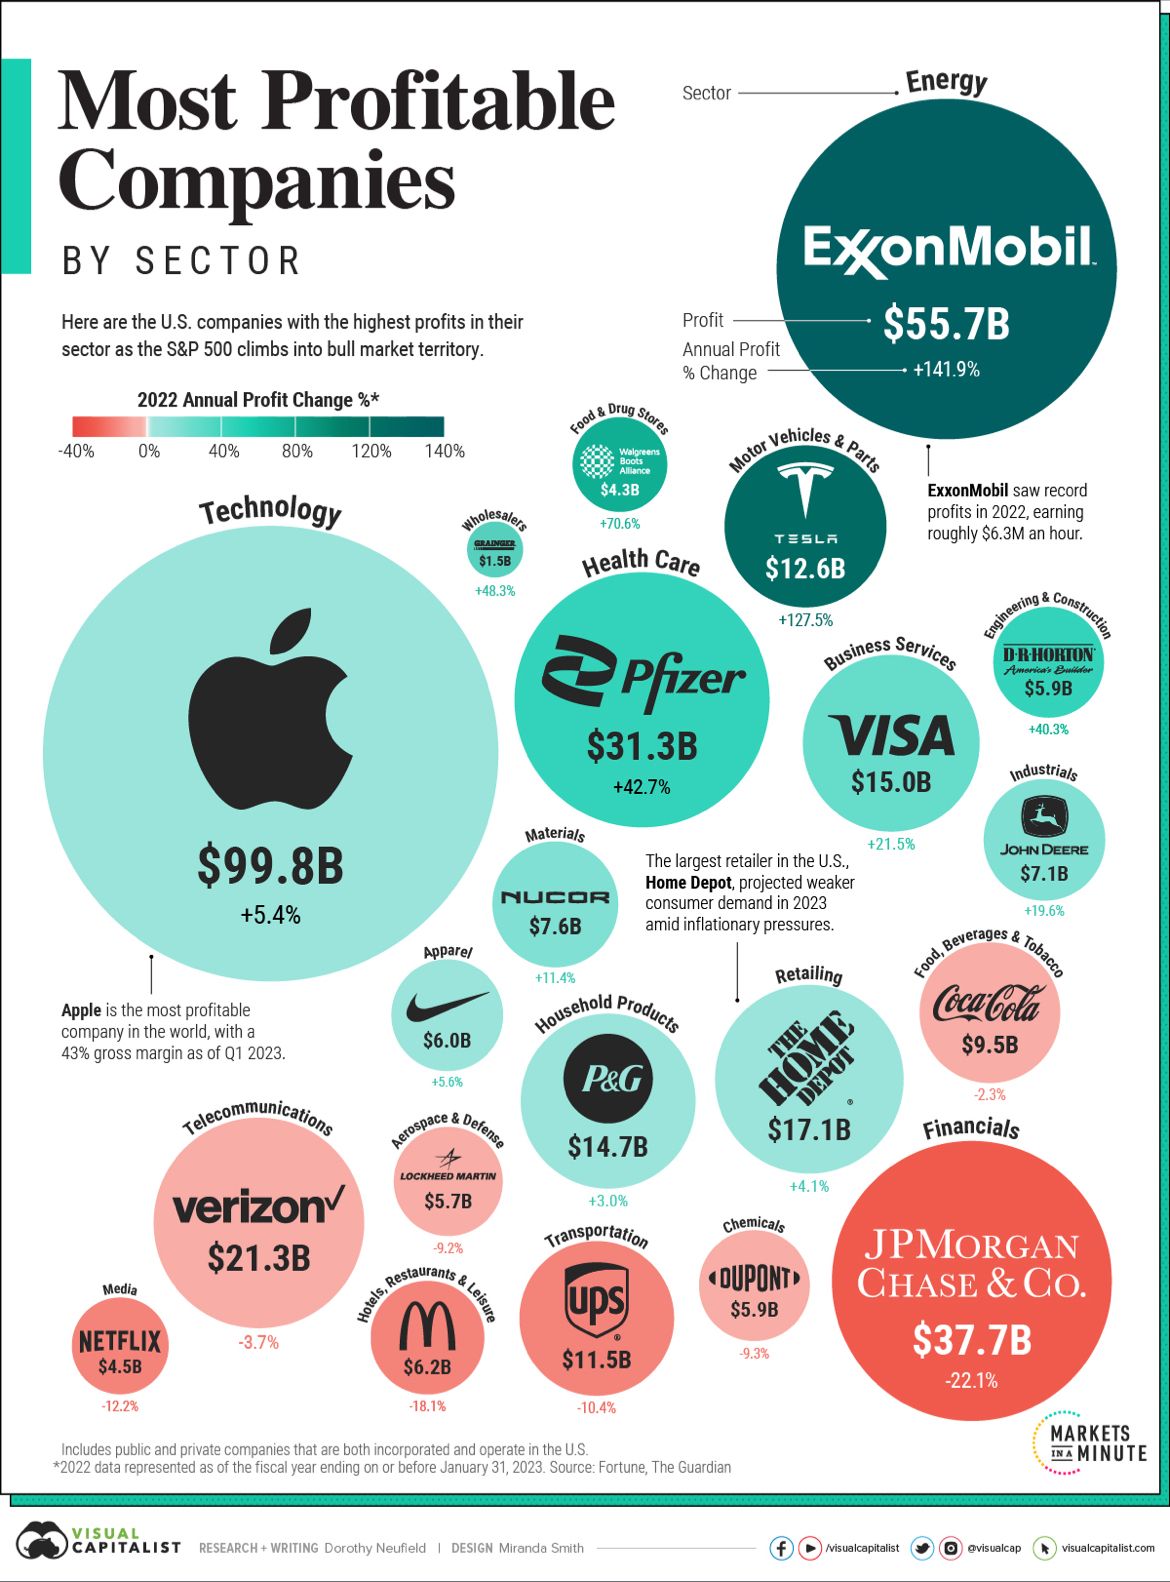
Here are the U.S. firms with the highest annual profits in their sector. Data is based on the fiscal year ending on or before January 31, 2023 across companies in the Fortune 500.
Both public and private #companies that are incorporated and operate in the U.S. are included.
Apple is the most profitable company in America. Reaching almost $100 billion in profits in 2022, it outpaces the profit leaders in both the energy and financials sectors combined. Furthermore, at the end of 2022, its net profit margin stood at nearly 25%.
Amid a maturing smartphone market, the company is focusing more on service-based revenue. iPhones make up roughly half of its total net sales, yet growth is plateauing. Last year, iPhone sales growth was 7%, compared to 39% the year before. Meanwhile, services sales—including cloud, AppleCare, and advertising—increased 14% annually.
Within the energy sector, Exxon Mobil took the top spot with record profits of over $55 billion. Profits jumped almost 142% last year as oil prices spiked with Russia’s invasion of Ukraine. Steep cuts in costs through the pandemic also helped to bolster the company’s returns.
JPMorgan Chase saw the highest profits in the financial sector. As the nation’s largest bank by assets, it saw a sharp decline in its investment banking division as higher interest rates made financing mergers and acquisitions less lucrative. Overall, profits sank more than 22% annually.
Swiss index (SMI) has failed to gain traction
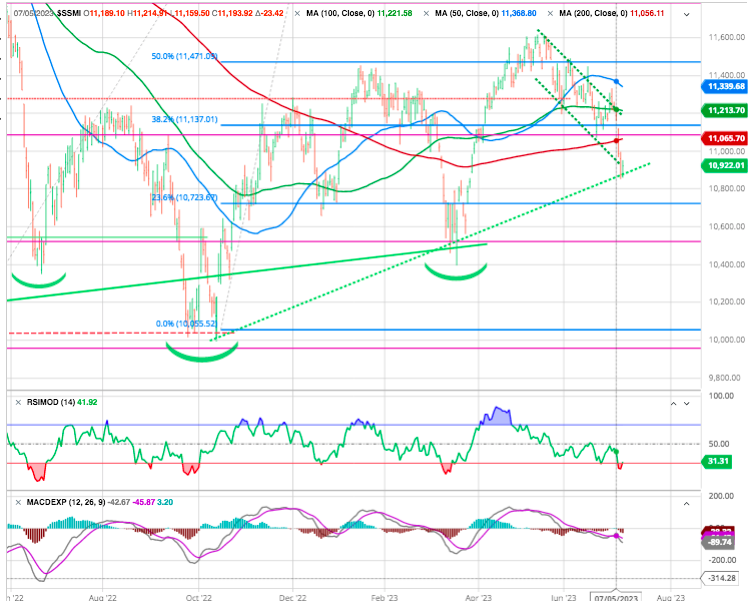
The Swiss index failed to move significantly above the 50% Fibonacci retracement of the bear market (11’550). In May, and the negative momentum has resumed, sending it below a series of supports.
Short-term, it has pulled back to the lower band of the downtrend channel, and while in the short-term a rebound from oversold may occur, the risk of further decline may prevail in the medium term.
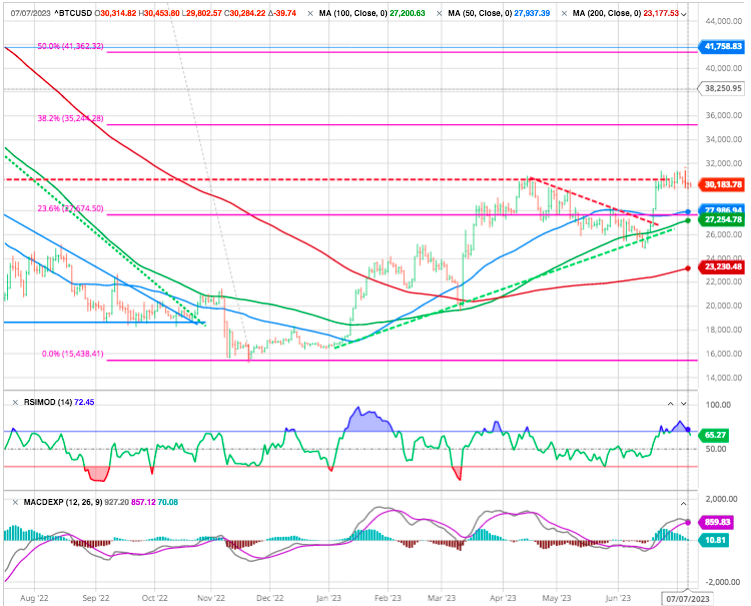
Bitcoin has rallied back above $30,000.
After skyrocketing well past $60,000 in November 2021, bitcoin fell off a cliff, falling to roughly $16,000 a year later. Since then, Bitcoin has battled back, nearly doubling in value. It’s worth noting that bitcoin has largely followed the directional trend of the stock market over this period of time—climbing, plunging, and rallying back some.
Waiting for the (Godoish) Recession
Last Monday, the ISM Manufacturing report refuted every single bull case that has existed for the 19 months since we turned bearish on February 2022.
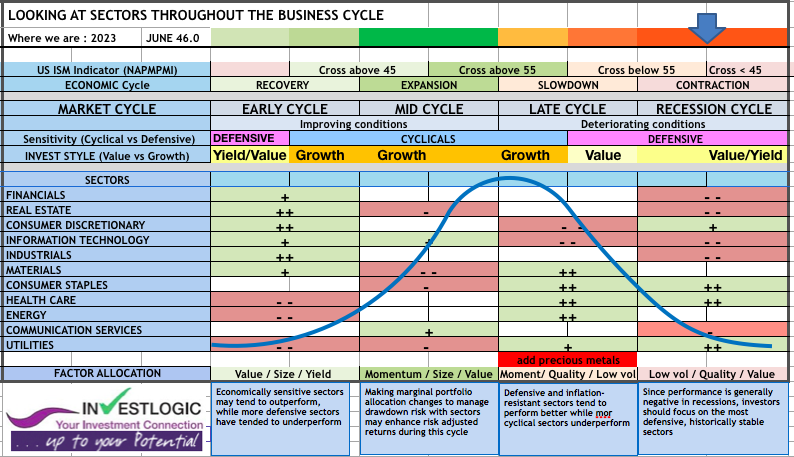
check our proprietary ABS matrix and our business cycle analysis
The June Manufacturing PMI registered 46 percent, 0.9 percentage point lower than the 46.9 percent recorded in May. Regarding the overall economy, this figure indicates a seventh month of contraction after a 30-month period of expansion.
Also buried inside the ISM Manufacturing report was a disconcerting signal on the U.S. labor market : Employment not only sliced through the particularly important level of 50, which says you’re in contraction, but it did it like a hot knife through butter! The Employment Index dropped into contraction, registering 48.1 percent, down 3.3 percentage points from May’s reading of 51.4 percent.That’s a huge deceleration.
This is where people who don’t understand the manifestation of recessions get caught offside.
Despite the year-to-date rally in 7 stocks sending the broader stock market higher, the precarious warning signs from the market and economic data are clear for anyone to see… all you have to do is look.
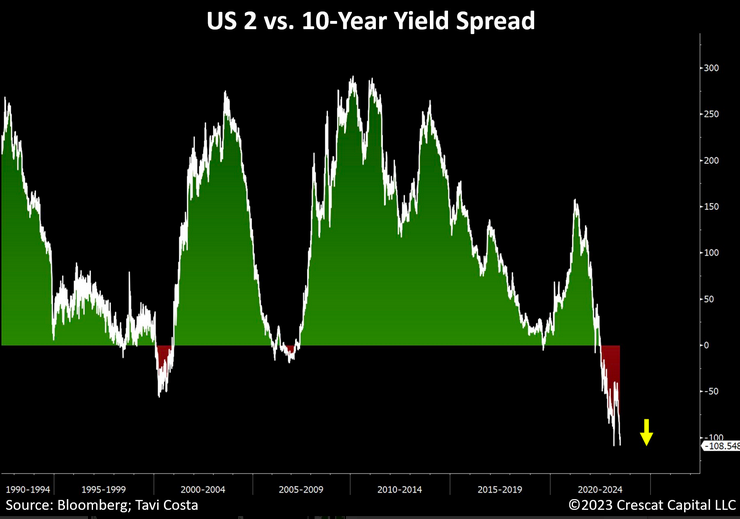
See the inversion of the 10s-2s yield spread is a classic recession indicator. It’s been 42-year since the yield curve hit its current levels.
We are also seeing sharply rising wages and, in turn, higher prices for services in many industrial nations. Fresh growth would undoubtedly exacerbate the existing labour shortages. The central banks would inevitably have to raise interest rates again. The prospect of capital market interest rates remaining below money market rates would then be highly unlikely.
Today’s issue in the Treasury curve resembles prior stagflationary times with yields across all durations continuing to move higher.
Financial markets (and the world) are just seriously screwed up right now.
- Sticky high inflation hitting U.S. households…
- Fastest Fed rate hike cycle in history…
- 7 stocks propelling U.S. equities higher…
Are current market trends BULLISH or BEARISH?
That said, there’s always a bull market somewhere.
“Long Japan” was one of our strategy in April 2023 for a reason. In May and June, Japan’s Nikkei Index increased nearly 9%. And speaking of the yield curve, among all developed economies, Japan’s yield spread is the most positively sloped. Japan, as an investable equity market, is underappreciated.
SEE OUR STRATEGY
Also see the excellent article by John Authers (always a good read) on Emerging Markets : Some Contrarian Positivity
JANET FLOWERS
During SecTreas Janet Yellen’s visit to China, the government announced starting next month, China will impose restrictions on the global availability of gallium and germanium, obliging purchasers of these rare metals to obtain permits. This action underscores China’s prominent position as a major supplier of essential materials crucial for the production of various technologies utilized by consumers worldwide.
“This is no bouquet of flowers for Janet…The timing and symbolism could not be more clear to just about everybody in Asia, if not the rest of the world.”
Happy trades
BONUS
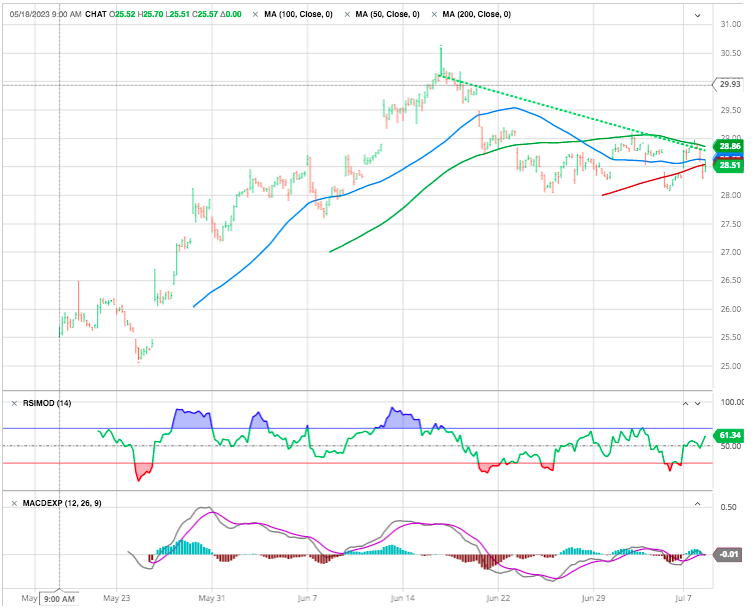
Did you know there already is an ETF for generative AI? No?! Well, now you do!
Under the ticker CHAT (another ingenious marketing specialist shining brightly…)- you get to ‘passively’ invest with one of the holding companies:
The ETF was launched on May 18th of this year, and guess what happened shortly after the launch?… It started to underperform the broader market (S&P 500)…..
Just a blip, or is AI about the face the same destiny as other investments fads, think:
Rare Earth (REMX)
3D printing (PRNT)
Cannabis (POTX)
{insert your favourite failed ETF theme here}
Until next time


