Weekly Market Review as of September 8 : Forward Guidance
September, 09 2013If Bernanke prints it, someone will spend it- aka the administration favoring its military spendings –
Is Fed Foward Guidance Losing Credibility?
 The monetary exit has come closer and the Fed has less discretion now that it is committed to a guidance framework. The forward guidance may also be used to manage the exit from ultra-easy monetary policy. The central bankers obviously worry about managing the exit. The Fed’s contingent forward guidance actually manages the exit in the sense that markets know that rates will be normalised when the unemployment rates comes closer to 6.5%. However, the bearish trend in fixed income markets means that will see the central banks trying to guide market rates lower again.
Debating thresholds will undermine their value. The July minutes indicated a potential FOMC willingness to offset a potential taper decision by lowering the 6.5% unemployment rate threshold or introducing a new inflation trigger to the downside. The intention may well be to introduce a fresh dovish bias to coincide with the end of QE. Given the current data trend , the risks seem to be skewed toward the market losing faith on Fed guidance sooner rather than later. The net result should be higher US rates, probably led by curve flattening as the market brings forward Fed tightening.
The yields of longer-dated US Treasuries have been rising as markets position for Fed tapering. However, the recent sharp rise in 2-year yields is arguably an even more noteworthy phenomenon. Two-years had been well-anchored around 0.25% ever since the Fed adopted explicit forward guidance that it intended to leave its policy rate low for long in August 2011. This anchor even held after the Fed switched from its date-based paradigm to the current unemployment threshold last December. That is, until recently.There may be technical factors at play in this surge, but it could also be a worrisome sign that the Fed’s forward guidance that has signaled a funds rate near zero until well into 2015 may be losing credibility.
Actually, the Fed can provide all of the forward guidance it wants. But if its actual policy actions, in contrast to its words, and the incoming economic evidence suggest that a prudent monetary policy should run counter to the Fed’s forward guidance, who are you going to believe – the Fed or your lying eyes? After years of observing the behavior of financial markets, I bet that you are going to conclude that your eyes are not lying and that you will make portfolio adjustments accordingly. After you and other market participants have altered your portfolios in accordance with reality, the Fed will eventually will alter its guidance.
Here : what forward guidance is and what it means.
A Post-ECB Reminder On The ‘State’ Of Europe
The risks surrounding the economic outlook for the Euro area continue to be on the downside…the key ECB interest rates to remain at present or lower levels for an extended period of time. – Mario Draghi
September 22 is the date for the German Elections. All of Europe and the IMF are keeping their heads down, playing nice and saying very little until this date comes and goes. No one wants to upset the chances of Ms. Merkel’s re-election. Pouring forth from all of the nations on the Continent, like a Preacher with the “Good News,” is the notion that Europe is over the recession, that every country is doing just fine and that all problems have been solved.
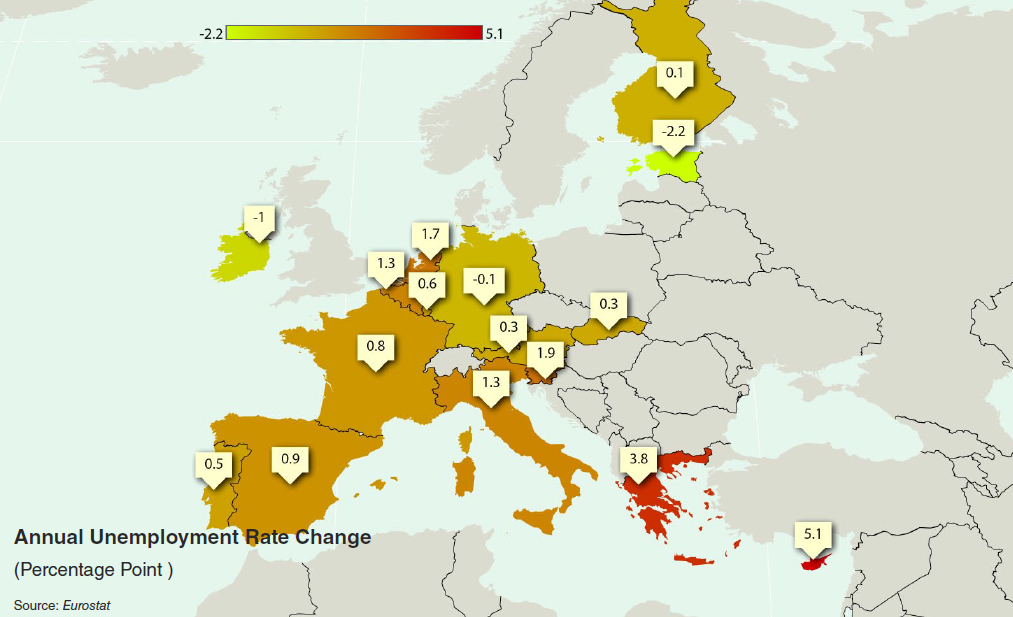
Much has been made of the survey-based self-referential PMI improvements in the Euro-Area in recent months. However, top-down GDP hardly resonates with this ‘confidence inspiring’ expansion data and global import improvements remain sadly lacking. There is, however, one indicator of economic health that has consistently represented the reality of life on the ground on Europe… and, it is getting worse not better. As the following map shows, unemployment rates are rising in almost every European nation.
The rise of unemployment YoY across the Euro-Zone…
EM : Have we Seen the Bottom Out ?
In the last week, emerging markets saw the largest equity outflow in 10 weeks, losing a total of $4.4 billion. Over the past three months, $60 billion flowed out of emerging markets.
Bank of America Merrill Lynch strategists Michael Hartnett and Brian Leung noted three historical episodes in which emerging markets outperformed after massive draw-downs. There is just so low the markets can go; at some point, they start to pick up:
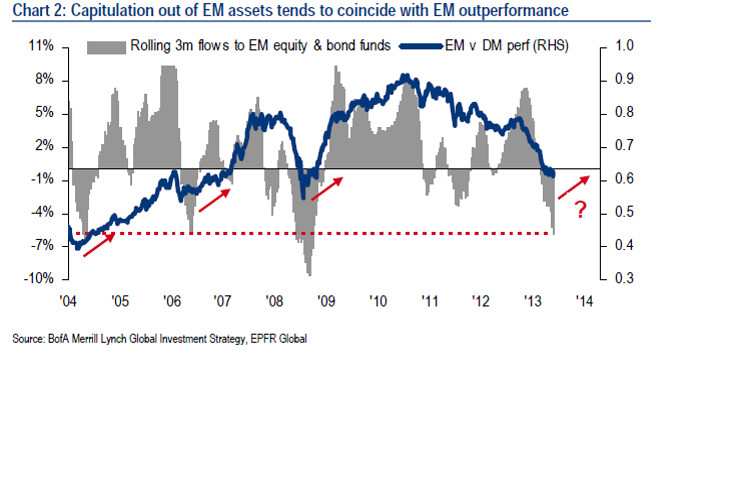
I would not quite go there yet. Emerging markets definitely have structural issues that global investors chose to ignore for years but are focusing on right now. But there may be pockets where value and momentum are emerging. See our latest report here
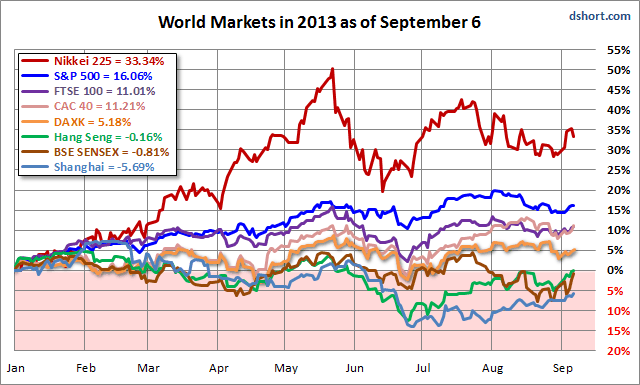
Equities: Risk appetites revived this week on positive activity data and easing fears of an imminent US strike on Syria with a strong rebound for the major world indexes. All eight finished with gains, the first time that’s happened since the week ending on July 12. However, stocks were spooked a bit on Friday by Russian and Iranian saber-rattling.
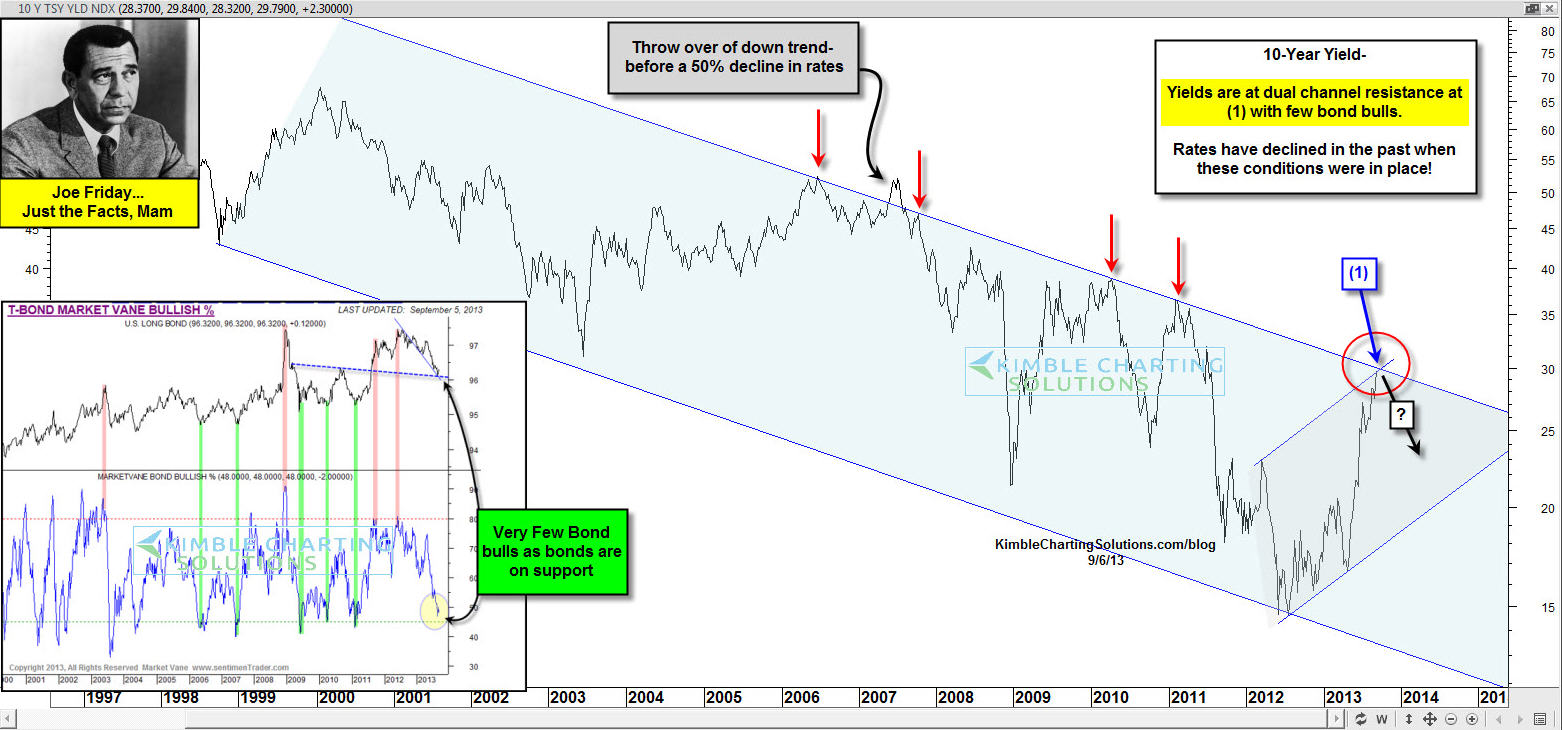
Bonds: Rates resumed their rise on upbeat data and waning safe haven demand. US and UK 10-year yields flirted with breaching 3.00% for the first time in two years, double the cycle low. German 10-years breached 2.00% from a low of 1.16%. This year’s Fed taper-talk came at a time when many investors were simultaneously concerned about future inflationary prospects, and yields have consequently jumped as a result of an exodus from longer dated bonds. Yields are rising and will test resistance levels. If resistance levels hold, then perhaps we must continue to wait for the long anticipated next bear market for bonds. On the other hand, if yields blast out of these bearish secular trend channels, then perhaps the bond bubble prognosticators will be vindicated, even if they were a bit early.
Dual multi-year channel resistance comes into play in the 10-year rate at (1) in the chart below. Since last summer, the rally in yields has been brutal to the price of bonds, as the yield on the 10-year notes is up 100%!
The majority of the time, bonds have rallied in price/yields have declined when at the top of this channel and few investors were bullish bonds.
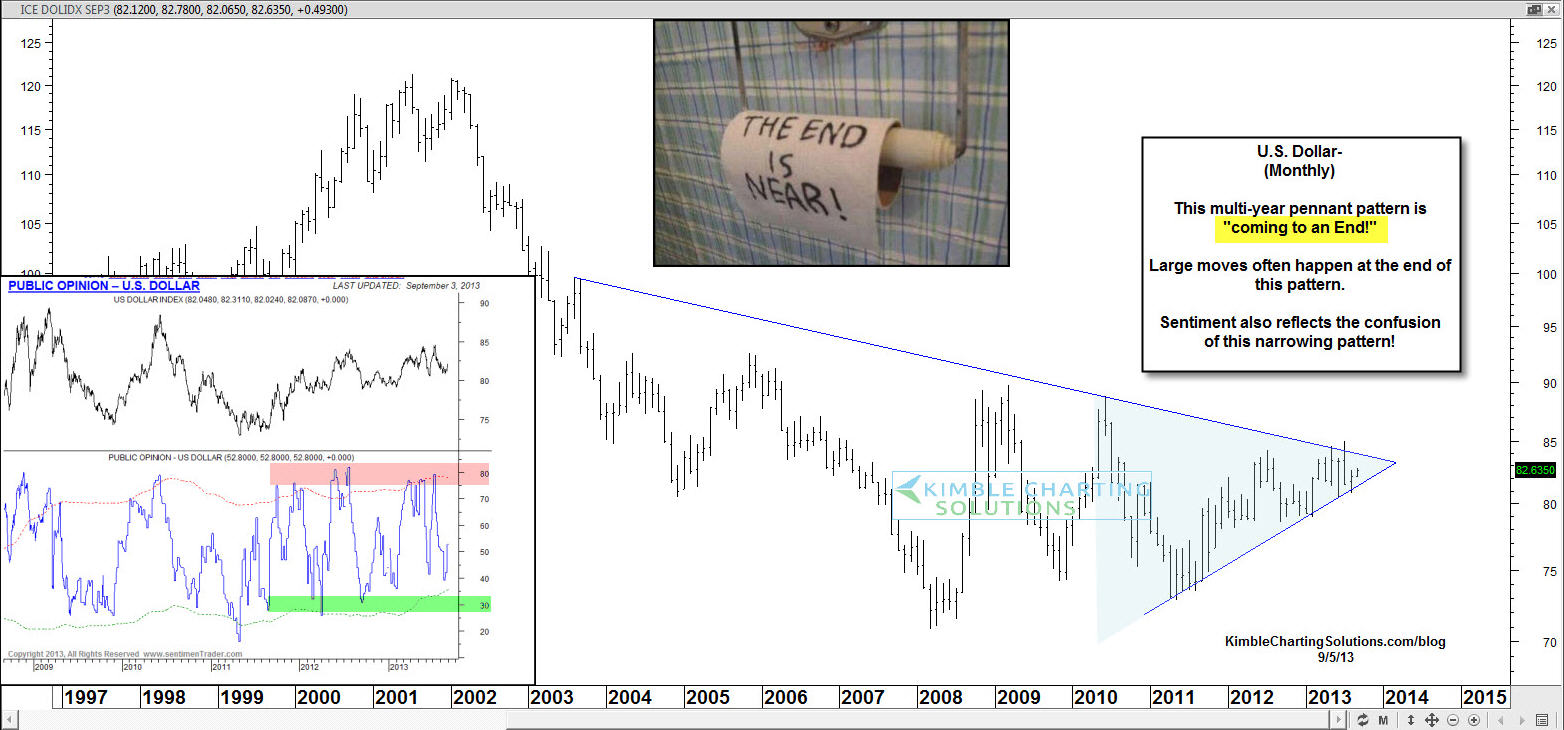
Currencies: EUR was offered on dovish ECB comments. AUD caught a bid as the RBA signaled no further cuts. The U.S. Dollar has been trapped inside a multi-year pennant pattern that continues to narrow, frustrating both bulls and bears, due to lack of movement or conviction.
The End of the pattern is near!
This pattern doesn’t usually tip its hand on the outcome/direction of the next big move, yet it usually pays to follow the breakout/breakdown. With the U.S. Dollar being trapped for so long, the “ending of this pattern” could send important messages for portfolio construction for the upcoming months.
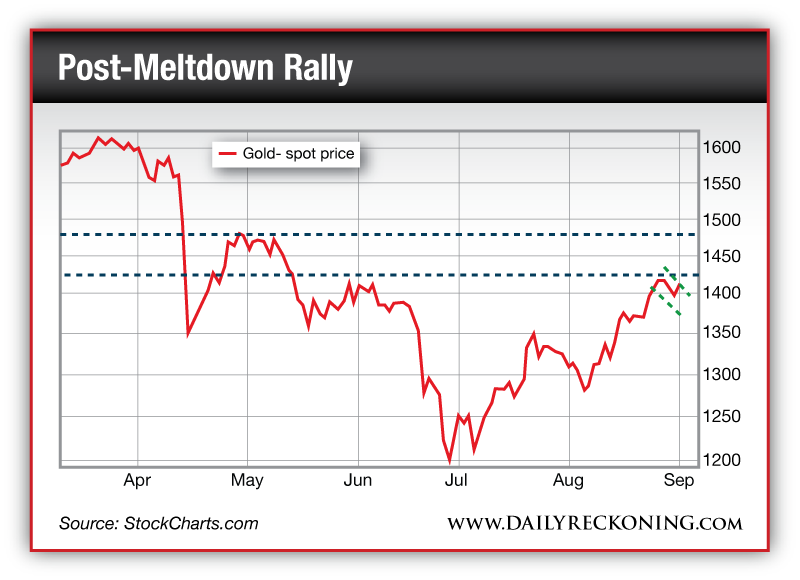
Commodities: Oil and gold were lower as fears of an imminent US strike in Syria receded. But jitters keep oil elevated. Gold is now just below $1,395. For the past five trading sessions, gold has slowly trended lower. It’s consolidating just below $1,425. So if you’re a fan of the rally off its July lows, you should be encouraged by this action. – See Below –
GOLD UPDATE
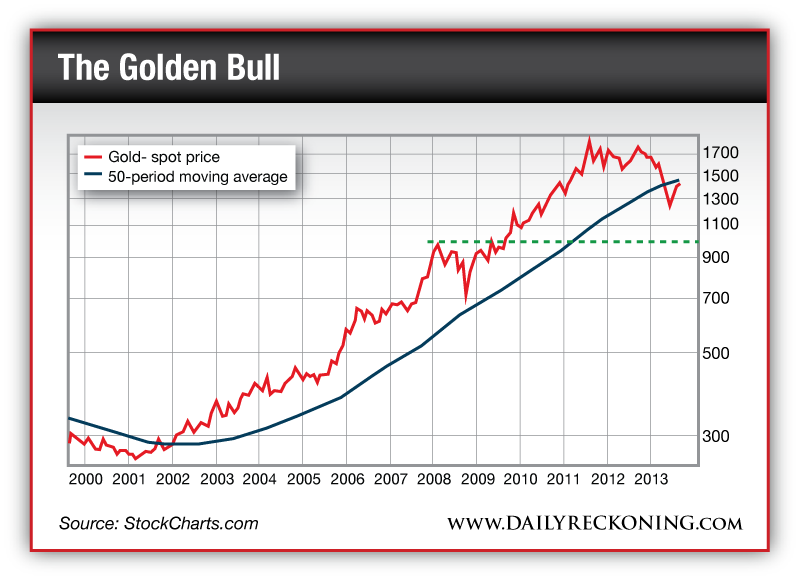
Right now, gold is approaching an important trading zone. If it successfully penetrates $1,425, all of the damage it has endured since mid-May will be repaired. if you want to truly understand how important this trading zone has become for gold, you have to view gold’s entire bull market over the past decade…
Gold lost the mammoth uptrend that guided it to gains since 2002. Now, gold is approaching a point where it could attempt to challenge its 50-period moving average. If it fails again near $1,450, I expect the metal to continue its downtrend, ultimately landing somewhere between $1,100-$1,000. That would allow a complete retracement of 2010-2011 push toward $2,000.
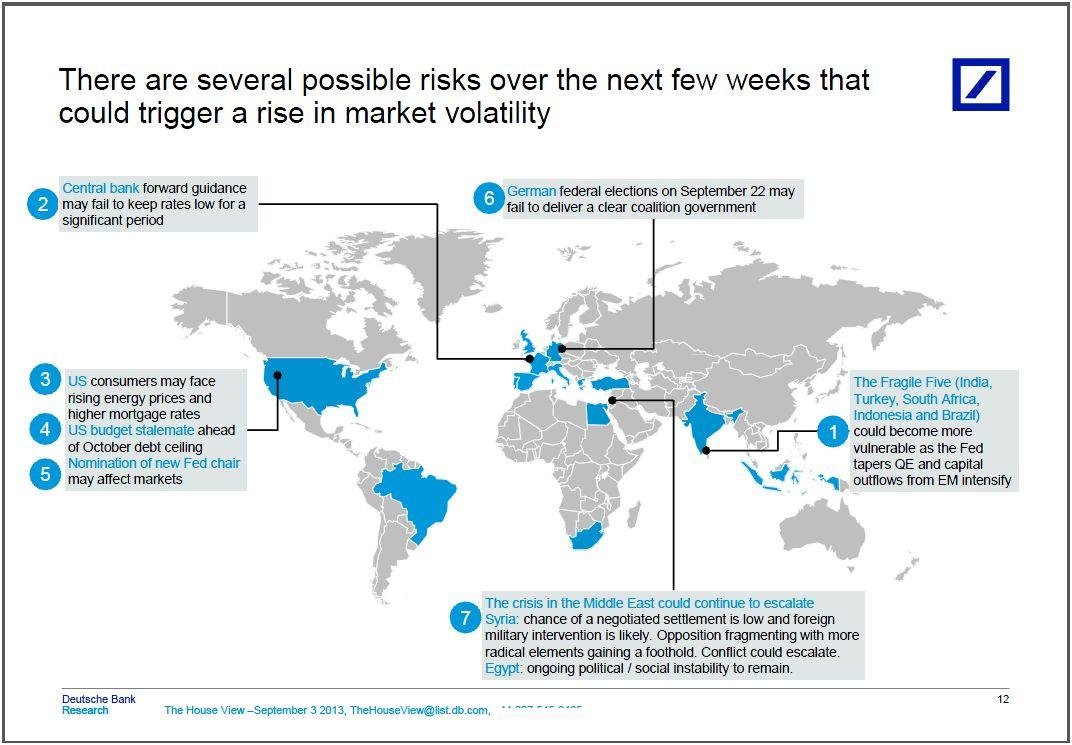
What could trigger a rise in volatility (a quick view)
Click on graph to enlarge it
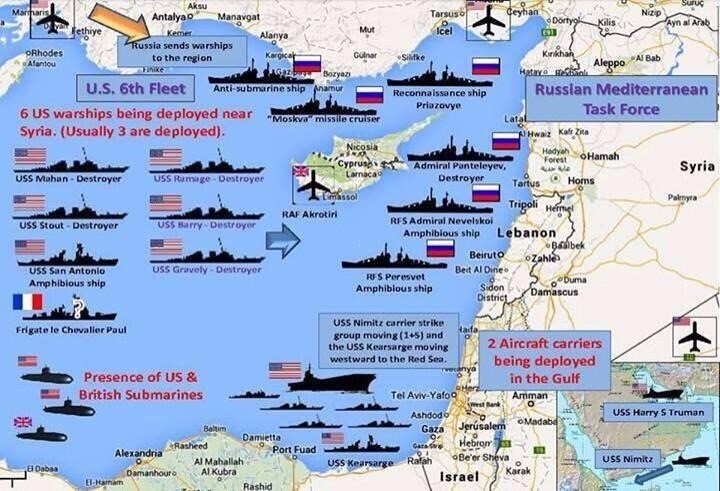
As per today we update the most recent map of US and Russian naval deployments in the Mediterranean surrounding Syria. Over the weekend, things appear to have heated up once more as yet more ships – mostly of Russian origin – arrive in what is rapidly becoming a formation in search of the tiniest provocation.


