

Sell In May and Go Away ?
April, 29 2024
Investing allows us to build a bridge of well-thought out and time-tested assumptions, but we always need to take a ‘leap of faith’ between what is known and what will actually come to be. – Peter Lynch

What a difference a week can make! After posting its worst weekly performance in over a year last Friday, the S&P 500 rebounded this week to score its best performance since October 2023. The rise was primarily driven by a surge in technology stocks and other growth sectors.
The Magnificent 7 as a percentage of the S&P 500 continues to hit new all time highs. The four to have reported so far include Microsoft Corp. and Alphabet Inc. (ahead of expectations and rewarded with a big rise in the share prices), Tesla Inc. (disappointing, but the market rallied anyway), and Meta Platforms Inc. (punished for missing expectations). Alphabet and Microsoft convinced investors that their huge AI bets are already paying off.
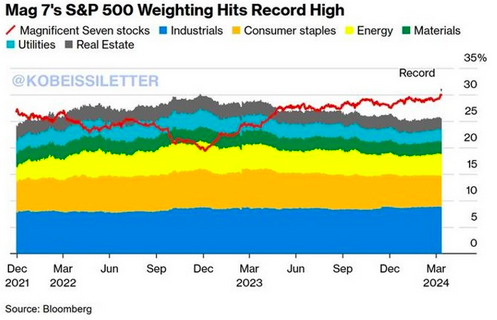
These Mag-7 stocks now account for 31% of the entire S&P 500 index. Their share is larger than the Industrials, Consumer Staples, Energy, Materials, Utilities, and Real Estate sectors combined. The top 10% of stocks in the S&P 500 now reflect a record 75% of the index.
Over the past two weeks, indices, particularly in the US, have begun to consolidate some of the gains made since October 2023. Market participants received a bit of a reality check in the form of economic data on GDP and core PCE that pointed to stalling growth and sticky inflation, blurring visibility on the first rate cuts. First-quarter inflation came in well above expectations at +3.7% vs. 3.4%, while seasonally-adjusted PCE Core index for March was even more so: it came in at +2.7%, compared with +2.6% expected and 2.50% in February. GDP growth was limited to +1.6% vs. a forecast of 2.5%.
The 10-year U.S. Treasury yield ended the week near its highest level in almost six months having reached 4.73%.
STOXX Europe 600 Index snapped a three-week losing streak and ended 1.74% higher as some encouraging corporate earnings results helped to boost sentiment. The Nikkei 225 Index gained 2.3% while the yen continued to collapse (160).
AHEAD : An important test for the Fed
In the US, the March unemployment rate will be announced on Friday. But it is the interest rate policy statement from the FOMC that will be watched closely for any verbiage changes, futures trading implying a 97% probability that interest rates will be kept at their current levels. Fed Chairman Jerome Powell’s Q&A will also be closely watched for any hints on when the Fed might consider its first rate cut of the cycle.
The first estimate of European inflation for April will be available on Tuesday.
In corporate earnings, major reports are due from a wide range of companies across sectors, including ConocoPhillips, Pfizer, Coca-Cola, McDonald’s and Starbucks. Apple and Amazon wrap up reports from the Magnificent 7. And in Europe : Novo Nordisk, HSBC, AXA, Stellantis, GSK and Shell.
Markets : “Buy the dip” or “sell the rally”?
Should you “sell in May”? Probably not. But here are some reasons to be cautious about stocks. -check our article here –
The past 5.5% dip has been caused by several factors, including the escalating geopolitical concerns, the Fed’s hawkish pivot, and a possible unfolding bubble burst in AI-themed stocks. Despite the rather gloomy outlook on the economy, investors have been exceedingly bullish about the stock market since November.
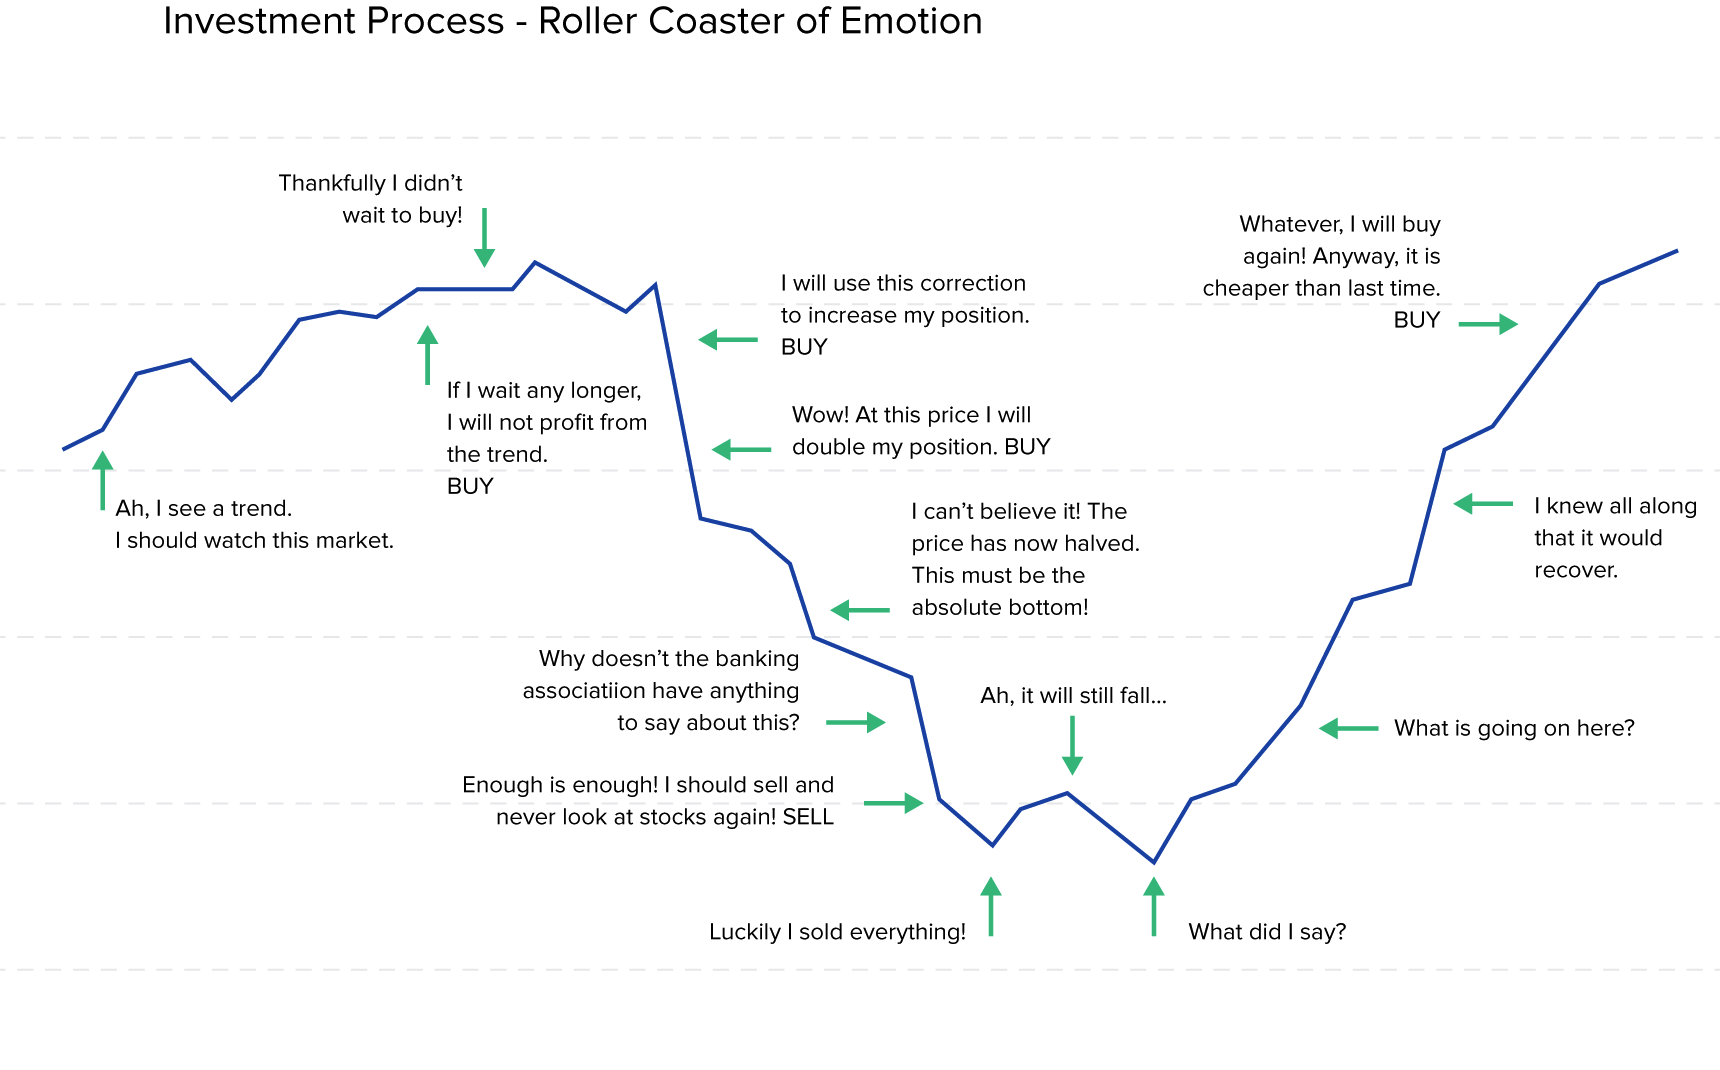
Now, in hindsight, investors are experiencing, as we today say —FOMO — “fear of missing out!”
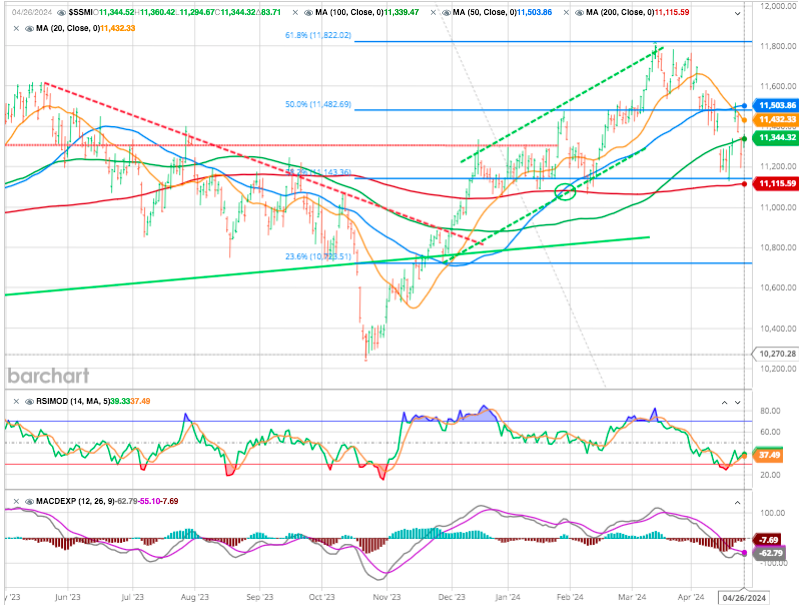
April market decline remained quite orderly. This week the initial resistance of the 50-DMA could prove challenging. With the number of bullish investors who got trapped in the selloff, any rallies will likely be met with further selling.
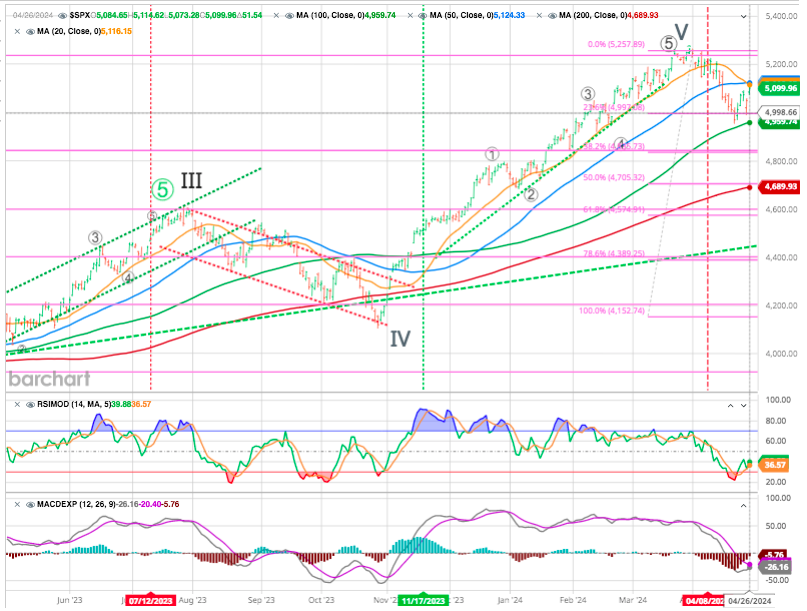
Our technical indicators are still suggesting a mid-term downtrend.
The rebound in stocks, when there would have been ample justification to keep selling, suggests that there may not be enough bearish sentiment to take the selloff further. For the longer term, the extreme reliance on a few monopolistic platforms is disquieting
Bloomberg’s earnings expectation service shows that blended forecast and actual first quarter earnings are 58.1% higher than at their nadir in November 2022. Meanwhile, the 493 companies in Bloomberg’s Large-Cap 500 Excluding Magnificent Seven index are on course to come in 8.4% below the estimate from that same date.
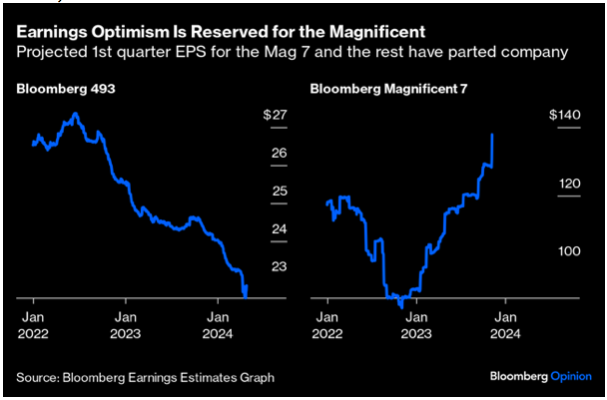
Consensus estimates call for the Mag 7’s earnings to soar 36.9% in 2024 versus 1.0% for the other 493 companies.
That is very deep reliance on a small group of companies, all of which are well-entrenched but vulnerable in various ways to changing political currents.
How sustainable are these earnings, and to what extent are they being made at the direct expense of other large companies?
as reported by Gina Martins from Bloomberg Intelligence :
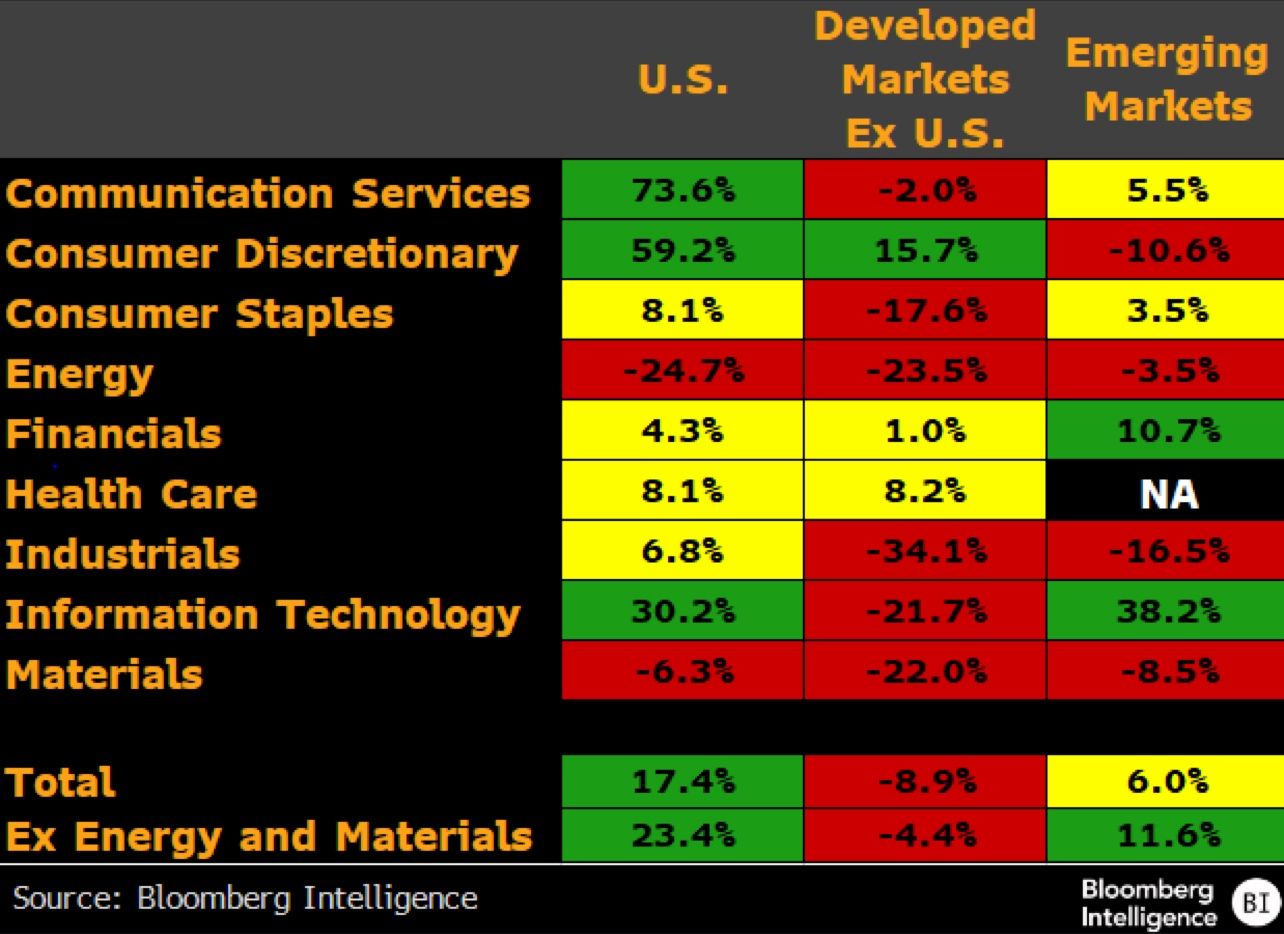
US bellwethers are expected to post earnings growth exceeding 17% year over year — as the rest of the developed markets may contract and emerging markets deliver just 6% growth. Bloomberg Intelligence’s global bellwether index contains 128 of the globe’s largest equities that make up at least half of each regional sector’s market cap and have a value of at least $35 billion. US bellwethers are thus far leading the world’s 1Q earnings growth in every sector except financials and tech, where emerging markets lead, based on reported or consensus estimate earnings.
Bear markets are notorious for bear market rallies – and thus very difficult to navigate. It seems like we could be entering a counter rally, but this will be an opportunity to sell.
Revive hopes for a July cut and push interest rates lower, and if combined with the S&P 500 rising above the 50 dma resistance – could crush the bear thesis.
As questioned by Lance Roberts : “Is rally early this week that reflexive rally that leads to a better entry point for investors, or is it a “sucker rally” leading to a more profound decline.”
Japan
Market benefit from the weak yen. But it could emerge as a exchange rate war as China might want to devaluate the yuan further. The Yen is in free-fall and markets wonder if there’s a red line. There isn’t.

Emerging Markets trading at 50 lows vs developed markets
The steady decline in the relative value of emerging markets following WWII was the result of the rapid growth of North America and the rebuilding of Western Europe, which lasted until the very late 1960s.
The upsurge in inflation and commodity prices benefited emerging markets in the 1970s because many of their economies often have a large natural resource component.
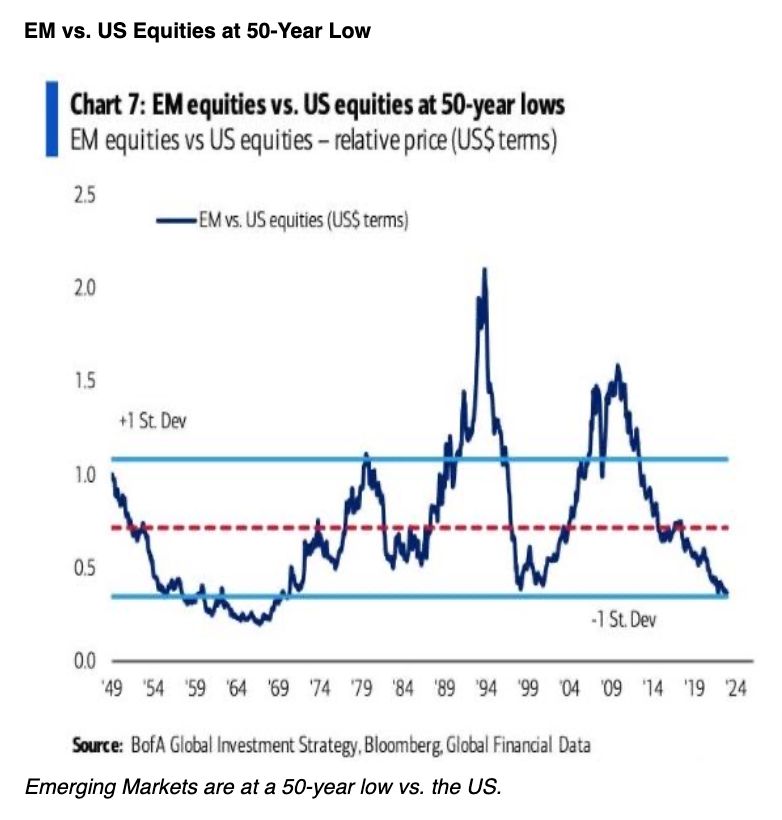
Emerging markets saw a sharp rally after the dip following the bursting of the Internet Bubble at the turn of the century following the 2008 financial Crisis when commodities experienced a rally.
The current low point in relative valuation is due to the conspicuous strength of the U.S. market and the most troubled geopolitical environment since WWII.
The connected nature of markets means that several factors must converge to produce an emerging market rally. That has yet to occur, but we feel that many emerging markets will offer investors tremendous risk/reward opportunities.
China
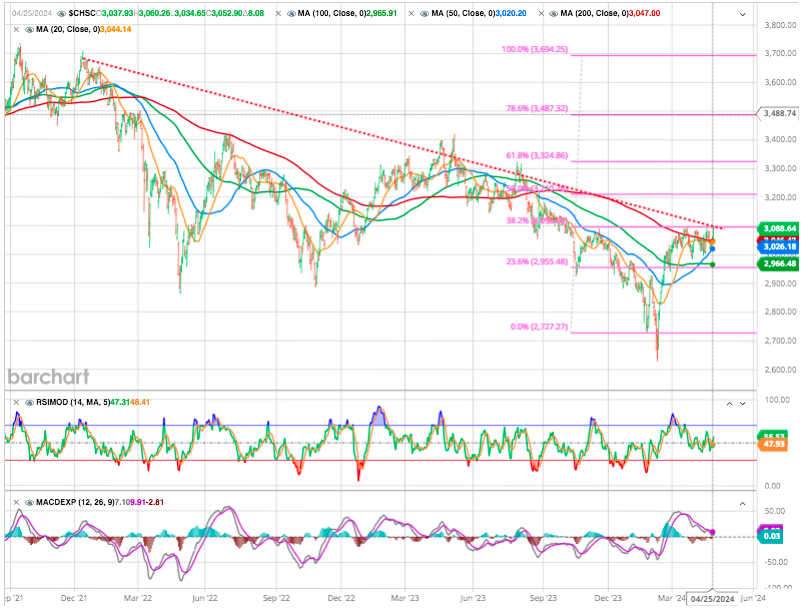
Chinese stocks -Shanghai Composite Index- are trying their to break the upper end of their downtrend channel again. the most recent in a long series. Is this time lucky?
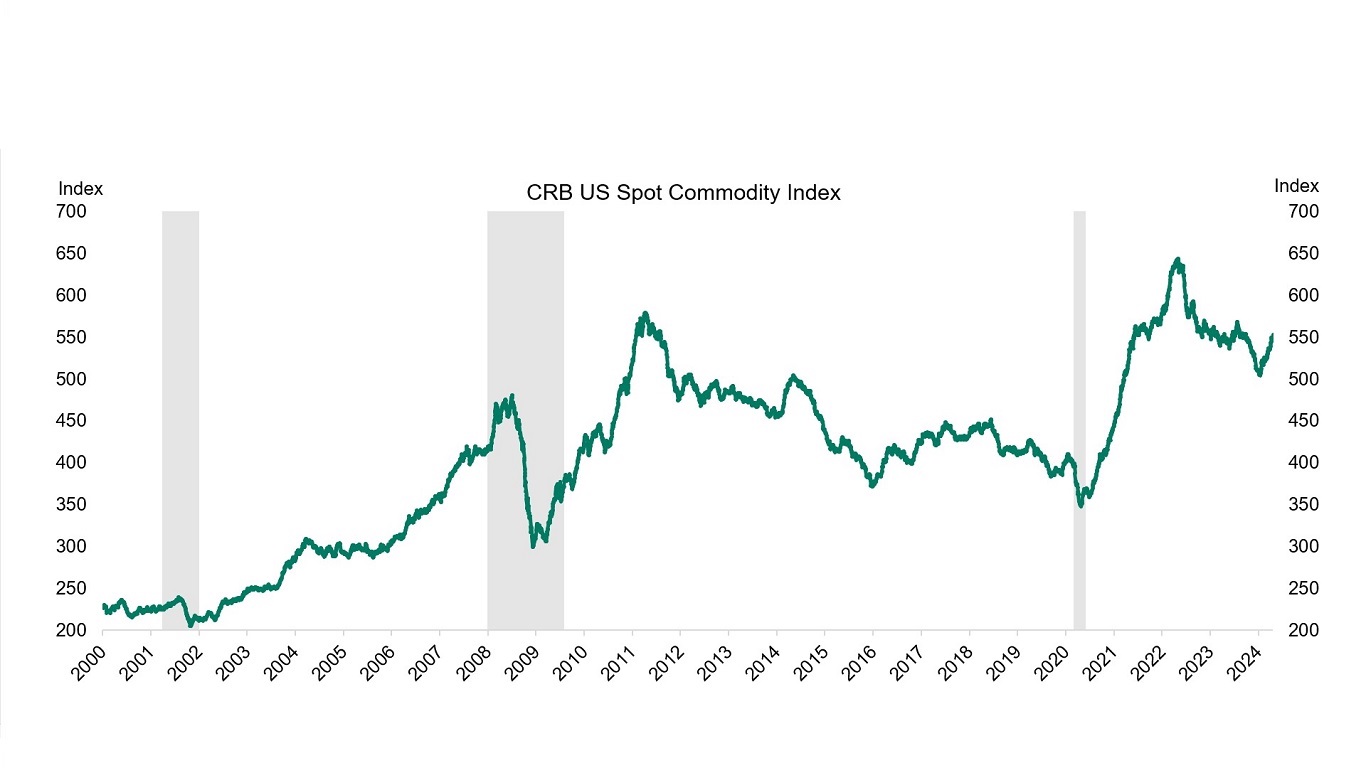
Commodities
Commodity prices are moving higher driven by the following: 1) Reaccelerating US growth 2) Geopolitical uncertainty 3) Segmentation of global trade, and 4) Strong AI demand for energy.
Happy trades
BONUS
Cocoa futures prices have rallied sharply over the past year.
And the rally has really heated up over the past 3 months.
Today we look at a “monthly” chart of Cocoa to highlight this rare and sharp rally.
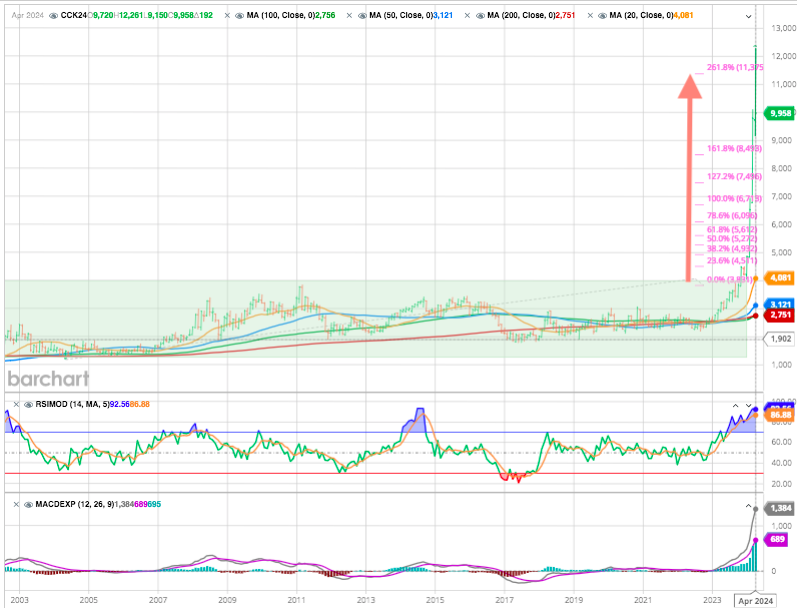
As you can see, hot Cocoa has gained 100% quickly after breaking out of a 20-year sideways trading pattern. The strong rally has it testing its 261.8% fibonacci extension level this month.