MARKETSCOPE : The Bear Season : Episode III
March, 07 2022
Investors are Holding their Breath
 Volatility persists in a very tense geopolitical context. Uncertainty grows as a terrible scenario in Eastern Europe unfolds. The sanctions imposed by the West have had a significant impact not only on investors in Russian companies, but also on companies and countries with interests in the countries affected by the war.
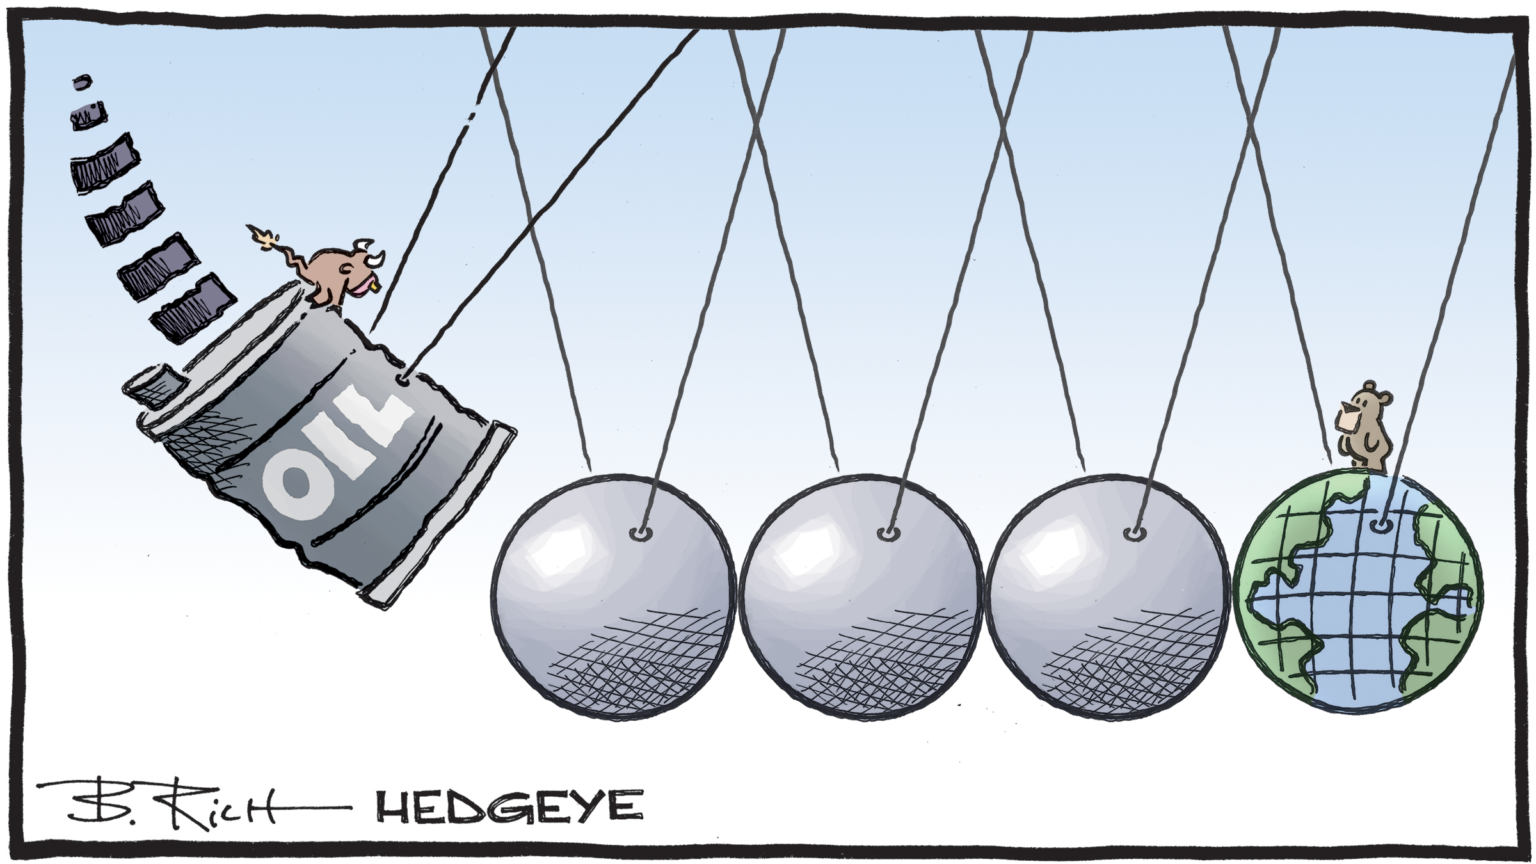
Of course, the tensions between Ukraine and Russia, being two of the largest producers of energy and raw materials in the world, have had an undeniable impact on both energy production and distribution.
The energy sector performed best, as oil prices soared as nearly USD 120 per barrel on Thursday before news of a possible Iran nuclear deal caused them to retreat a bit. The VIX index reached its highest point in over a year. The ruble plunged on international currency markets despite the Russian Central Bank’s move to raise the policy rate from 9.5% to 20%.

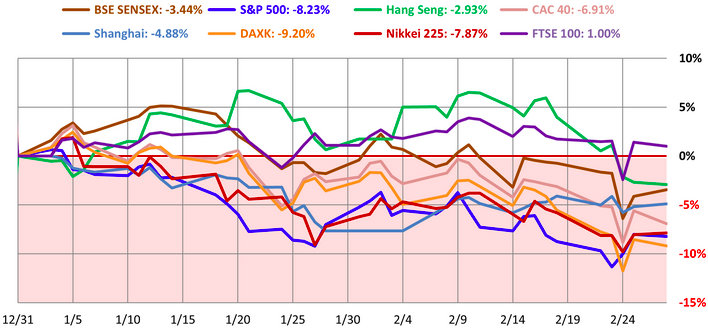
Market performances in 2022 s of Feb 28.
No one knows yet how long the war in Ukraine will last, but one thing is fairly certain: it is a source of considerable macroeconomic upheaval. We have already mentioned commodities in the broad sense. We can add to this the dollar, which has pushed the euro down to USD 1.0936, and Swiss franc to Parity to Euro in a logical move of risk aversion. The traditional safe-haven effect of the greenback was accentuated by the physical distance of the United States from the Ukrainian theater of operations.
Pessimism is gaining ground, investors are febrile and markets are naturally correcting. Caution is needed.
This typically Black Swan events will happen when you least expect and it hurts badly the markets and only exacerbate the trends already in place for several months such as inflation and slowing economic growth.
A critical support level for the market currently: October and January lows.
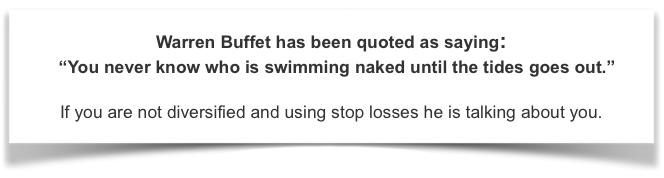
There are 2 ways to protect yourself against such an event and my advice is to always use both of them:
- Always have a diversified portfolio of 10 – 20 companies or ETFs of different individual stocks in different industries, sectors and countries
- Always have stop losses in place in case you are on vacation or have your eye off the ball for some other reason
Reminder: A Stop Loss isn’t the same as your sell point. The stop loss is usually much lower – We call it the maximum tolerance for pain
Commodities
 Commodity prices continue to soar. In this respect, it is interesting to take a look at the configuration of the futures prices of the main commodities (oil, copper, wheat etc.), which almost all have in common a so-called backwardation structure, i.e. cash prices (short maturity) higher than futures prices (longer maturity). End users are therefore willing to pay a high price to be supplied immediately, which perfectly illustrates the availability problems in certain sectors due to the boycott of Russian supply.
GOLD
Gold is back: rising uncertainty and inflationary pressures have proved to be a tailwind for gold. Following a period of underperformance, gold miners could also benefit from the current positive trend of the yellow metal.
As concerns grow, the ounce of gold is gaining momentum to slowly but surely move towards the USD 2000 mark. With rising inflation, geopolitical frictions and risk aversion, the planets are aligning for gold, which climbed to USD 1950, despite the rising greenback.
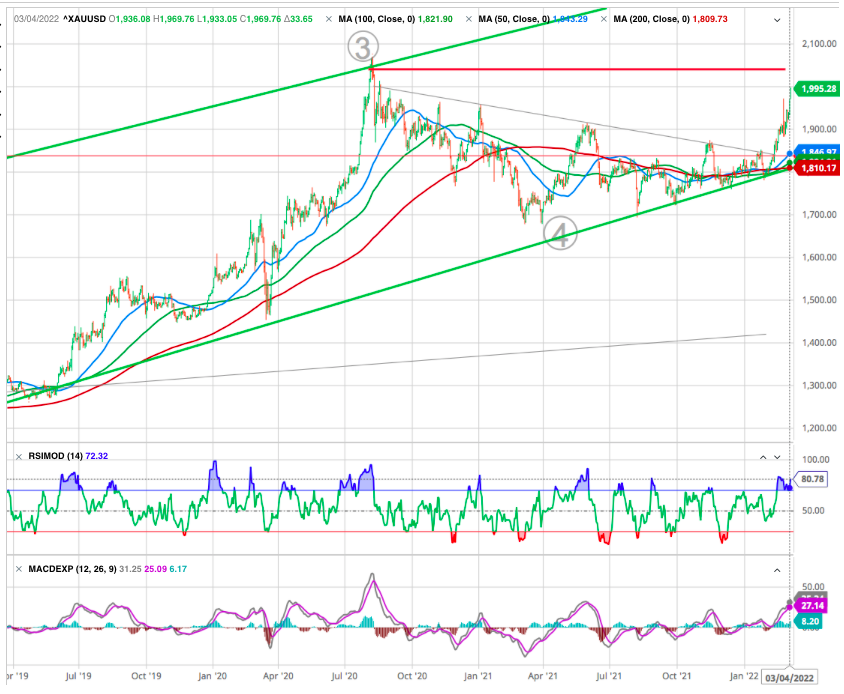
On the chart we can identify the start of the fifth wave of wave 5 which could lead to a target of USoz 2290 -once the resistance of 2034 removed-
Long-term gold bugs have generally been rewarded by the precious metal. Following the big rally from the mid-2000s to a then all-time high above $1,800 in 2011, gold languished for the better part of 7 years. Then, in November 2018, a new bull market for gold ensued, culminating in the all-time record just below $2,000 in July of 2020. It’s been mostly sideways since then with gold currently trading just above $1,900 per troy ounce. But could this be the beginning of a new bull market for gold?
- Gold is trading within striking distance of its all-time high near $2,000.
- Several factors, such as inflation and the war in Ukraine, appear to be behind gold’s recent momentum.
- History suggests gold prices could go higher.
However, the real star of the precious metals world is none other than palladium, whose price is returning to near its historic high (close to USD 3000). Remember that Russia accounts for one-third of the world’s palladium production.
Cryptocurrencies
Against this gloomy backdrop, the digital assets market jumped this week after Ukrainian Deputy Prime Minister Mykhailo Fedorov announced over the weekend that his government was accepting cryptocurrency donations to support the country in the face of Russian offensives. The Ukrainian government has reportedly received more than $50 million in crypto asset donations. In this context, the price of bitcoin has recovered last week but is now back to hovering around $38,000.
MacroEconomics
The February Manufacturing PMI registered 58.6 percent, an increase of 1 percentage point from the January reading of 57.6 percent. This figure indicates expansion in the overall economy for the 21st month in a row after a contraction in April and May 2020.
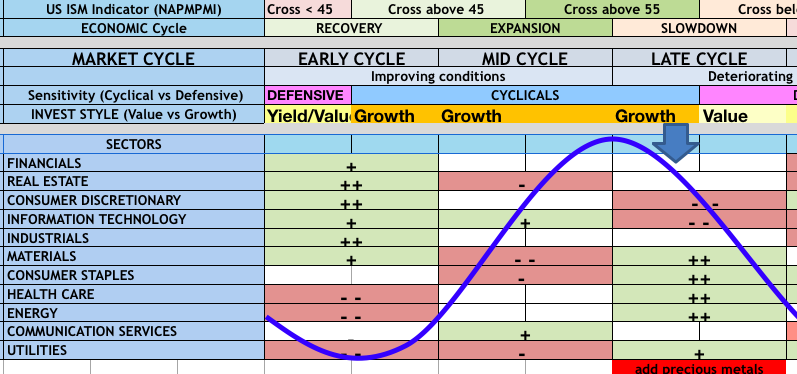
According to our ABS Matrix we are assisting to a continously trade off between Value and Growth as we hesitate to cleary enter into the early phase of the Late Cycle. But we surely will move aong the downside of the business cycle. We suggest to get positioned accordingly.
The New Orders Index registered 61.7 percent, up 3.8 percentage points compared to the January reading of 57.9 percent. The Production Index registered 58.5 percent, an increase of 0.7 percentage point compared to the January reading of 57.8 percent.
Meanwhile Federal Reserve Chair Jerome Powell, speaking before Congress last week, warned that Russia’s invasion of Ukraine will likely further magnify the high inflation already presents in the US. He also said he was inclined towards a 25 bp hike in March but remained open to more aggressive moves down the line.
The current commodity surge will once again trigger an economic slowdown. Commodity surges are equivalent to monetary tightening by reducing the consumptive power of Americans. However, when that commodity surge coincides with the Fed’s more aggressive monetary policy, the results will likely be disappointing. In other words, as the Fed hikes rates, a “hard landing” is almost assured.
However, as for the surge in economic growth following the pandemic-driven shutdown was, as stated, an artificial “sugar rush” of liquidity flooding the system causing a massive rise in money supply, leading to inflation, we might see that this turmoil will again force the governments to loose their monetary policy as it is the case in every war favoring some economic sector such as Defense and support the Consumers.
We focus our attention this week to two sectors :
-
Semiconductors : Make or break message to tech and broad markets???
Over the past two decades, it’s fair to say that semiconductor stocks have been an important part of the technology space. This is true from an investing and economic perspective.
The following chart romKimble solution looks at a long-term view of the ratio of the Semiconductor ETF to the Nasdaq 100 ETF to highlight semiconductor’s relative performance… and why it’s important to watch right now!
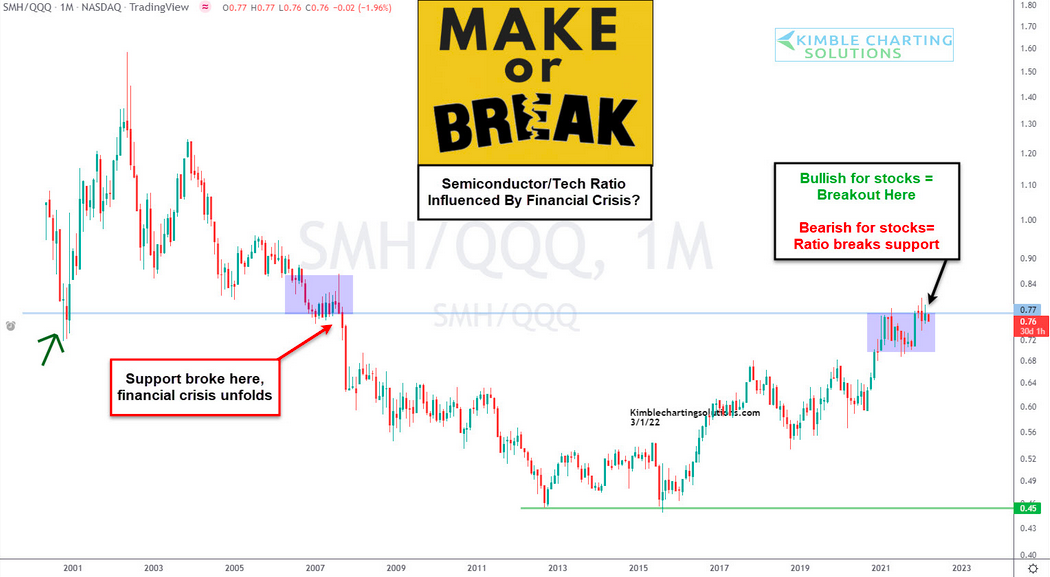
As you can see, semiconductors big disconnect and decline lower occurred during the financial crisis leading to under-performance through 2015. This was also a period of economic underperformance. Since then, the semiconductors have shown leadership in outperforming the Nasdaq 100. This has led to a rally back to (and briefly above) the key financial crisis breakdown area.
Seems like an important area for investors (and consumers) to watch. A breakout here = bullish for stocks/economy, while a breakdown here = bearish for stocks/economy.
-
Cybersecurity : How to deal with rising uncertainty?
 The race towards cybersecurity is one of them: cyberattacks have become more frequent and more complex than ever. Recent cyberattacks during the pandemic and the war in Ukraine have put again the cybersecurity industry under the spotlight.
As Russia hacked and adversely affected Ukraine’s tech abilities, within less than 48 hours, Musk launched thousands of satellites into orbit, restoring outages throughout Ukraine, drawing additional attention to the importance and need for cybersecurity measures.
Moreover, governments and corporates’ budgets assigned to cybersecurity are already planned to increase amid geopolitical tensions and rising threats from unfriendly groups of hackers. Against this backdrop, the interest for the cybersecurity industry has never been so high.
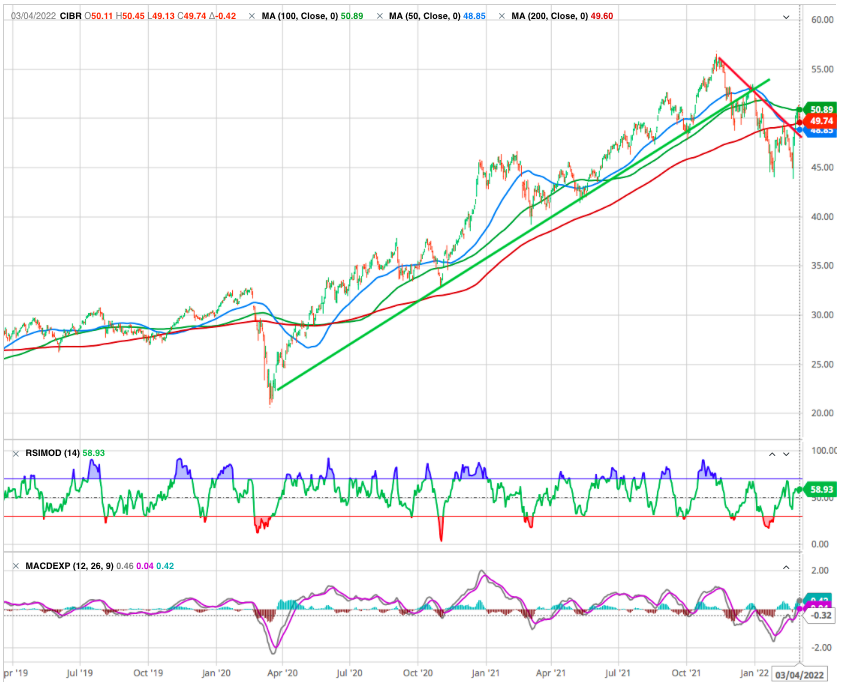
While the current environment offers a clear tailwind for the industry, the NASDAQ cybersecurity ETF is technically well oriented and displays significant upside on the short-term as it broke the short term downtrend line.
Cyberdefense protects and secures organizations that keep our communities functioning. It’s crucial to fortify vital information in financial institutions, hospitals, government agencies, work, etc. We rely on the critical infrastructure of these organizations to protect our identities from identity theft and losses. Companies like NortonLifeLock (NLOK), Palo Alto Networks (PANW), and Rapid7, Inc. (RPD) are necessary tools for protecting our future, as they detect suspicious activity and respond aggressively in the face of attacks.
STRATEGY
We don’t have a perfect crystal ball and its even hazier when it comes to events around wars. But from the point of sensible long-term investing, the following points are always worth bearing in mind in times of investment markets uncertainty like the present:
- Periodic sharp falls in share markets are healthy and normal, but with the long-term rising trend ultimately resuming and shares providing higher long term returns than other more stable assets.
- Selling shares or switching to a more conservative investment strategy after a major fall just locks in a loss and trying to time the rebound is very hard such that many only get back in after the market has recovered.
- When shares fall, they are cheaper and offer higher long-term return prospects. So, the key is to look for opportunities the pullback provides. It’s impossible to time the bottom but one way to do it is to average in over time.
- While shares have fallen, dividends from the market haven’t. Companies like to smooth their dividends over time – they never go up as much as earnings in the good times and so rarely fall as much in the bad times. And in the meantime, the income the dividends provide is still being received.
- Shares and other related assets bottom at the point of maximum bearishness, ie, just when you feel most negative towards them. >> SEE our BEAR MARKET ANATOMY
- The best way to stick to an appropriate long-term investment strategy, let alone see the opportunities that are thrown up in rough times, is to turn down the noise around the news and opinion flow that is now bombarding us.
Major Crisis Events Since 1940 and US Stock Market Returns
See table : according to an article by Dr.Shane Oliver at AMP Capital, there is a long history of major crisis events that impacted equity prices. In almost most of these cases, initially the stock market fell sharply only to rebound in the following months and years. Since World War II, the average decline for US stocks has been 6%. But six months later stocks were up by 9% on average. And the returns were even better after 1 year at around 15%.
The table shows major crisis events since World War Two in the first column, the period over which the US share market initially reacts in the second column, the percentage share market fall in the third column and the percentage change from the low over 3, 6 and 12 months in the final three columns.
To be clear, at first stocks go down on the initial shock of the event. Yet typically a month or so afterwards investors appreciate the bullish effects and a hearty bounce comes with outsized gains to follow.
Why?
Because military conflicts lead to massive increases in government spending which is positive for the economy.
Second, investors begin to realize there is very little net change to daily life. Especially in the US where folks continue to go to work…get paid…and spend all that money on products and services.
Stay Cautious and Happy Trades
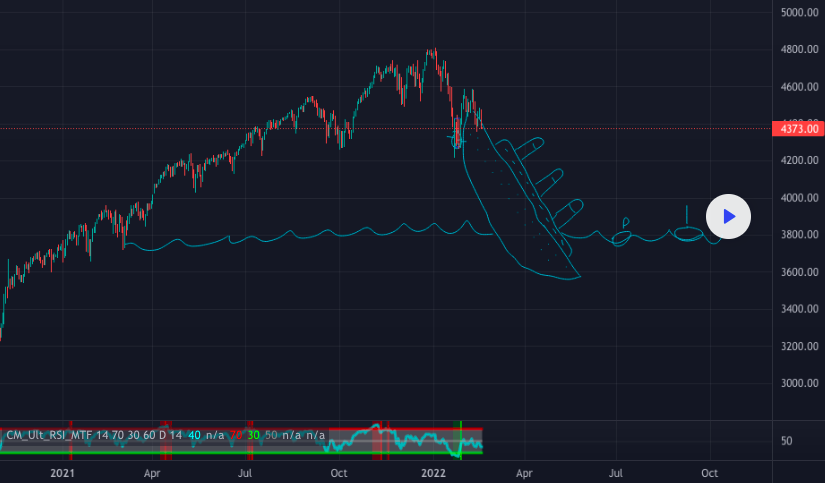
It appears to us we have entered a clear bearish sinking Titanic pattern with major lifeboat support coming in at around $3550.