

MARKETSCOPE : Waiting for Jerome …
January, 30 2023
Kinder, Gentler FED ?

Contrary to the main character of Samuel Becket’s play, we know that Jerome will meet us next Wednesday. So nothing much to expect before that ! While many market participants are hoping for a “kinder, gentler Fed,” that might not be the case.
The Federal Reserve is largely anticipated to fire off a 25-point rate hike to take the target federal funds rate to 4.50% to 4.75%. The consensus view is that the Fed will continue with its tightening policy and signal more rate hikes are still in the mix, as the transitory elements of inflation have come down, but the underlying problem of excessive stimulus remains.
 Stocks closed a winning week last Friday following data that pointed to stronger than expected U.S. economic growth. The Commerce Department said Friday the personal consumption expenditures price index excluding energy and food showed prices rose 4.4% from a year earlier, a day after reporting a better than expected 2.9% gain in gross domestic product for the fourth quarter, boosting hopes that the Federal Reserve may manage a soft landing. All the major market averages finished higher for the week.
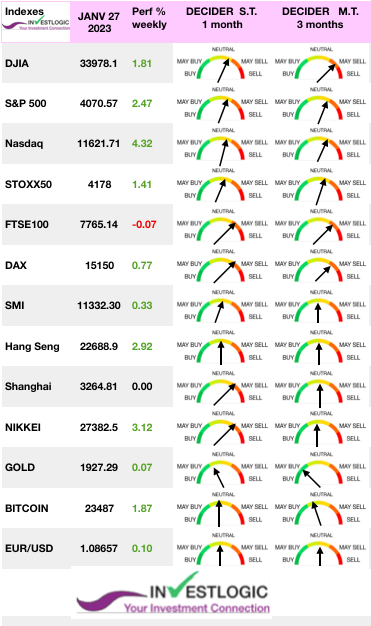
The outperformance of the U.S. technology index (SEE NASDAQ below) shows the extent to which investors have regained a taste for risk.
Consumer discretionary stocks were especially strong, thanks partly to a big jump in Tesla shares over the week following a favorable outlook, Tesla shares jumped 11% to cap a huge 33% surge on the week after reporting record quarterly revenue. Defensive sectors (consumer staples, health care, and utilities) lagged.
Earnings reports were again disappointing this week; Microsoft fell sharply after the company reported a larger-than-expected decline in earnings and a slump in revenues that it expects to continue into 2023. Other weak performers included IBM and Intel.
European shares rose as some encouraging economic data points helped to overcome concerns about the pace of monetary policy tightening.
MARKETS : The Bulls’ Revenge
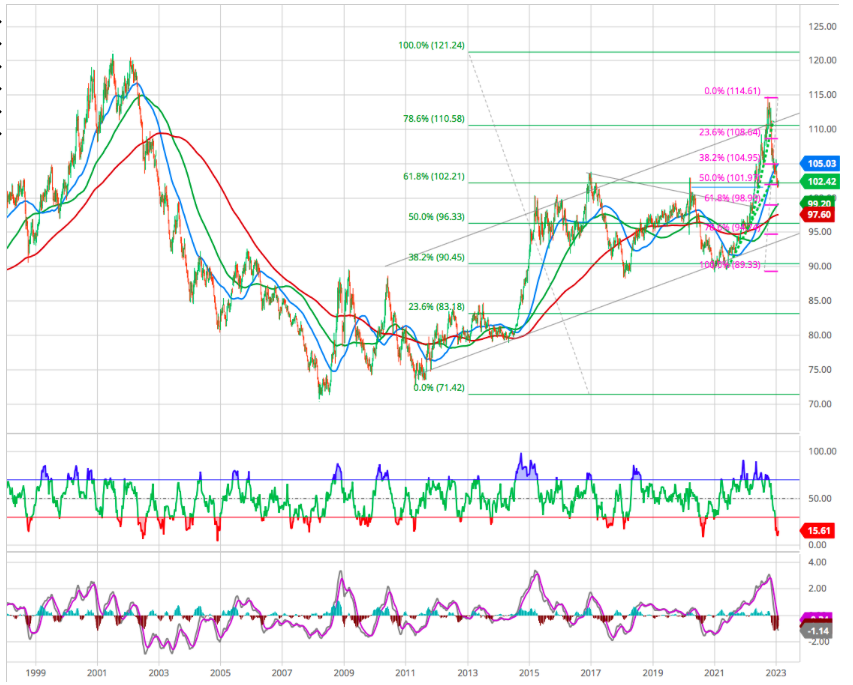
The S&P 500 has been on the verge of a breakout for several days. It finally overtook the 200-day moving average and the downtrend line that has been in place for nearly 10 months.
The index has closed above the big round resistance level of $4000 each of the past three trading days, but has yet to do it with conviction as it is heading toward a strong resistance around 4150.
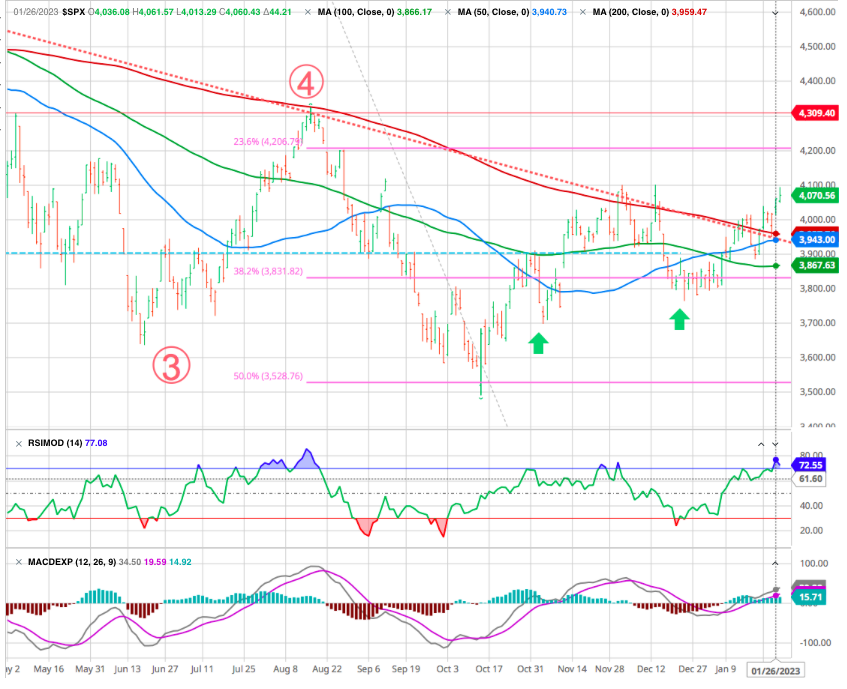
The compression of prices between the downtrend line from the January 2022 peak and the rising lows since October was an important focal point for investors. The objective now would be first to overcome the previous high (4075).
Furthermore, the market is not extremely overbought, and shorter-term moving averages are slopping positively. Notably, the 50-DMA is rapidly closing in on a cross above the declining 200-DMA. Such is known as the “golden cross” and historically signifies a more bullish setup for markets moving forward.
NASDAQ
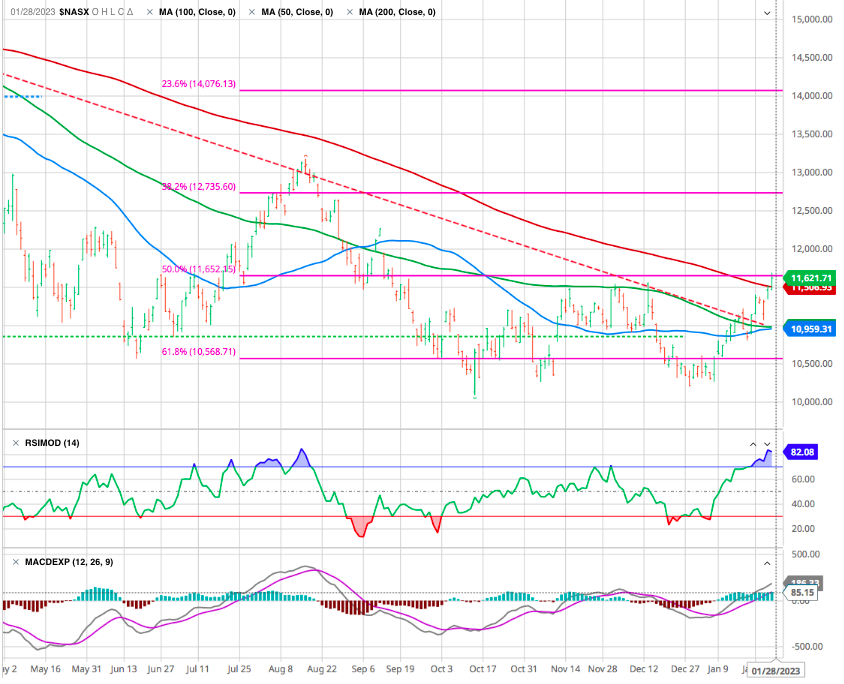
The recent technology recovery helped the index to finally break the 200 DMA and the downtrend line. It needs to be confirmed as we close the strong resistance at 11’650 (fibo 50 % downtrend).
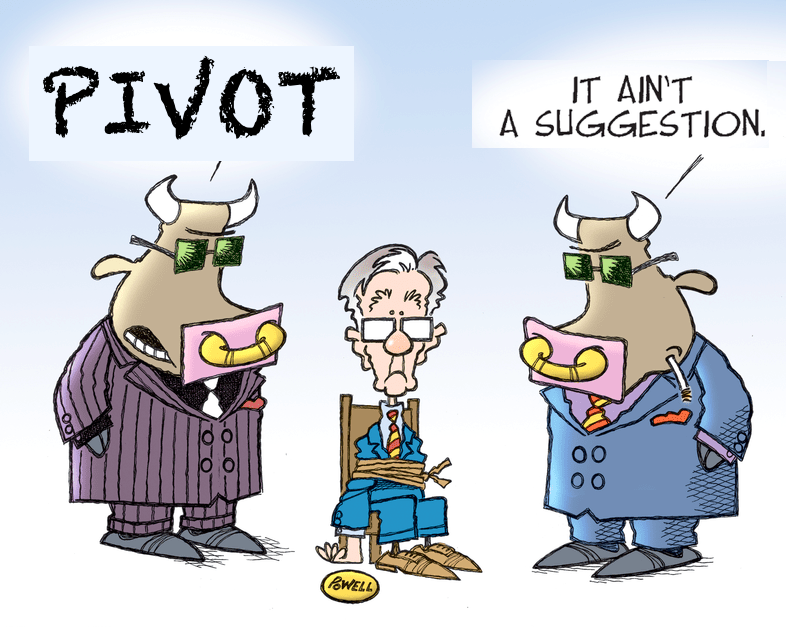
If investors see the Powell’s speech it as confirmation that the monetary tightening phase is coming to an end, they will likely be comforted in their bullish scenario.
Never the less, the goal of tighter monetary policy by the Fed is to tighten monetary conditions to slow economic growth, thereby reducing inflation. However, higher asset prices boost consumer confidence and loosen monetary conditions.
Therefore it will not be surprising to see Jerome Powell deliver a starkly hawkish message next week. Such was what Powell did following previous market rallies in September and December to push markets lower and tighten financial conditions. We discuss it below.
USD : Dollar Weakening? Buy Foreign Assets
See our INVESTMENT STRATEGY
US dollar cycles are long. The most recent appears unusually so relative to history, suggesting the recent change in direction may be more than temporary.
In 2022, the Fed’s rate hikes were more aggressive than other developed-market central banks. In the face of continued high inflation, foreign central banks will likely pick up the pace in their rate hikes. The result should be a tightening of the interest rate differential, putting pressure on the US dollar, likely continuing the pullback that started in December 2022.
 <
<
One can anticipate that the interest rate differential between the US and other developed countries will tighten in the coming months and years, prompting a continued dollar pullback.
The contrast between the situations in the United States and its developed-market counterparts indicates the chances are very good that the interest rate differential between the US and these countries will tighten in the coming months and years. A corollary to this is a likely dollar pullback and weakening against these nations’ currencies.
In a weakening dollar scenario, unhedged foreign stocks and bonds not only typically outperform, but are the only statistically reliable relative relationship we observe. The result should be a tailwind for unhedged foreign assets.
For complete article see Resarch Associates
Perverted Liquidity Conditions
As noted by Liz Ann Sonders, Chief Investment Strategist at Charles Schwab & Co., financial conditions have eased dramatically since October and back where they were last February (Bloomberg financial conditions index) when Fed Funds rates were zero %.
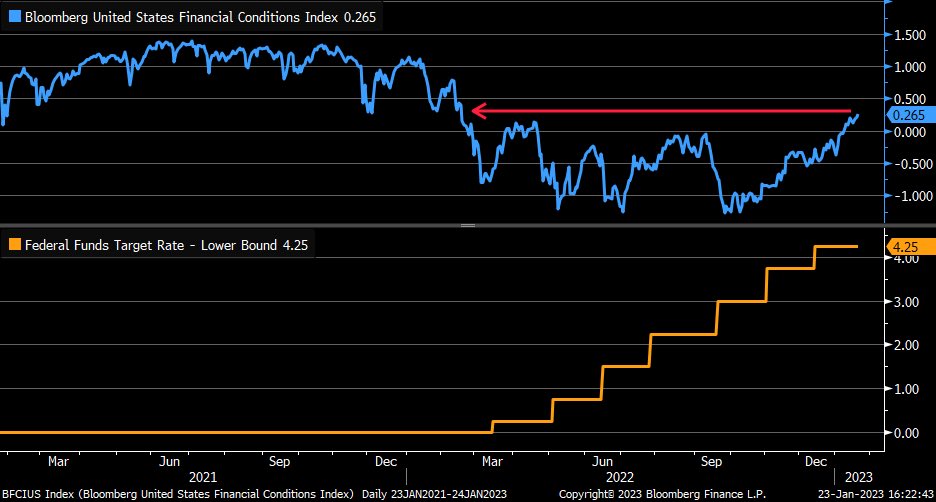
The Fed has been reducing the size of its balance sheet with QT since early last year. The SPX has roughly followed it lower.
However, the Fed’s monetary policy isn’t the only influence on financial conditions today. In recent years, two new factors have played an increasing role.
The first is what’s known as the Treasury General Account or “TGA.” In short when the Treasury increases the TGA – by issuing more debt and collecting more taxes than it spends – it reduces the amount of liquidity available to the financial system.
The second factor that has significantly influenced liquidity in recent years is the Fed’s Overnight Reverse Repurchase Agreement (ON RRP) Facility. The RRP is akin to a risk-free savings account for commercial banks and money market funds. The Fed pays these entities interest for keeping funds there.
Like the TGA, money held in the RRP represents money that isn’t available to the financial system. So, a rising RRP balance also reduces the amount of liquidity available, while a falling RRP balance increases it.
The RRP has officially been around since 2013. However, it didn’t become systemically important until mid-2021. That’s when the Fed began to pay significantly higher rates on RRP deposits as part of its plan to fight inflation.
Given these dynamics, subtracting the TGA and RRP balances from the Fed’s total balance sheet should give us a more accurate measure of actual liquidity conditions in the U.S.
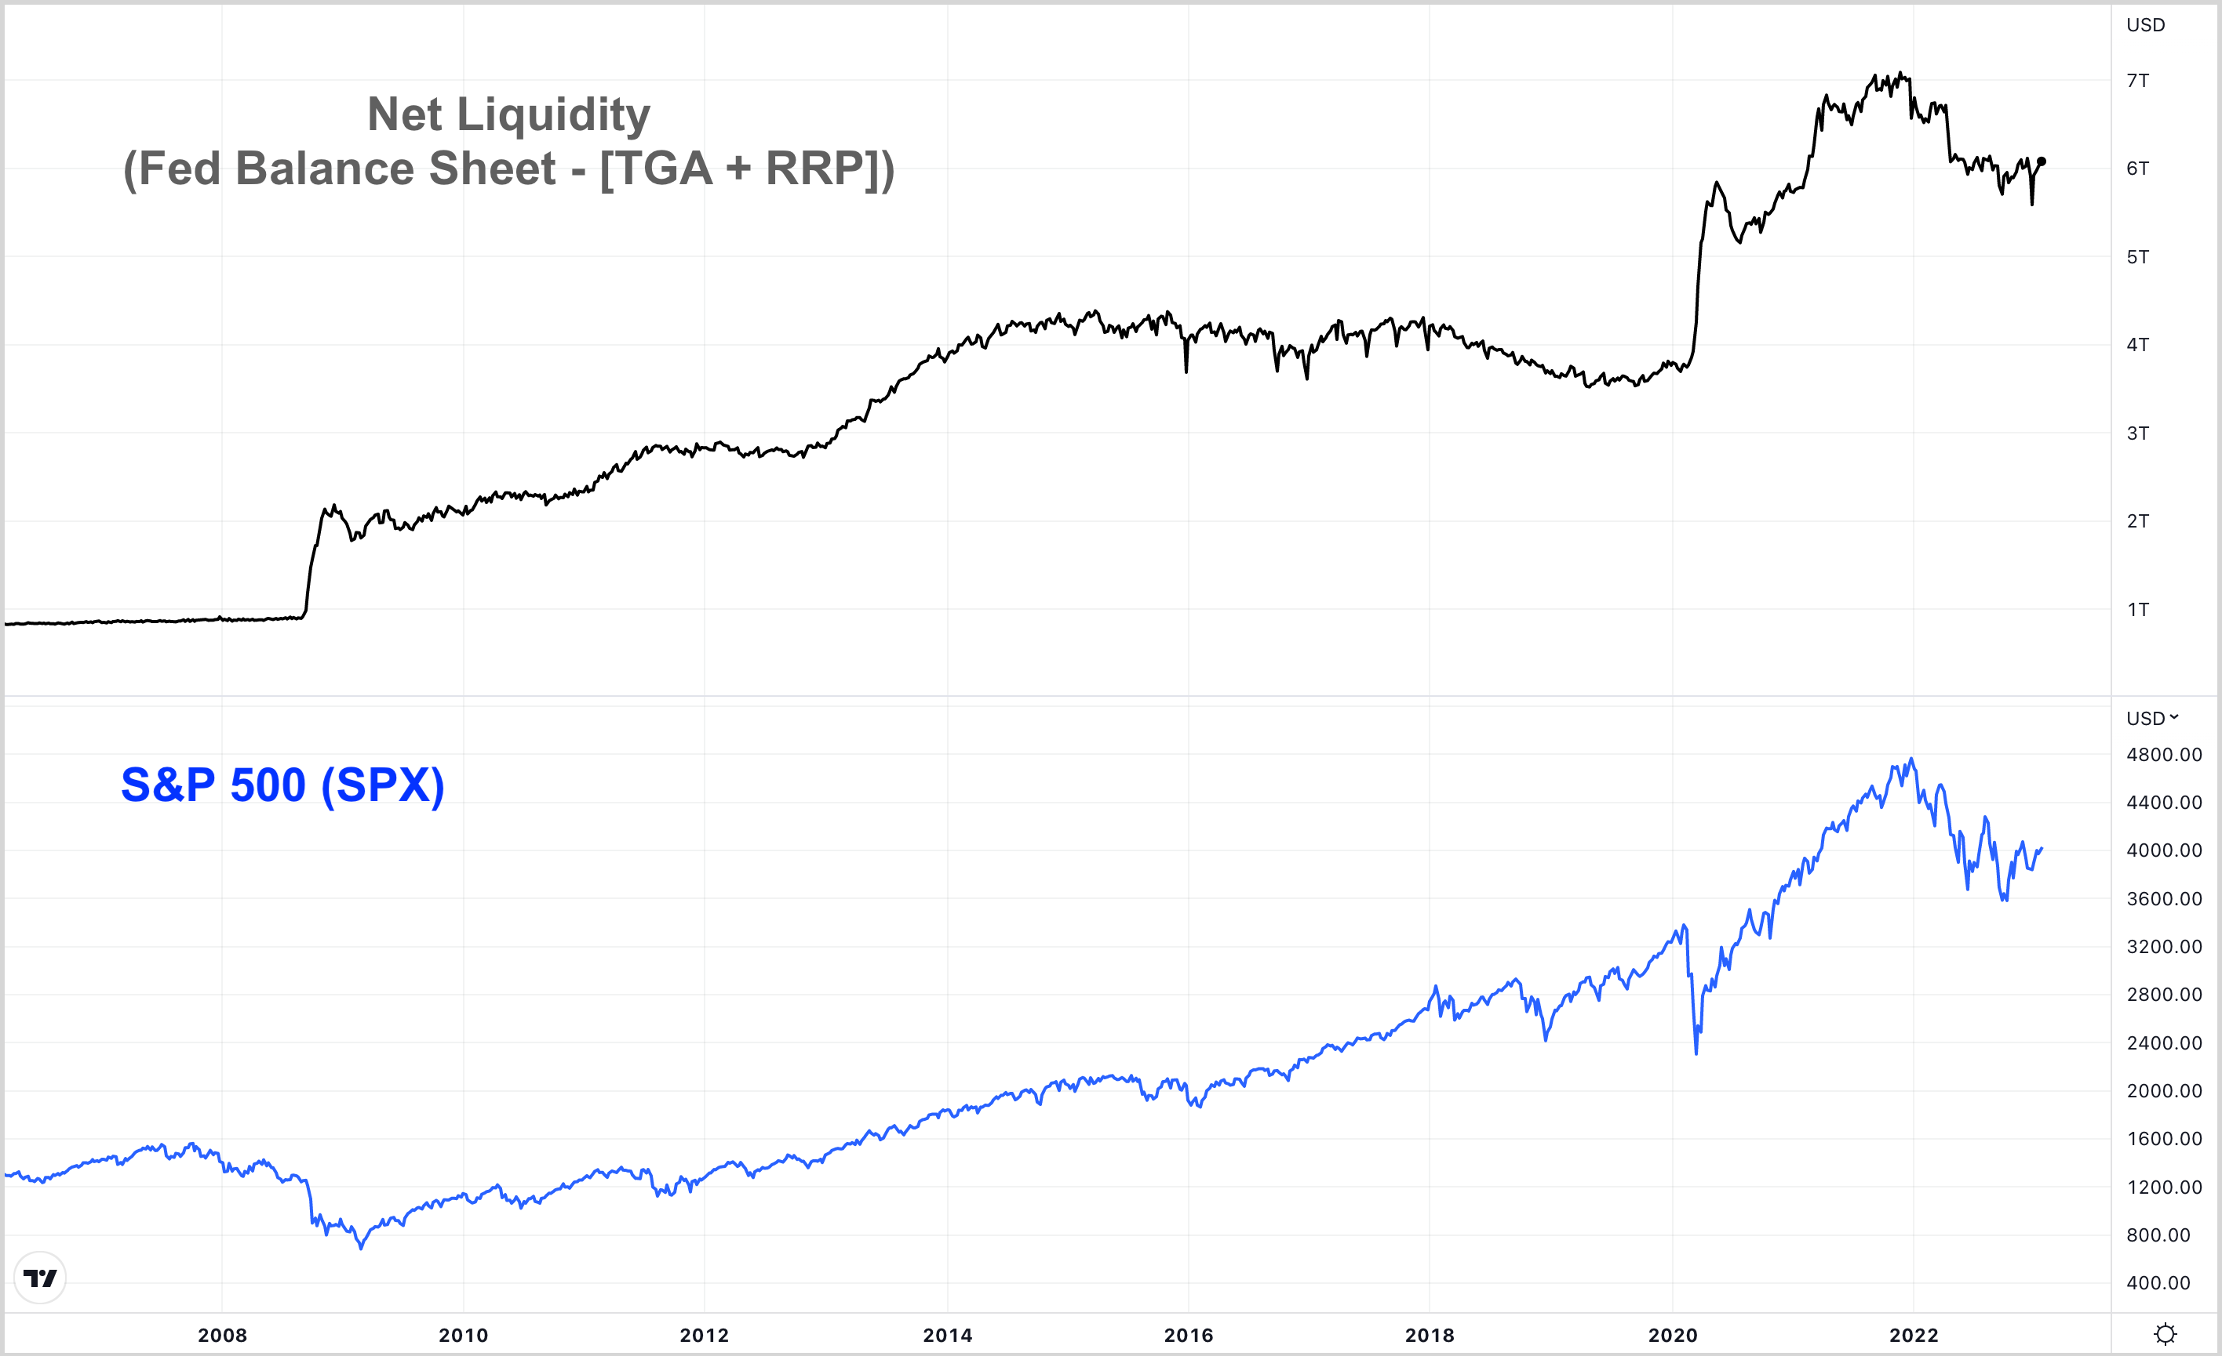
However, net liquidity and the SPX have been even more closely correlated since 2021, when both the TGA and RRP balances began to ramp up significantly.
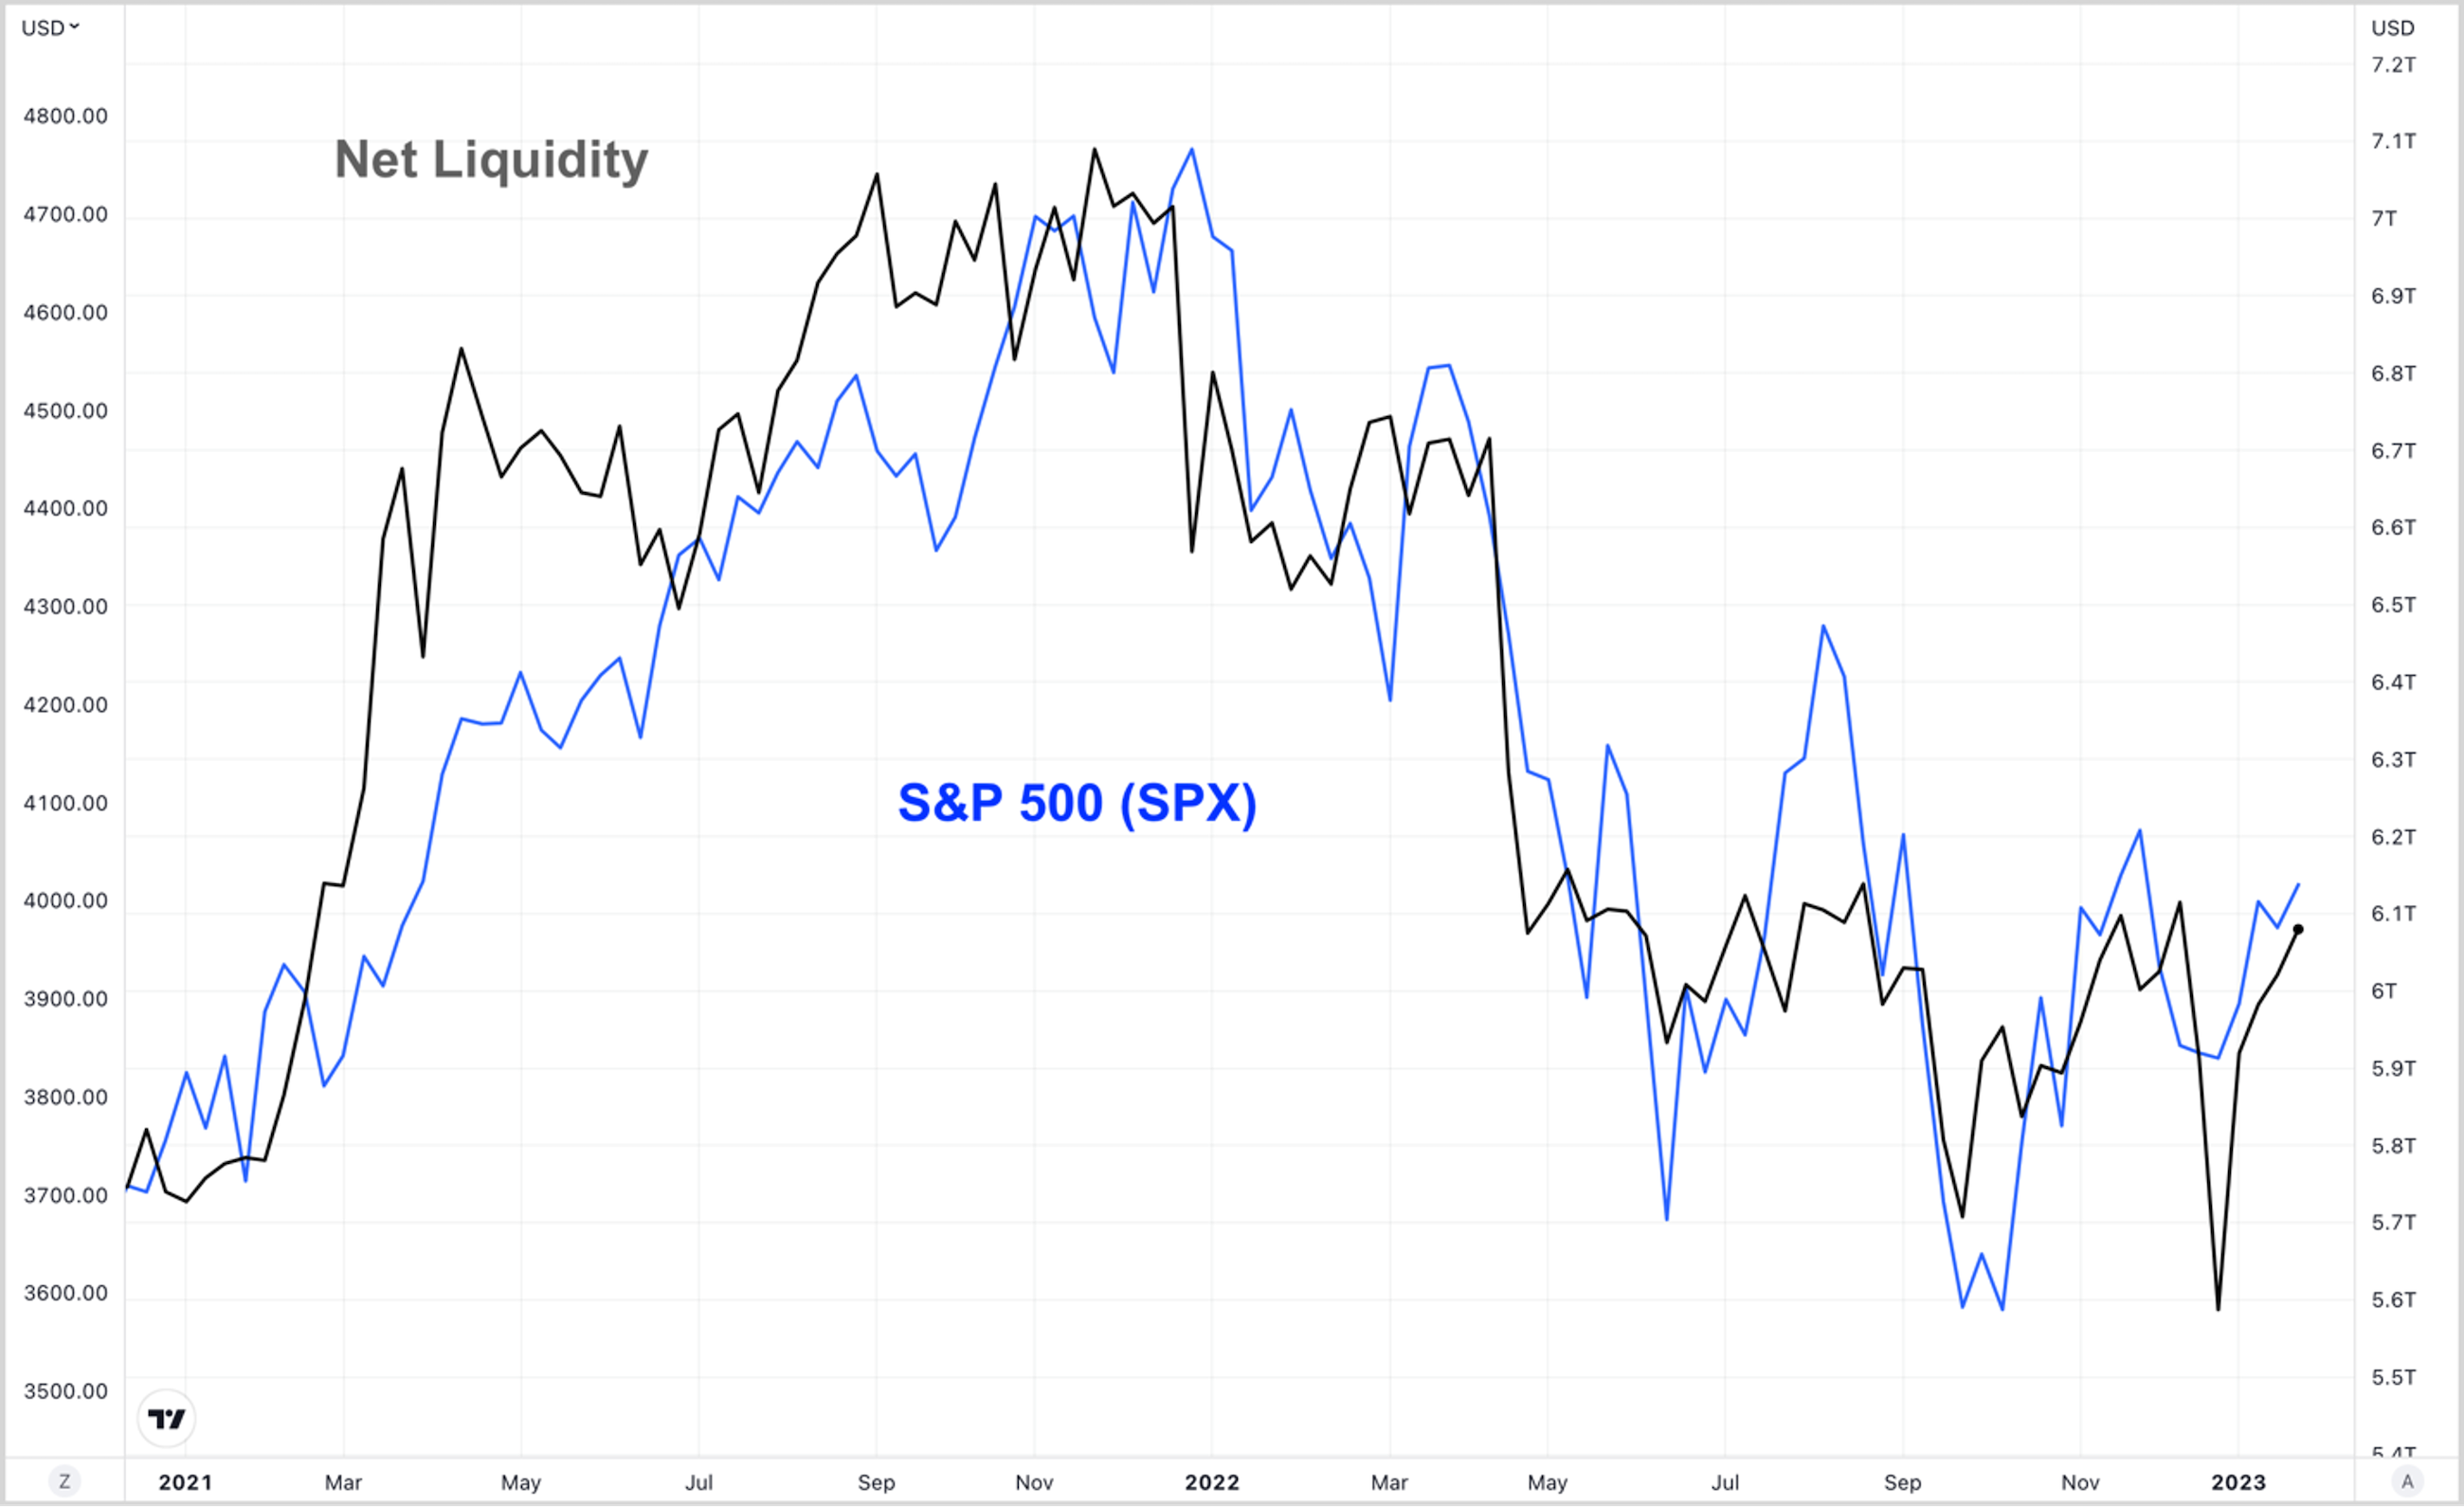
Net liquidity is currently around the same level as last June. It did move lower in September and December, but both declines were brief and quickly reversed.
In other words, while the Fed has continued to tighten monetary policy – through rate hikes and QT – actual liquidity conditions haven’t tightened significantly since last summer.
This relationship helps explain why the markets have been relatively buoyant over the past several months. And more importantly, it suggests they could continue to move even higher from here.
US Debt Ceiling
Moreover, both the TGA and RRP are likely to move significantly lower over the next few months. The reason has to do with the U.S. debt ceiling, which the government officially hit last week.
In short, because the U.S. Treasury can no longer issue new debt, it has started taking “extraordinary measures” to allow the government to remain solvent for a few additional months.
Some of these measures include temporarily stopping previously planned debt issuance for various government pension funds. These measures have given the Treasury a few hundred billion dollars of extra “headroom,” which it is now using to issue short-term Treasury bills for maximum financial flexibility in the months ahead.
Because Treasury bills offer higher interest rates than the RRP, we could see a significant amount of money move out of this facility and into Treasury debt over the next month or two. In fact that has already started. And again, a decline in the RRP balance would represent an increase in net liquidity.
In addition, if Congress doesn’t reach a debt ceiling resolution soon, the Treasury will also have to begin to spend down its TGA “checking account” at the Fed, currently holding around $350 billion.
If the current debate drags on, estimates suggest that could happen by June and the US financial conditions could be entering a sharply-rising net liquidity that could last as long as the next six months.
Therefore it could continue to provide a tailwind for stocks even if the Fed continues to tighten. And if the Fed should also decide to “pause” or “pivot” during this time, there’s no telling how high the markets could go.
Of course, it’s also worth noting that this tailwind could become a significant headwind when Congress eventually raises the debt ceiling again.
That means we could see significantly tighter liquidity conditions during the second half of the year, especially if the Fed continues to tighten as planned.
Happy trades