

MARKETSCOPE : The Final Season – The Tug-of-War continues
April, 04 2022
Window Dressing and Bear Squeeze Kept The Bulls Alive
 There’s been somewhat of a rally in recent weeks, but fears of inflation, inverted yield curves, oil prices and the war in Ukraine continue to rattle investors. Equity markets ended the week on a positive note with the S&P 500 closing slightly higher and reflation stocks outperforming.
The S&P 500 Index closed out its best month since December but its worst quarter since early 2020. Cyclicals stocks underperformed over the week, with financials and industrials sectors being among the losers. Stock prices fluctuated over the week in apparent response to the evolving situation in the war in Ukraine. After rising briefly on renewed Russia-Ukraine tensions, oil prices resumed their decline following the Biden administration’s announcement of an extended release from the nation’s Strategic Petroleum Reserve to combat inflationary pressures.
European stocks gained in a choppy week of trading, as higher-than-expected inflation data boosted expectations for further interest rate increases and drove bond yields higher. Chinese markets advanced, as investors anticipated that Beijing would step in to support the country’s economy and markets.
As the Fed embarks on a cycle of quantitative tightening, there are fears that it will reduce consumer spending and business activity as the central bank battles the highest inflation rates in a generation. Investors face a new challenge with an inverted yield curve sending a recession signal that is getting hard to ignore to pile on the inflation and war headlines.
CHECK our latest update A BEAR MARKET ANATOMY
Worst quarter since early 2020 for the S&P 500
The first quarter of 2022 was not friendly to the bulls despite that THE END OF THE MONTH RALLY was quite strong and pushed the market into overbought territory.
- While March was a strong month for US indices, Q1 total returns ranged from a decline of 4% for the Dow to nearly 9% for the Nasdaq 100.
- Growth was hit hardest with small, mid, and large cap growth all down at least 8.5% YTD while their respective value peers fell less than 2%.
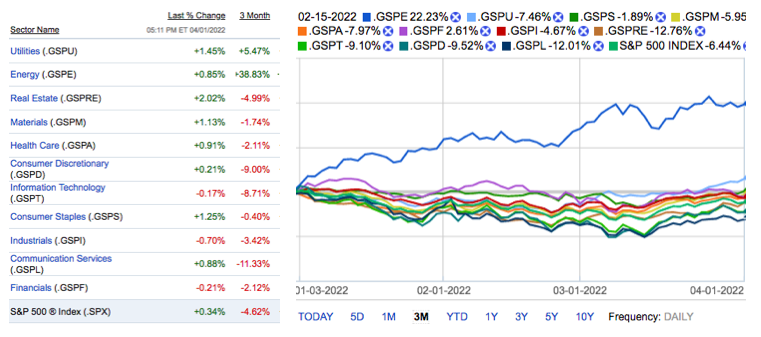
- Sector performance in Q1 was basically all Energy as the sector rallied more than 39%. The only other sector in the black for the quarter was Utilities, while three sectors (Communication Services, Consumer Discretionary, and Technology) are all down over 8%.
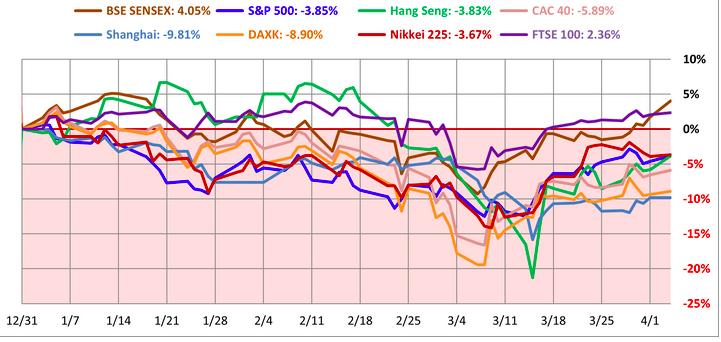
- Performance of international markets also saw a lot of dispersion. Whereas Brazil was up over 30% in Q1, China, Germany, and Italy were all down over 10%.
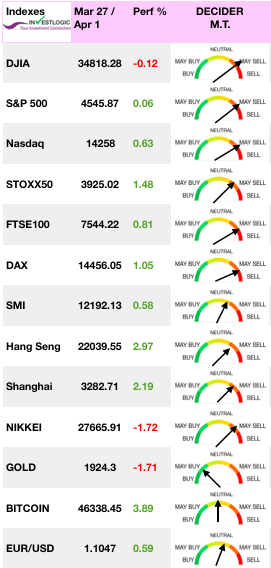
World Markets as of April 1, 2022
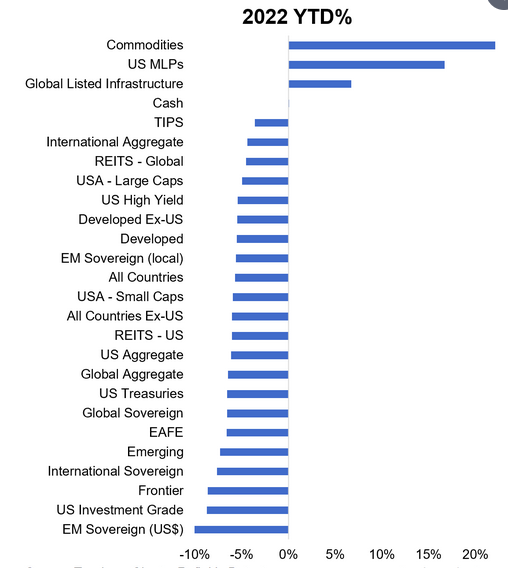
- If you think it has been a bad year for stocks so far, check out Treasuries as the long end of the curve (TLT) is down over 10% YTD.
MARKETS AT A PIVOT POINT
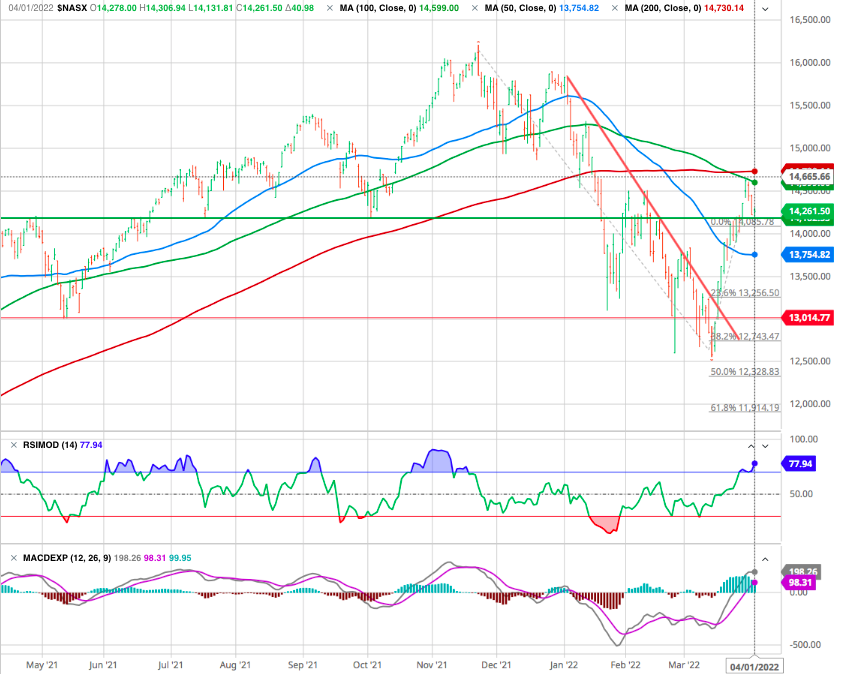
On the positive side, the gains that stalled out earlier this week pushed the S&P 500 back above its 50 and 200-day moving averages as well as the highs from early February forming a higher high in the process. On the negative side, the highs from February didn’t hold for long as Thursday’s waterfall decline to close out the quarter took the S&P 500 back below those levels.
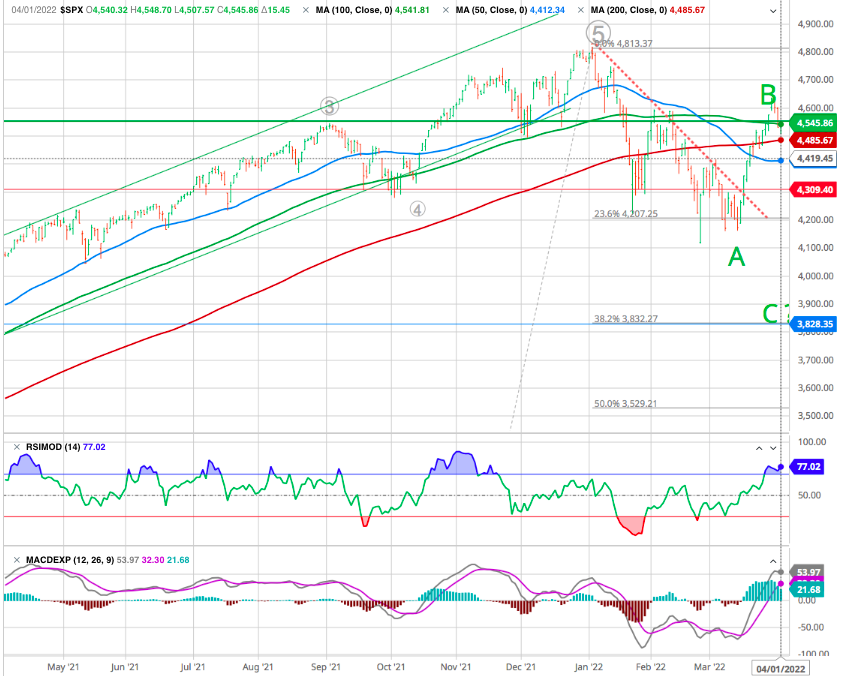
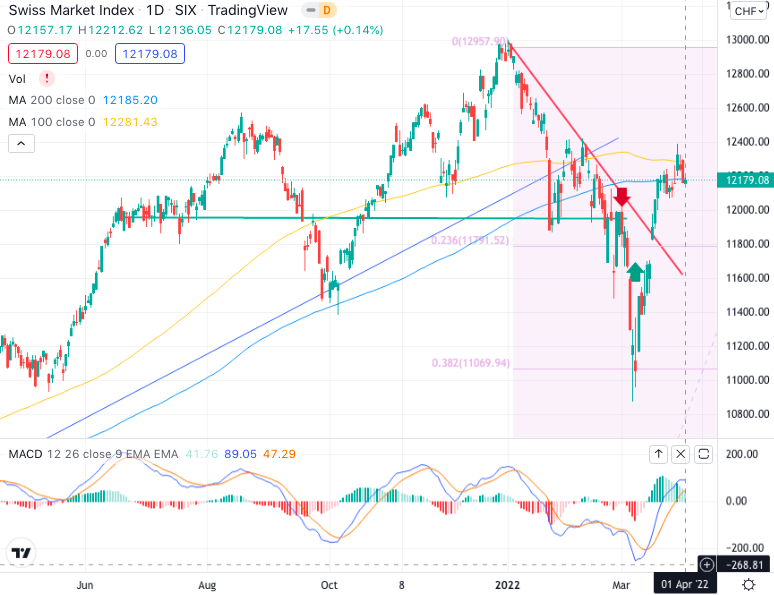
Actually many major indexes are now stuck between the DMA(100/200)-green, red- and 50 -blue-. Markets are at a pivotal point.
If the market can hold support at the 200-dma, or even the 50-dma just below, then the market could make another rally attempt later this month. If not, then the rally was reflexive, short-covering, and will retest lows.
All indexes are in the final stages of a last up wave (x) and the downtrend will resume soon. On weekly charts, the price action looks immediately bearish although a further uptrend during the week to form a terminal pattern
Our down target remains of at least 38.2 % correction of the last 24 months up move (SPX 3800)
We expect some hesitating and cross current moves in the coming days but for reasons explained below we remain bearish medium term for several reasons:
- The market is overbought in the short-term and must either consolidate at current levels or correct to lower levels to resolve it.
- Negative trends are still in place, which suggests the current rally, while significant, remains within the context of a reflexive rally.
- Volume is declining on the rally, suggesting a lack of conviction.
While the February highs are overhead resistance again, bulls will be closely watching the major moving averages for signs of support. This week’s declines haven’t been enough yet to cause bulls to lose hope, but it won’t be a worry-free week either.
The risk of a further market correction is undoubtedly present.
- Inflation was surging before the rise in oil prices.
- Now those higher prices are impacting consumption.
- Liquidity support is reversing.
- The massive infusions of fiscal liquidity in 2020 and 2021 are gone.
- The Fed’s QE program is over, and they are now hiking rates.
- The Fed will start reducing its balance sheet in May.
- However, monetary policy is already much tighter due to the inflationary build. When the Fed hikes rates, it will likely slow the economy much faster than most expect.
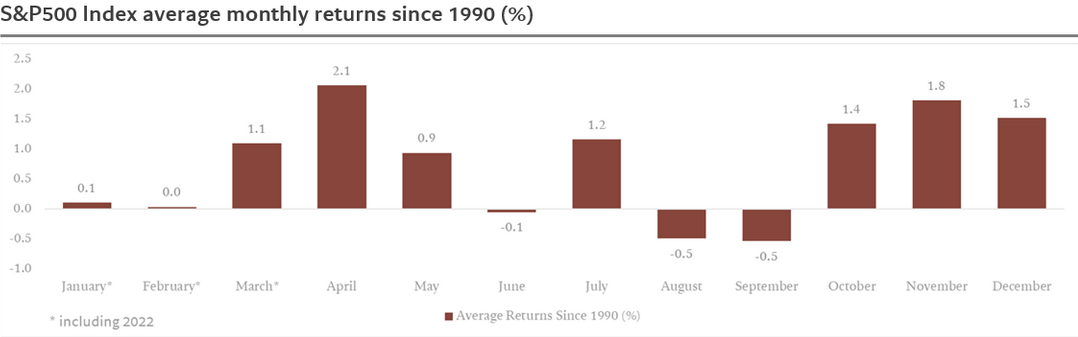
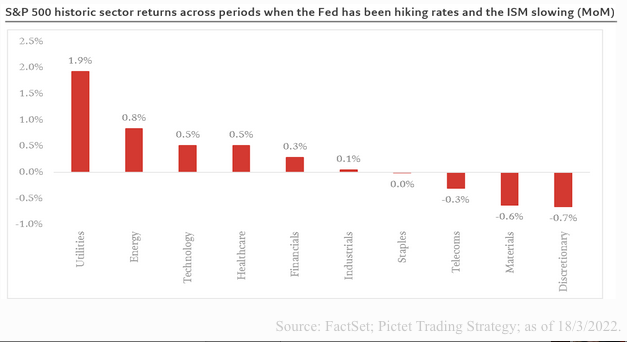
Never the less, be careful getting too bearish. As April tends to be a historically strong month of the year.
source Pictet Research
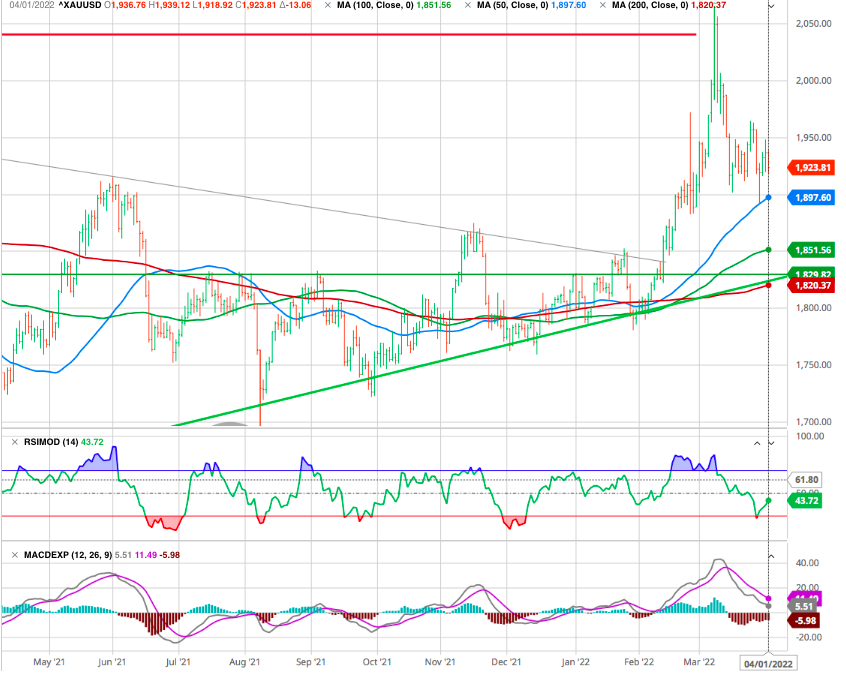
Precious metals are still in a state of hesitation, with the price of gold fluctuating between 1890 and 1960 USD, we remain positive with the MA’s supports and ultimately the long term uptrend at 1830.
The cryptocurrency market has confirmed in recent days the renewed energy of last week. After a rise of nearly 14% for bitcoin last week, the crypto-currency is now hovering around $45,000. On the other hand, caution remains the order of the day in this very tense geopolitical context.
STRATEGY
No one truly knows whether the market volatility and/or the stock market correction has run its course – or whether there could be more turbulence ahead. We realize this is probably not a satisfying takeaway for many investors, especially given all of the uncertainty surrounding the ongoing war in Ukraine and rising energy prices. But we think investors can – and should – take solace in remembering that market volatility and corrections are not only common, but they’re also healthy. Markets need to reset valuations and investor’s expectations from time to time.
The cycle is turning outright hostile for tech and growth, at a time when valuation multiples are high and likely to endure valuation compression.
So is there anything you can do? Is there a way to still profit from what is coming?
Yes. Look to value stocks, commodities, and energy and precious metals. These will be areas of prosperity in the period ahead. The cycle is deeply favorable for them now.
The war continues to be disheartening and disconcerting. The impact on the oil markets also appears to be better understood by markets and corporations, which may help explain some of the rallies we’ve seen in stocks since March. We will continue to monitor the situation closely and will offer updates if our views change.
In the meantime, we recommend that you keep a close eye on risks and other economic indicators to protect your investments.
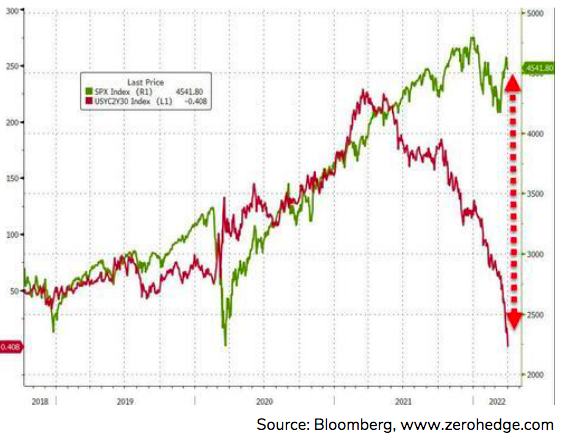
Chart of the Week : YIELD CURVE
Portions of the Treasury yield curve inverted over the week. The yield on the 2-year Treasury briefly exceeded the 10-year on Tuesday for the first time since 2019, in a warning sign that coming Fed rate hikes may trigger a recession.
US stocks and the US yield curve are diverging meaningfully as the 2-year – 30-year Treasury Bond yield curve just inverted for the 1st time since late 2007 while the S&P 500 trades within 5% of its all-time-high. -SEE 2nd part-
To have a global view check The Yield Curve Inverts: What Happens Next
Recession risk
 Yield curves typically slope upward, so when short-term yields return more than longer-dated ones, it suggests there is reason to worry about the long-term outlook. It can also signal that the high levels of short-term yields are unlikely to be sustained as economic growth slows, which can have an impact on a range of asset prices.
Historically, a recession has not happened without an inversion. So likely, it will be a predictor of a future recession. Timing, however, is unknown. It could take up to two years. Some believe that this time around, yield curve inversion may not be as good of an indicator as it has been in the past, particularly given the enormous amount of quantitative easing undertaken by global central banks.
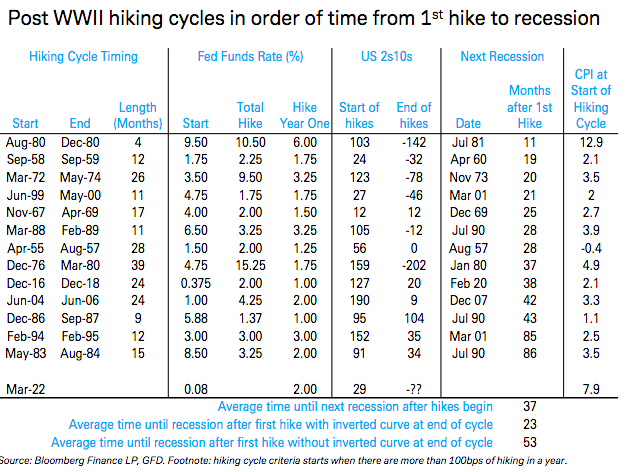
The truth is, a curve inversion is more of an early warning indicator than a signal of imminent doom for the economy. On average, it has taken 14 months after the 2s/10s yield curve first inverts for a recession to finally hit the economy, according to BofA Global Research. And that’s a long lead time.
The bottom line is that a yield curve inversion isn’t exactly the economic death knell that the media makes it out to be. It is potentially a sign of trouble ahead for the economy and stock market, but it’s typically many months (if not years) off in the future before the real trouble starts.
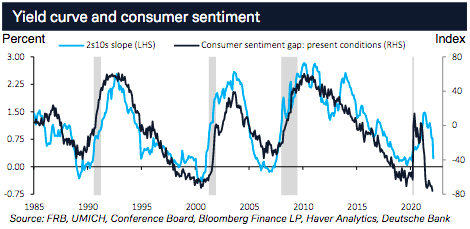
Nevertheless we recommend the excellent Albert Edwards note Extraordinary times as the Fed shifts to gaslighting investors we quote “…Nevertheless, the Fed should take note of the chart below, in which the black line shows how consumers feel about their prospects compared to their current situation. Unpolluted by questions about the impact of QE in depressing the shape of the yield curve, this sure looks to be confirming a recession to me.”
Anyway, Fed funds will not need to rise much before the Fed crashes the economy and the markets. It is as they say “déjà vu all over again”.
Happy trades