MARKETSCOPE : The Fed: Friend or Foe?
September, 18 2023“All the talk of us having a recession has vanished”
John Williams, NY Fed President, September 7, 2023
It reminds us of March 2007, when ex-Fed Boss Ben Bernanke said in his remarks to Congress:
“…the impact on the broader economy and financial markets of the problems in the subprime market seems likely to be contained.”
The role of a central banker is to show the self confidence He is the man who knows.
Never the less no one can definitively say whether all of these policies will lead to a soft or hard landing for the U.S. economy; but what we do know is that the Fed’s choices will definitely impact the global economy for the coming years.
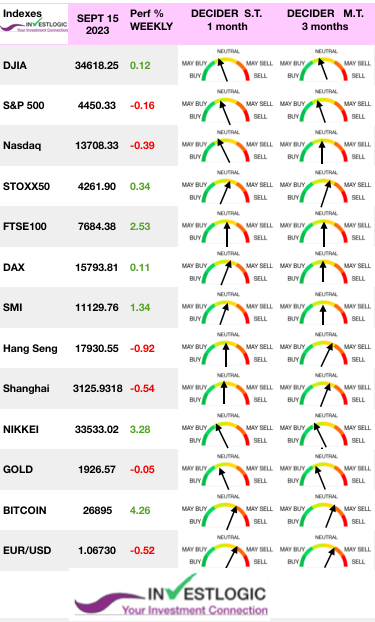 US stocks had a mixed week, with value stocks leading the marke. Stocks fell sharply on Friday, with risks rising from the UAW auto strike, the first time in the union’s 88-year history that all three major automakers were targeted simultaneously.
Friday was particularly choppy as one of the most significant options expiration days on record. With nearly $3.2 Trillion in options expiring, stocks traded negatively for the day.
Unsurprisingly, given the recent performance of the mega-cap stocks, which has recently attracted most of the liquidity flows, the selling pressure was primarily contained within those names, with value stocks outperforming for the day.
Chip equipment makers Applied Materials, Lam Research and KLA Corp. all fell more than 4% following a report that Taiwan Semiconductor was delaying deliveries, raising concerns about weak consumer demand (more in the next section). Adding to the gloom was rising oil prices, which have pushed past $90 per barrel to year-to-date highs. See our analysis in highlights
However, broad market sentiment received a boost from the largest IPO of 2023 as shares of Arm started trading on the Nasdaq on Thursday. Treasury yields continue rising and to weigh on stocks, with the benchmark 10-year yield climbing to 4.32%.
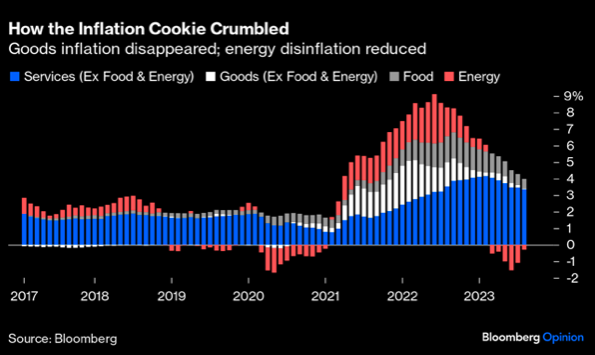
Last Wednesday’s release of the August CPI data showed that t the headline CPI numbers showed the largest monthly increase since August 2022, rising 0.6% M/M and 3.7% Y/Y due to the effect of higher gasoline prices. Rising energy prices may prompt the central bank to further tighten monetary policy. Headline producer prices index (PPI) climbed more than expected while core PPI was in line with expectations.
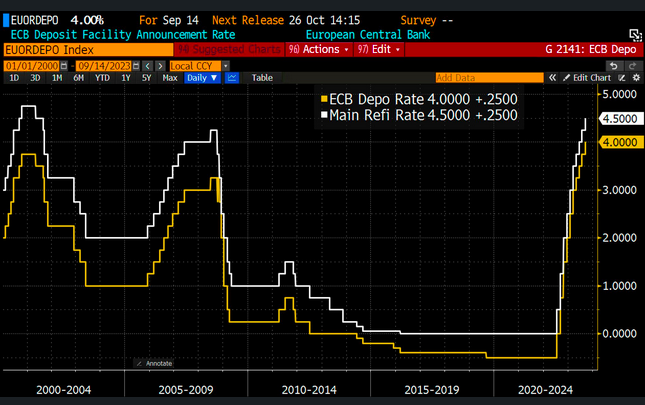
STOXX Europe 600 Index ended 1.60% higher after the ECB raised interest rates but signaled that borrowing costs may have reached a peak. Christine Lagarde suggested it could be the final one, despite raising inflation forecasts for this year and next. The possibility of the monetary tightening cycle concluding has revived risk appetite in Europe.
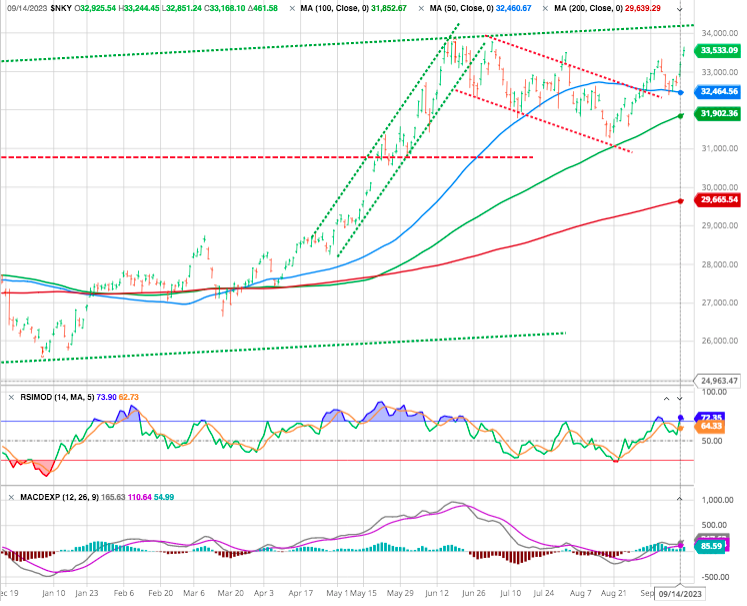
In Asia, Japan’s Nikkei 225 Index finished up 2.8%. Japan’s benchmark is diverging from the rest, positive break of the “bullish flag” on the Nikkei 225 signalling returning positive momentum.
Chinese equities were mixed. Better economic data out of China also appeared to lift investor sentiment. It’s worth noting that China’s production and consumption figures for August exceeded expectations slightly. This may indicate that the various measures announced by Chinese authorities are starting to show positive results.
Next markets preparing for a parade of key central bank policy meetings around the world.
This week, the Fed’s monetary policy decision on Wednesday, along with the BOE and BOJ meetings on Thursday and Friday, will either affirm or challenge this outlook. Rate decisions are also in due from the central banks of Norway, Sweden, and Switzerland.
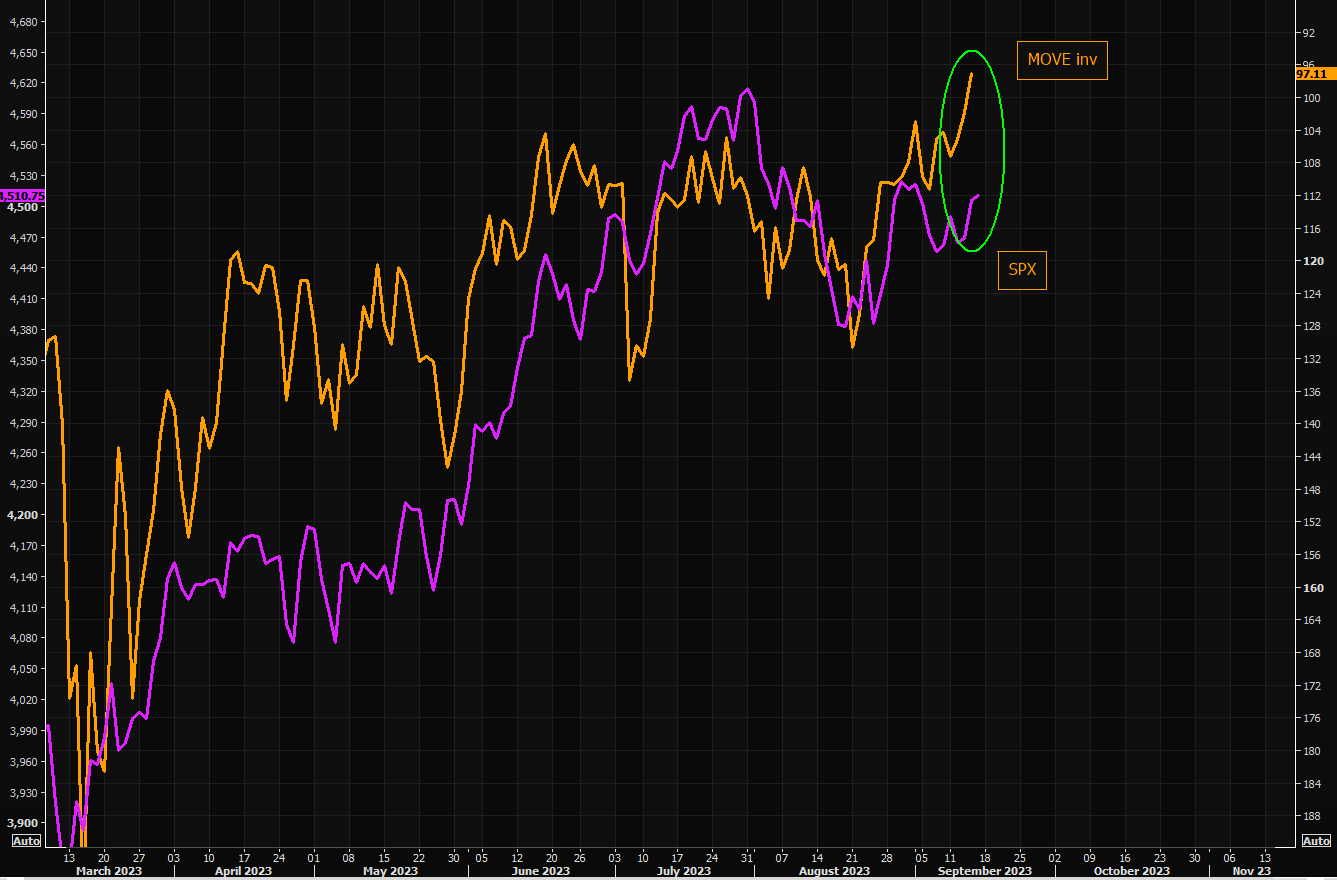
Stock markets will remain fixated on the possibility of a peak in interest rates, a scenario investors are hoping has already occurred.
Beware as equity markets expect rate cuts, the bond market predicts rates to remain restrictive, creating a difference of opinion. Note the gap between SPX and the MOVE (inverted). MOVE vs SPX.
The week could also see some extra drama on the political front as the countdown continues toward a potential government shutdown on October 1.
MARKETS : HEADWINDS
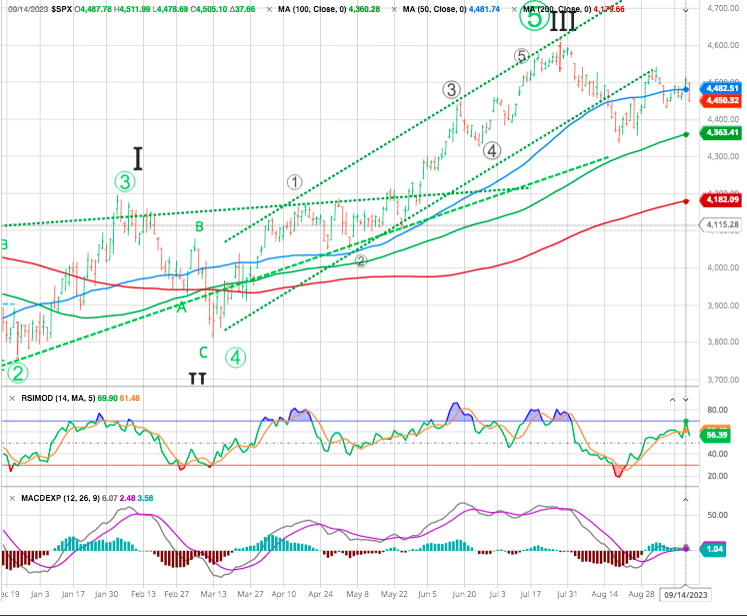
Waiting for the next Powell move, the market held support at the 50-DMA on Friday, with the overall price conditions remaining neutral. Like a groundhog that sees its shadow, the MACD signal is close to registering a “sell signal.” If the signal triggers, it could signal a couple of additional weeks of sloppy trading action heading into October.
The latest rally failed to break above the previous support (which turned into resistance) at around 4,500, and a new leg down could send the index towards the wave 4 target between 4,302 and 4,325. Ultimately, technical indicators suggest the recent stock market correction may not be over, with a potential bottom around the 4,150-4,200 level (200DMA).
Unsurprisingly, given the recent performance of the mega-cap stocks, which has recently attracted most of the liquidity flows, the selling pressure was primarily contained within those names, with value stocks outperforming for the day.
Tech Played Out: So, look to other groups with earnings power and undervalued shares. Industrials, basic materials and financials jump to the head of that list.
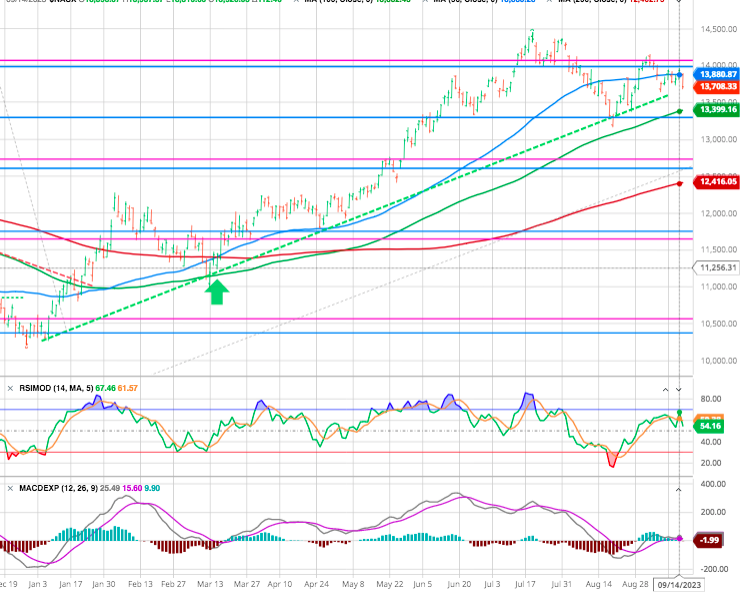
Despite a late positive action for the US tech index, the positive momentum failed to gain traction and the index formed a bearish “lower low” in the process. Last week, the index closed below the 50- and 20-day moving averages, suggesting that the index could suffer second leg towards 12,500.
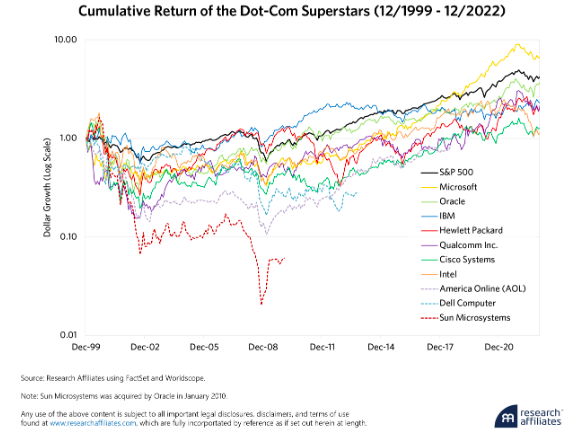
The fine folks at Research Affiliates had an interesting piece out earlier this month, which you can download here.
In hort, when assets get priced to perfection and beyond, as was the case in late 1999, and early 2000 for the largest dot-com stocks, those stocks have to deliver on growth, otherwise their valuations eventually start to deflate.
In that context, the following chart is super-interesting and sobering.
It shows the performance of the 10 largest dot-com-related companies from December 1999 through December of last year:
It stands out, that;
- Not one company beat the market (S&P 500) by the time of the next bully cycle peak in 2007
- Only one company, Microsoft, has managed to beat the S&P 500 by 2022
- All other underperformed the index
- Apple and Amazon are not on the list because they did not make the top 10 in 1999, each struggling with its own problems (and Apple with a near-death experience)
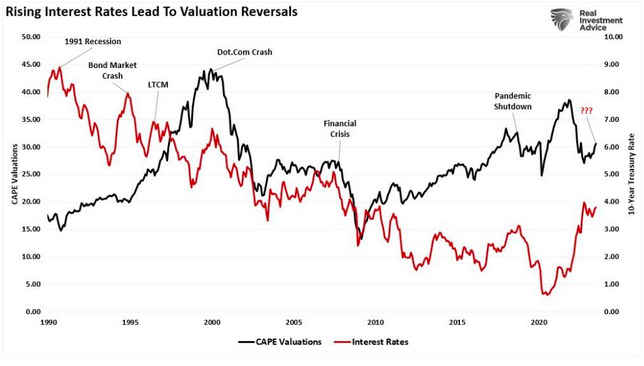
Last but not least analysts are once again becoming increasingly optimistic about earnings growth into 2024. But beware says Lance Roberts since 1990, increases in interest rates have regularly aligned with reversals in P/E ratios, bear markets, recessions, or financial events.
Nikkei 225: A positive breakout!
From a technical point of view, the index appears to be forming a bullish flag. And after an initial unsuccessful attempt to break through the upper band of the pattern, the price finally did manage to move above the resistance, permitting the positive momentum to return.
Euro Stoxx 50
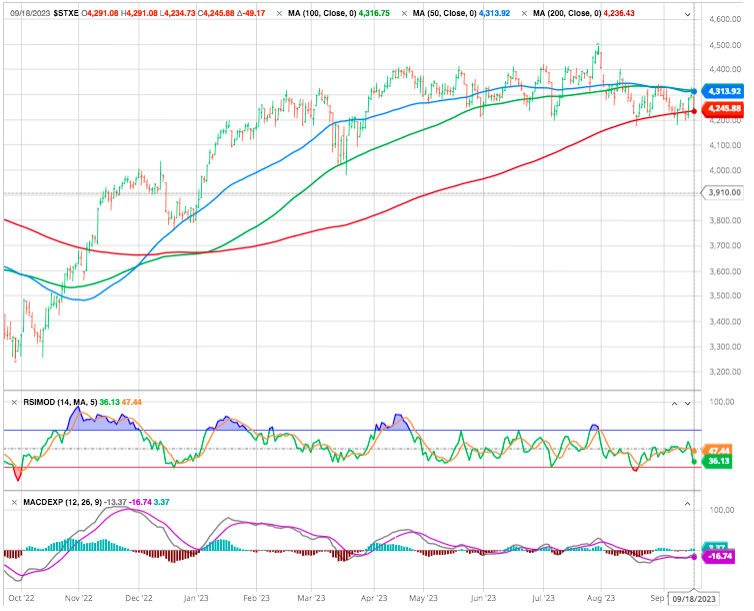
Support held and a rebound towards the 200-day SMA has occurred. A relief rally has occurred, but as long as the price remains below the 50-day moving average (currently at 4,314) the sideways consolidation may continue in the weeks ahead.
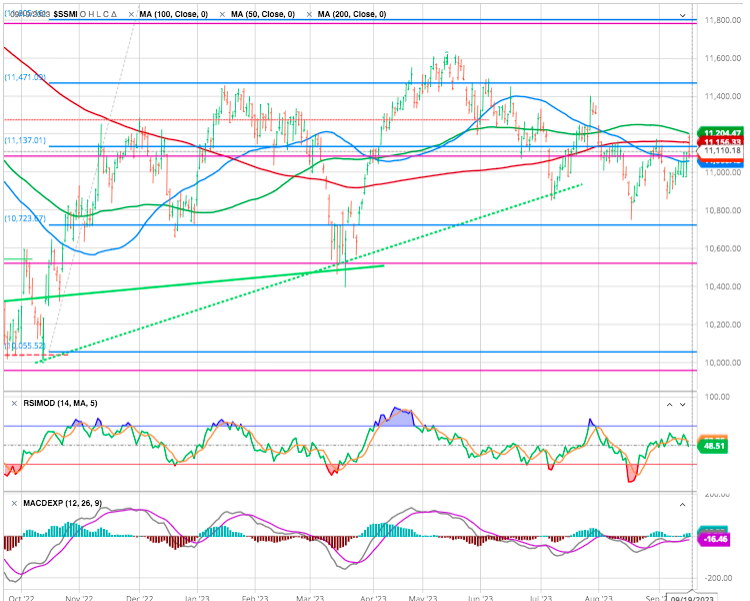
Swiss Market Index
Attempting a catch-up, but still below its 200-day DMA
Crypto:
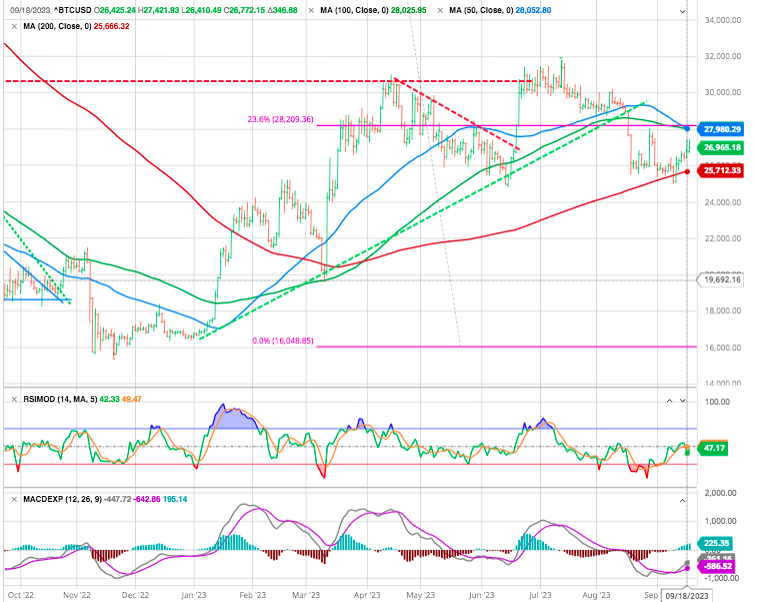
Bitcoin, after four weeks of consecutive declines, has regained attention by surging more than 2% since Monday and currently trades at approximately $26,400. In contrast, Ether, another cryptocurrency, is not performing as well, with a modest gain of +0.27% over the same period, and it remains around the $1620 range. Notably, trading volumes on major platforms like Coinbase and Binance have been steadily decreasing in recent weeks, indicating waning investor interest in cryptocurrencies.
FED : Ahead of the curve ?
With the Federal Open Market Committee widely expected to keep rates unchanged at its meeting on Wednesday, investors and economists will keep their eyes trained on the policymakers’ economic projections that are released at the same time.
In addition, they’ll be listening for any hints about the likely path at following Fed meetings, especially the last one of the year on Dec. 12-13. Nearly all Fed officials have been repeating Fed Chair Jerome Powell’s mantra of “higher for longer,” but the summary of economic projections (“SEP”) will offer a view of how high the central bank may go and for how long.
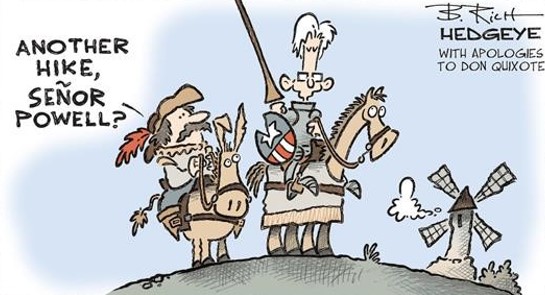
The Fed may pass on raising rates this week, but that doesn’t mean they are done. Given the stronger-than-expected economic growth witnessed over the last few months, it seems more likely than not that the Fed will signal through its Summary of Economic Projections that another hike may be needed while removing rate cuts for 2024.
This is critical for the Fed, especially when asset price inflation has skyrocketed, and core inflation metrics stay elevated. On top of that, commodities like oil and gasoline are again on the rise, and that effect can ripple through the economy.
This has already resulted in rates on the back of the yield curve and market-based inflation expectations. Additionally, it puts the Fed in a tough spot because if the market views the Fed as not being aggressive enough against sticky inflation, yields on the back of the curve could rise even further while inflation expectations rise.
This is why the Fed will need to communicate to the market that they remain data-dependent, that a rate hike in November is on the table, and that the unexpected outperformance of the US economy means rates in 2024 may not come down as much as expected.
Overall, though, the economy has remained pretty resilient. A hard landing seems to be out of the cards for now, but that can be difficult to predict over the long term, especially if the Fed is late to react to economic conditions (remember the infamous “transitory” call from 2022?).
As a result, the central bank’s dot plot for next year might be more cautious as it continues to play defense on inflation and resist signaling anything that might lead financial markets to get ahead of the Fed on rate cuts.
Happy trades


