MARKETSCOPE : Summer Heat
August, 08 2022Risk On !
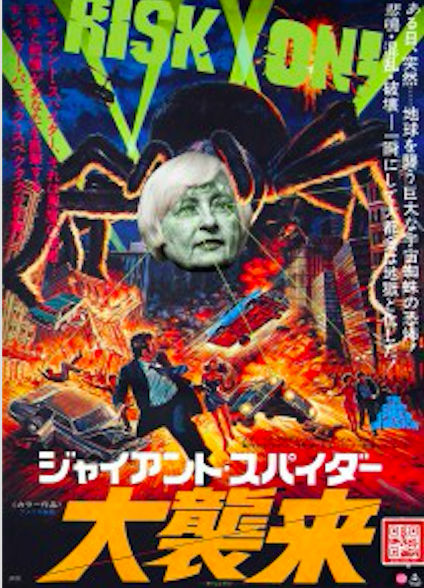
Risk appetite is back on financial markets. Despite a slow start to the week, equity markets seem set to continue the rebound that began in July.
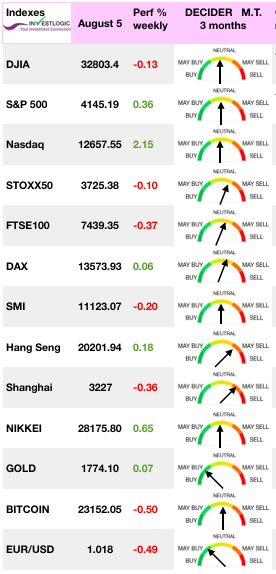 Even if the reception given to the monthly employment figures in the United States, unveiled today, was rather cold, rekindling fears of another sharp rate hike by the Fed in September. Investors have not lost the risk appetite they had regained with the return of summer, but they remain concerned about the level of rates at which central banks will have to rise to regain control of prices.
A surprisingly strong jobs report sparked concern from investors that the Federal Reserve would continue its aggressive interest rate hikes to cool the economy and dampen inflation. The U.S. economy added 528,000 jobs in July, the Labor Department reported, more than twice as high as expected, and the unemployment rate ticked down to 3.5%, matching the lowest level since the late 1960s. the wage/inflation spiral is still taking its toll.
As for corporate earnings, they remain surprisingly strong, a sign that consumers are holding up well for the time being after the price surge. In this uncertain environment, companies have defied rising costs with the complicity of consumers who have not yet let go. The half-year results season, which was bound to be complicated, has finally been positive.
In Europe, the STOXX Europe 600 Index slipped 0.6% on stagflation fears as eurozone unemployment rose for the 1st time in 14 months in June while German manufacturing activity contracted in July for the 1st time in two years. In the UK, the BoE raised its key interest rate by 50 basis points, the biggest increase in 27 years.
China’s stock markets eased as geopolitical tensions, mortgage boycotts, and tepid economic data kept buyers on the sidelines.
Check our proprietary ABS Matrix and sector allocation
MARKETS : Is the Bottom In?
Much of the financial media and market gurus have determined that the bear market is over and a new bull market has started. We do not share this opinion.
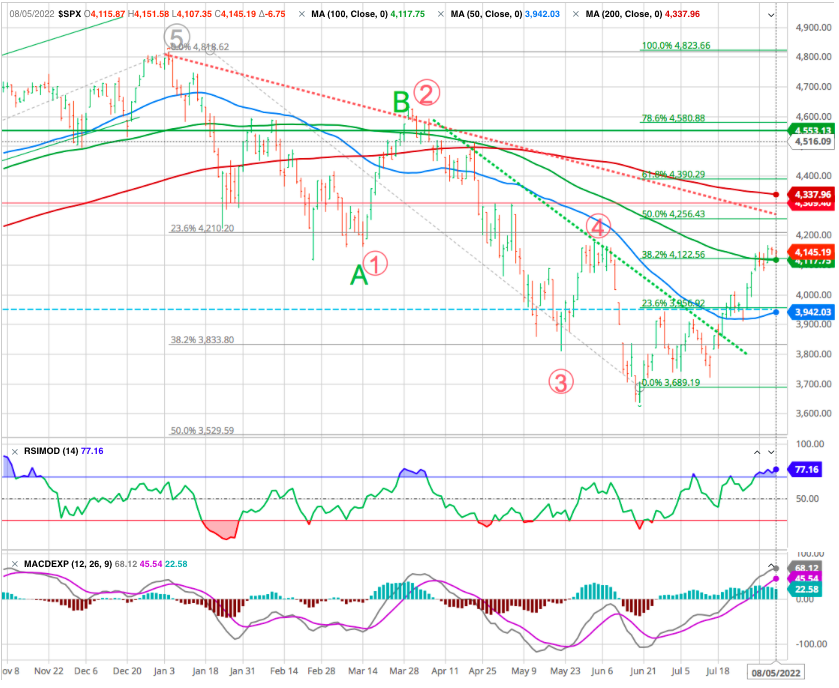
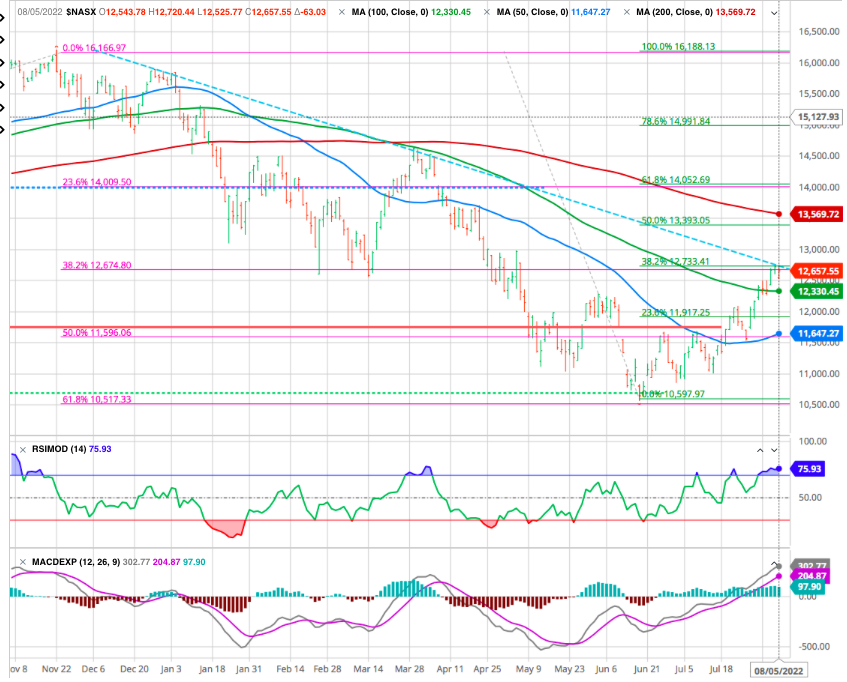
As we mentioned last week, bounces might have several legs. This market surge could be one of these legs as the short- to intermediate-term time frame was bullish. However the market achieved its 32.8 % (green index) Fibonacci retracement from the January top at 4145. This is also the 100 DMA level and it provides a main resistance area.
If this rally moves significantly higher or lasts significantly longer than these estimates suggest, it could indicate that a more bullish scenario is playing out. Next resistance is the 50% retracement at 4256 and the dowtrend line.
We still believe this is extremely unlikely to occur without a major reversal in Federal Reserve policy -see below-
As well as for the Nasdaq
Picking bottoms is a stinky business, particularly when the Macro outlook is as bleak as we think it is. So let’s take a big step back and dissect the current bounce relative to history.
History can act as a guide, not because it can predict the future, but because sometimes it can prepare us for what may happen next. Investing is very much about understanding the fundamentals and the technical trends.It isn’t to say that future is on a predetermined course; it is not. But it can give us a glimpse into what may happen next based on how bear markets and emotions have steered past performance.
Let’s put the latest bear market bounce into perspective.
- The bear market of 2022 has eerily similar characteristics of bear markets of the past.
- The 2022 bear market looks very similar to those in 1937, 2000, and 2008.
- If the bear markets are similar, the 2022 version is nearing its most dangerous phase.
The declines may differ in each of these cases, but it isn’t the reason that matters. As suggested by Mott Capital it is the patterns the market followed that matter.
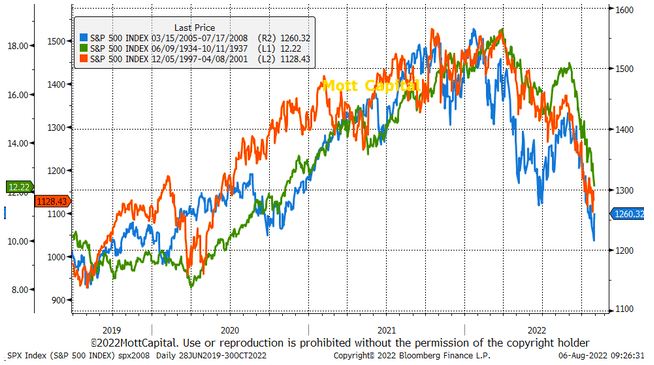
When overlaying 1937, 2000, and 2008 all together on one chart, they show that the bull rally phases had nearly the same duration, with all peaking within a 6-month time frame, followed by a sharp decline, a very sharp countertrend rally followed by a significantly steeper decline.
Looking at the seasonality chart below, the month of June often puts in the low for the year, which is sometimes retested in the August through October period (highlighted in yellow).
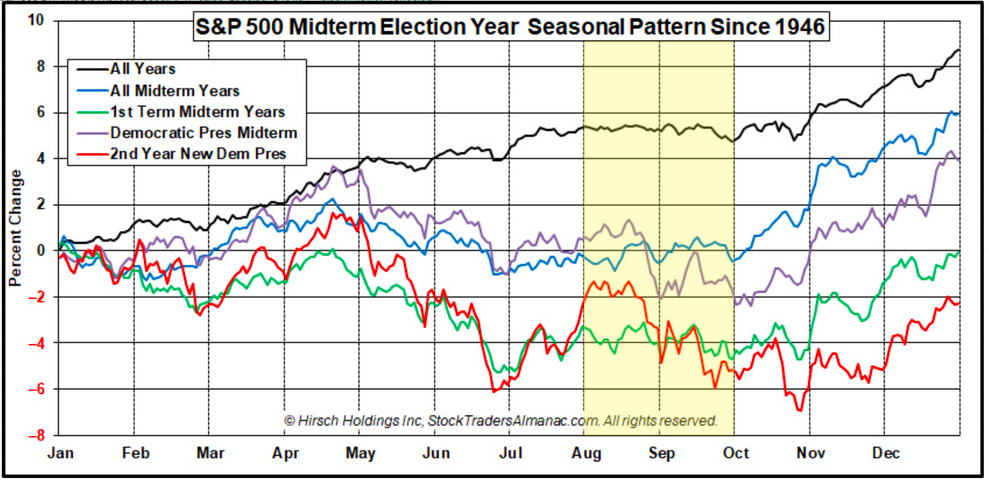
Such suggests that we continue to treat the current market surge as a “bear market rally” until we have compelling confirmation the bull market is back.
Overall patience should be a core asset allocation.
Energy
Russia has made good on its threat to cut gas supplies to Europe. The risk of a winter gas shortage is growing on the old continent. On the oil side, both Brent and WTI dropped nearly 10% over the past week, settling at $94 and $88 respectively.
Gold
Precious metal rallied to $1,775, as U.S. Treasury yields and a falling dollar boosted demand for the historic safe-haven asset. Silver, palladium and platinum are following gold’s lead and grabbing a few dollars.
Cryptos
Bitcoin remains almost at equilibrium for this first week of August, hovering around $23,000. It would seem that present geopolitical tensions, as well as rampant inflation are curbing investors’ appetite for risky assets and thus the influx of capital into crypto assets.
USD
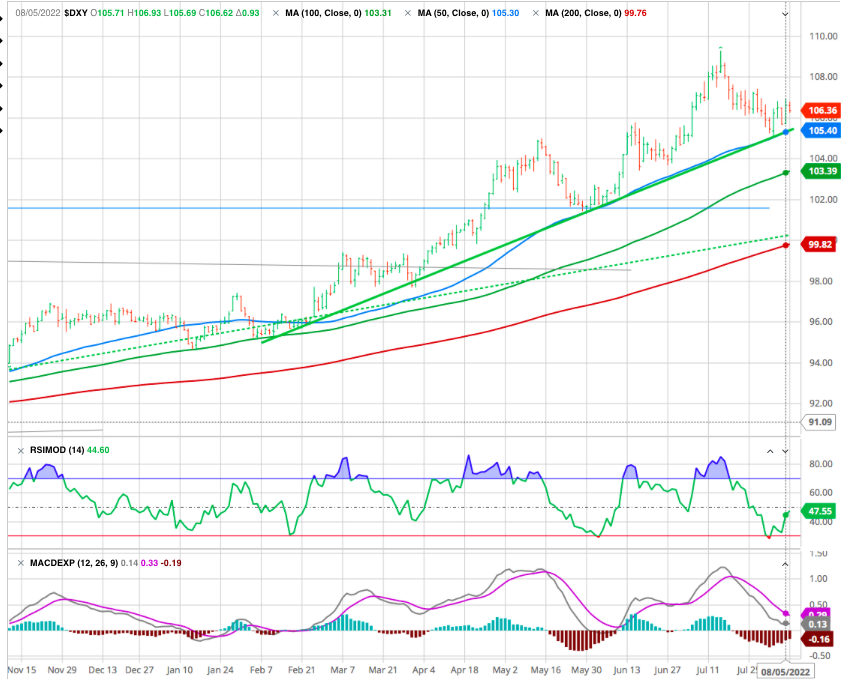
DXY has been consolidation and the market seems to take a pause. We had a several fair chances to break out above 108 , but it did not come to fruition. Technical dollar to outweigh fundamental bullish dollar tailwinds for the moment keeps supporting the green note.
This Time is Different !?
“The four most dangerous words in investing are ‘this time is different.’” – Sir John Templeton
We agree with Sir Templeton and we shall review below why the motto is still prevailing.
While market bulls are chasing stocks in hopes of a “Fed pivot,” with few signs of financial or credit market stress, the Fed can remain focused on combating inflation.
For markets, the most important read-through is that it now becomes much easier for the Federal Reserve to raise rates. If the employment market is still strengthening, while inflation remains its highest in decades, it’s hard to see why it shouldn’t. As a result, Friday saw a sharp increase in bets in the fed funds futures market. The implicit fed funds rate predicted for the Fed’s meeting in February of next year started last week barely above 3.2%. It’s now risen beyond 3.6%. The belief in an imminent “pivot” by the Fed away from raising rates has taken a knock.
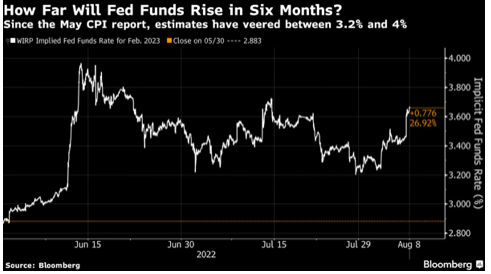
Source Bloomberg
As noted by Bloomberg’s editorialist John Authers : “Data-dependency never goes away.” A surprise would probably have an even bigger impact on rate expectations and on yields.
If the inflation reports, due Wednesday, were to surprise to the upside, of similar magnitude on the July consumer price inflation numbers, would probably have an even bigger impact on rate expectations and on yields. Speculation of an inter-meeting rate hike by the Fed could be stirred up and lead to some bigger moves in the bond market.
If the data dictate higher yields and interest rates from hereon, that’s going to make it harder for stock investors.
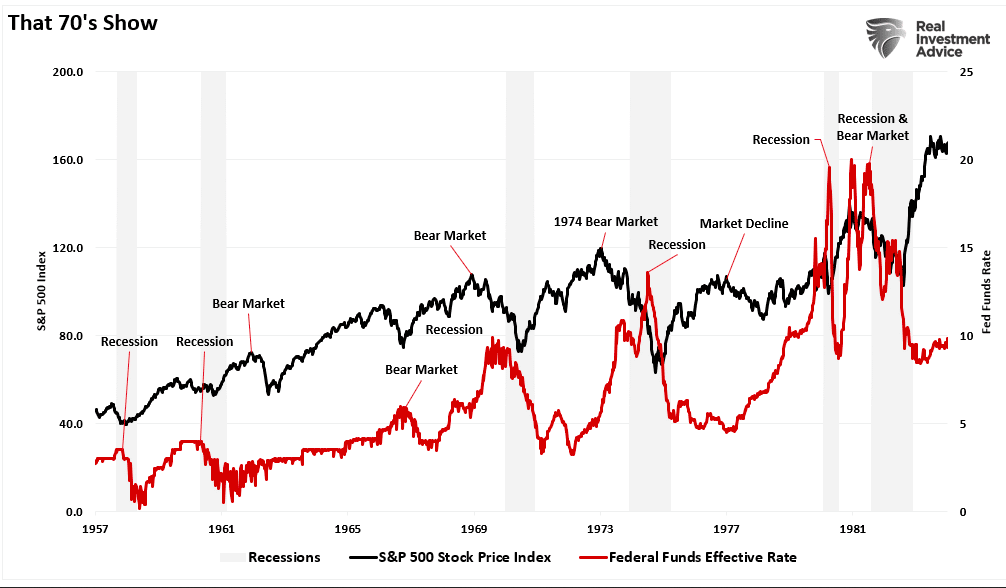
As a reminder, it was not until Paul Volcker sent interest rates to the moon that inflation finally ended in the early 1980s.
When examining the technical underpinnings of the market, mainly since the turn of the century, the influence of monetary policy’s “invisible hand” is evident. Market corrections, and bear markets, were bailed out by monetary interventions, zero interest rate policies, and meager inflation. Not since the ’70s have we witnessed a market where the Fed (with Volker as chairman) tightens monetary accommodation and increases rates to combat high inflation. The chart below is a reminder of what happened then.
RECESSION
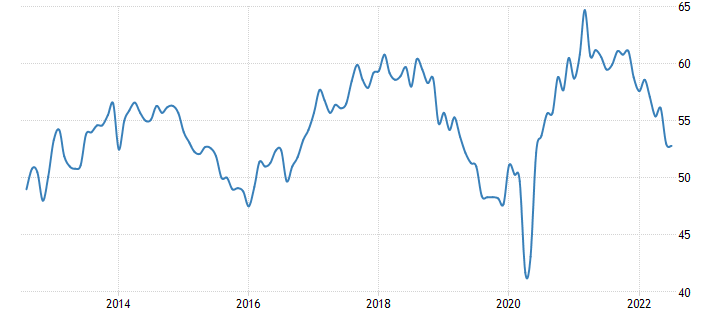
The ISM Manufacturing PMI edged lower to 52.8 in July of 2022 from 53 in June, beating market forecasts of 52. The reading pointed to a 26th straight month of rising factory activity but the weakest rate since June of 2020, as new order rates continue to contract although supplier deliveries improved and prices softened to levels not seen in two years.
According to our ABS Matrix we are going more defensive
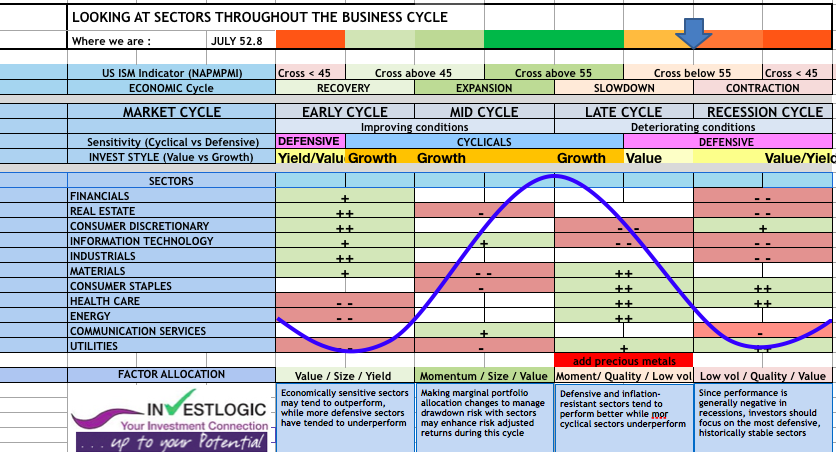
To be defensively positioned, in the health care sectors we would favor
- Pfizer as the company really transformed itself, it is now leading the pack.
We also like Utilities and Staples.
- Procter & Gamble is must own as its businesses are essentially non-cyclicals,
as well as basic materials
- Freeport McMoran is inexpensive based on mid cycle earnings. It is the premier coper stock in the world and we are bullish copper.
and energy
- Chevron has one of the most capital disciplined energy companies and has a strong balance sheet and a huge buyback program-.
Getting back to the Federal Reserve, the chart below (courtesy of the St. Louis Fed) illustrates that while the Fed has been increasing interest rates it has also been reducing the money supply by the biggest year-over-year percentage since the early 1990s. Such sharp percentage declines in the money supply are almost always associated with an economic recession
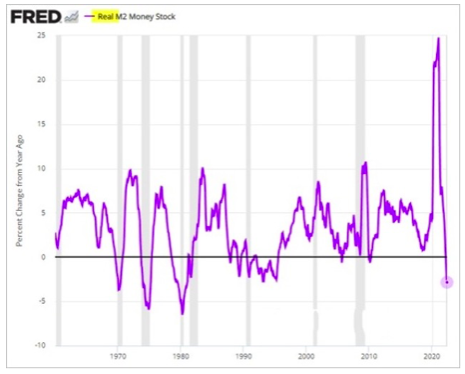
We encourage readers, who have an interest, to visit the website of the St. Louis Fed for it contains a wealth of economic and market information available at no charge.
Last but not least, an interesting research from Bridgewater (Transitioning to Stagflation) points to the difference between what is likely to transpire in the near term and what is discounted is the strongest near-term stagflationary signal in 100 years, shown below.
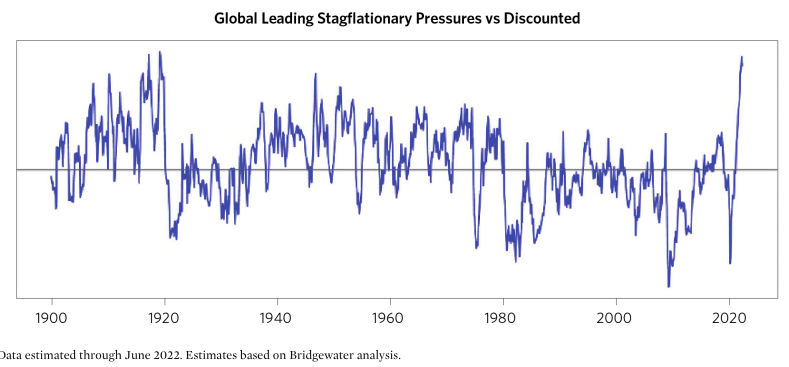
Longer term, as we play it out in our minds, we doubt that policy makers will be willing to tolerate the degree of economic weakness required to bring the monetary inflation under control quickly. More likely, we see good odds that they pause or reverse course at some point, causing stagflation to be sustained for longer, requiring at least a second tightening cycle to achieve the desired level of inflation. A second tightening cycle is not discounted at all and presents the greatest risk of massive wealth destruction.
Happy trades


