

MARKETSCOPE : Sailing the Storm
November, 07 2022
The Market is Always Right
We Cannot Command the Winds, But we Can Adjust the Sails

The ocean below the giant mass of air in movement starts to sense an instability. Something is happening on the surface. The wind irritates the ocean. It puts it in tension, curls it and agitates it; alters it. It starts slowly at first. The ocean feels an almost imperceptible breeze, but something is happening in the atmosphere above. The ocean (market) knows something is about to happen and gives the first hint to the sailor (investor).
The sailor starts to get ready. He checks the weather situation one more time and estimates the winds intensity. He decides to change out the Genoa for the storm jib and reduce the main with two reefs. He gets back to the helm, and clips in the harness.
The storm arrives suddenly, the clouds competing above and crashing between them. The ocean suddenly begins to be desperately pushed by the wind.
The sailor standing at the helm fights to keep the boat on course. The waves crash against the ship; angry. The foam tries to cover it all. The ship resurfaces behind every wave trying to recover, but falling again into the mouth of the next wave. Everything is chaos. The harmony that existed between the elements has disappeared. Everything is altered now. Nothing seems to have any logic. There is no answer. How can it think the sailor? A few minutes ago everything was organized and in harmony, but now…
…He closes his eyes and breathes. One wave passes and he starts counting 1, 2, 3, 4, 5 … The next wave arrives at 10 seconds. He starts again, 1, 2, 3, 4, 5…, again at 10 seconds. He notes that out of every five waves, the third wave appears bigger than the rest. -Doesn’t it ring a bell ?-
There is an order to the chaos.
The wind is keeping its course which is good. There are gusts but they too have a rhythm. There is an order there as well. The sailor starts to follow the new rhythm marked by the ocean and the wind. The boat begins to find its position in this new structure.
The harmony that disappeared, reappears again but everything is different. Different, but at the same time beautiful in its own way.
Now the elements are working together again, as a team, in rhythm. Everything starts to feel natural. The stress has passed, the traumatic situation has disappeared and there is a new order. The sailor begins to enjoy what the storm is offering.
It is Investlogic ambition to keep the ship heading forward and share it with our subscribers crew. It is even more true in rough seas !
ROLLER COASTER
Markets had a series of up and down sessions last week, with bad news pushing indexes up and good news pushing them down. The world is upside down… Well, maybe not: the market seems to be clinging to the narrative that if the economy is losing momentum, then the Fed will come to its rescue.
On Wednesday, the U.S. central bank seemed to pave the way for a slightly less restrictive policy in the future, after raising its rates by 75 basis points. But statements by the Fed boss right after the announcement cooled investors.
It is that kind of a day …again ! post FOMC
On Friday, the monthly employment report pointed to 261K new jobs added for October, above the 210K that economists were expecting. These numbers were offset slightly by a bigger-than-expected increase in the unemployment rate, which rose to 3.7%, up from 3.5% in the previous month.
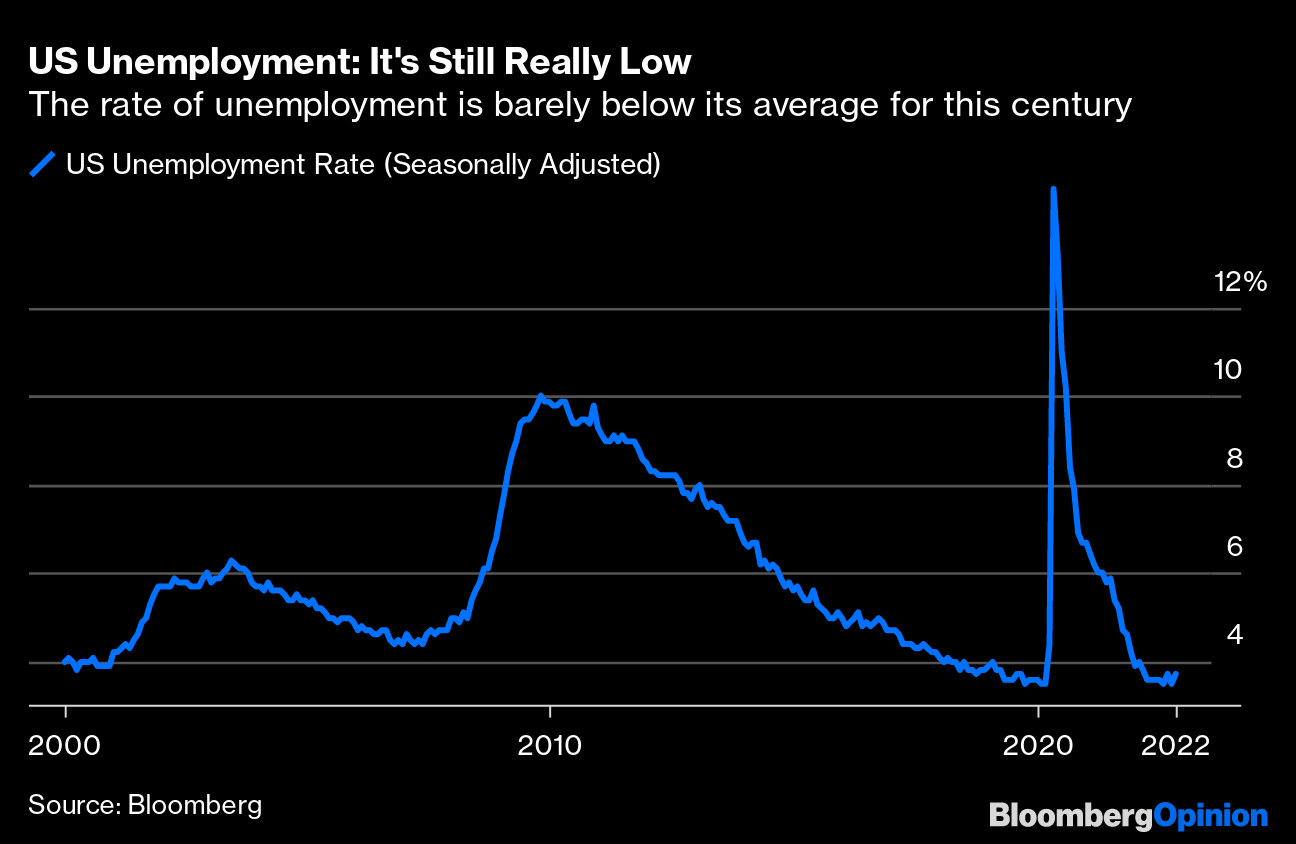
The slight rise in the US unemployment rate rekindled the flame of hope: after all, if the overheating of the labor market starts to cool down, the FED might not need to be so hawkish.
Investors had been widely anticipating a 75-basis point rate hike, by the Fed, the fourth straight increase from the central bank of that magnitude as it attempts to bring down stubbornly high inflation. The target federal funds rate was set in a range between 3.75% and 4.00%, but the impact of the hike has been initially tempered by new language that suggested the central bank was mindful of the effect its outsized rate hikes have had on the economy.
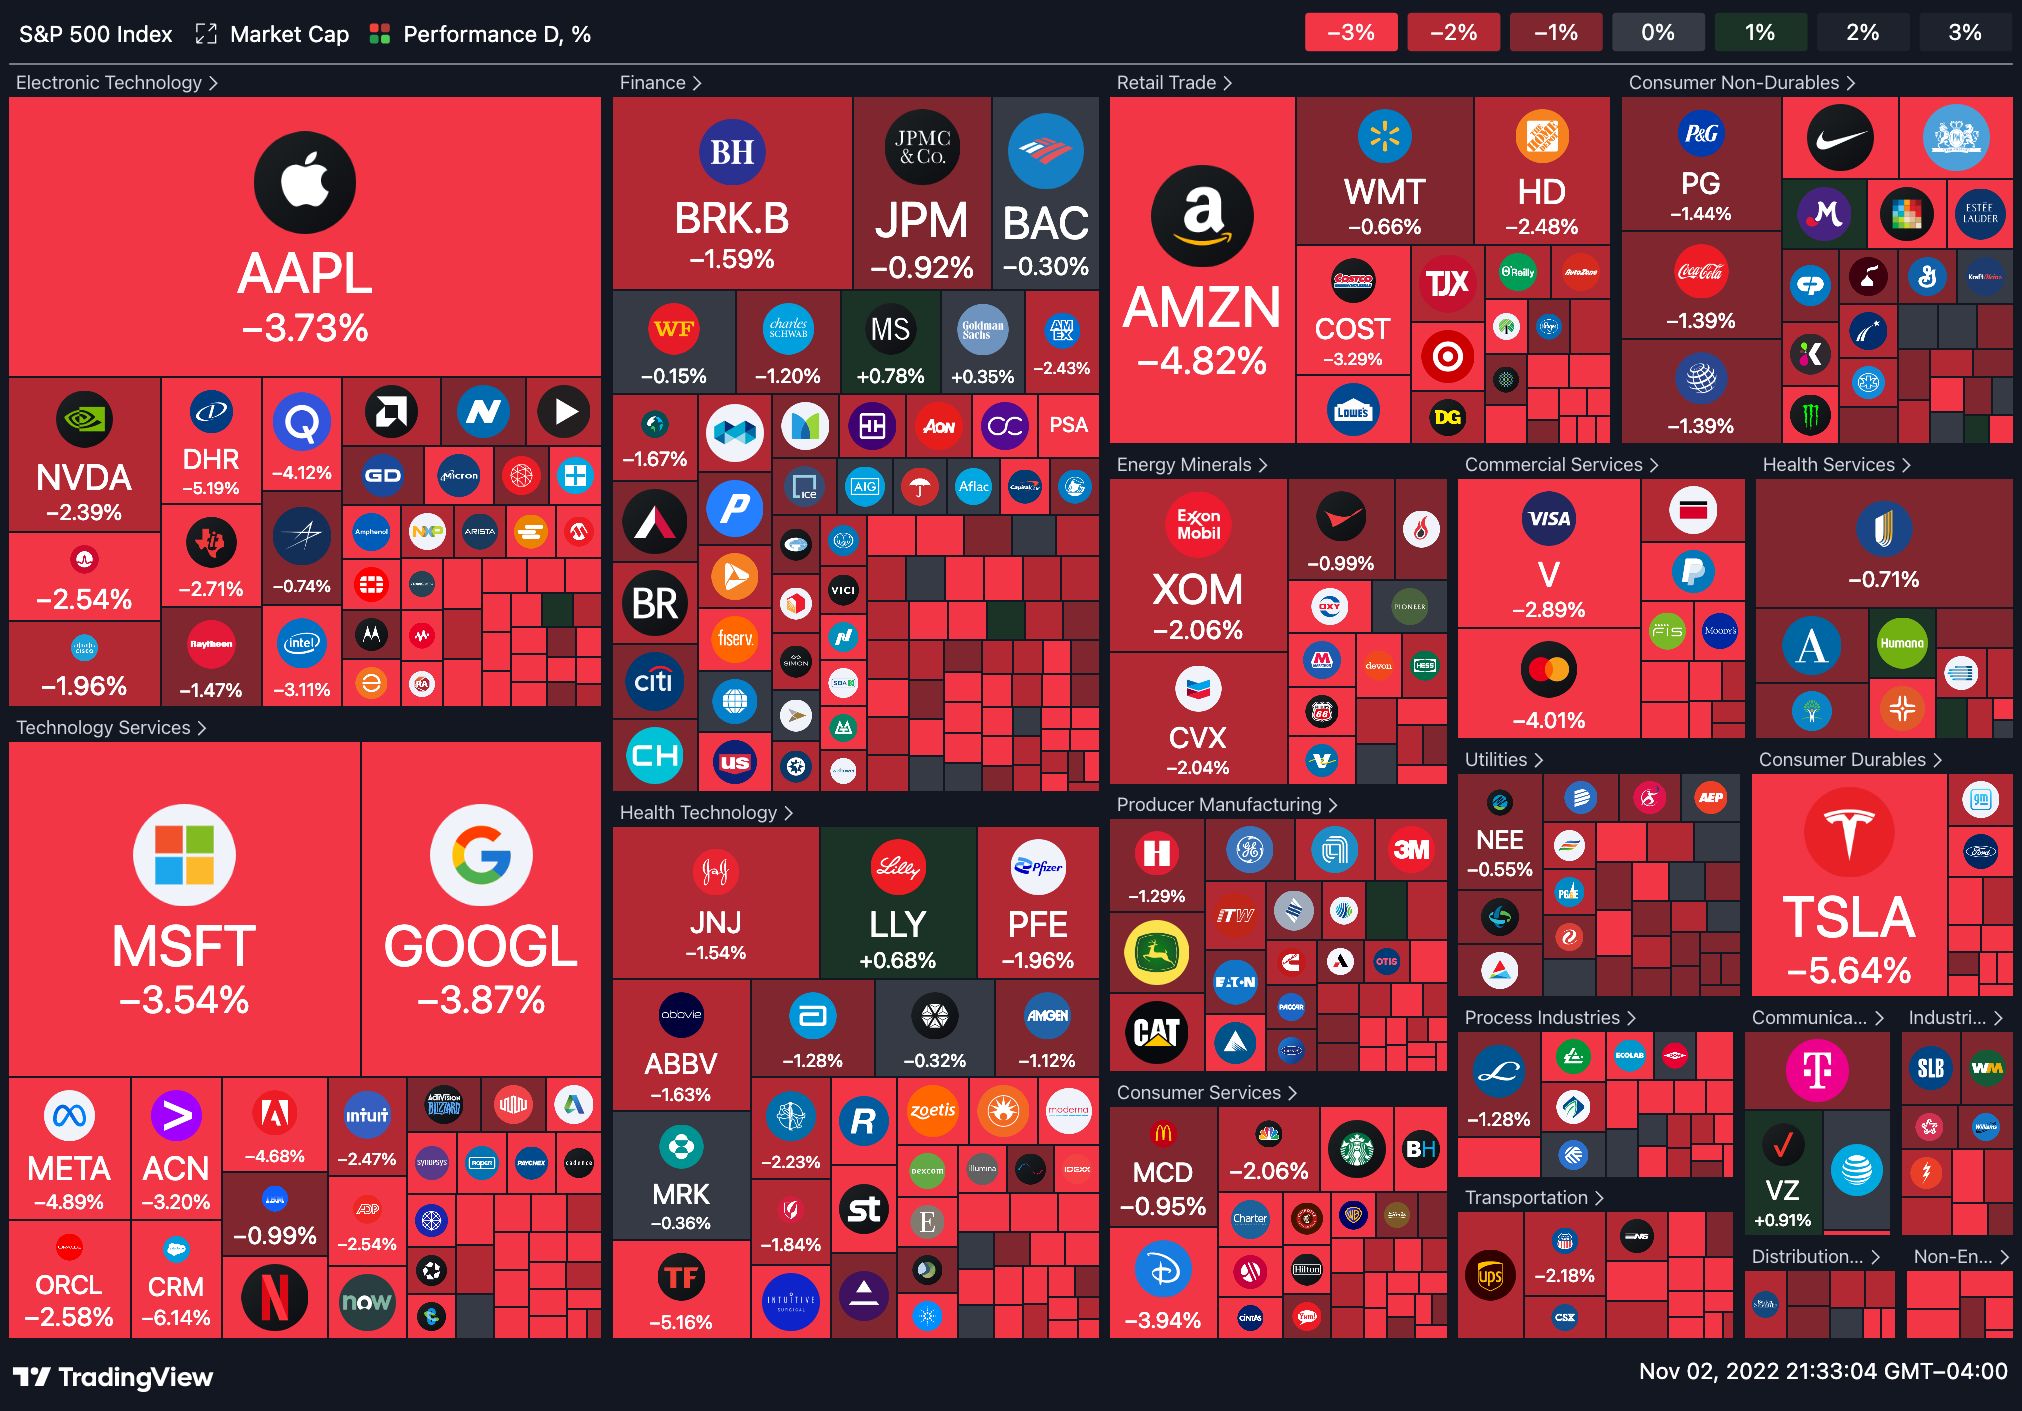
 Stocks finished Friday with modest gains. The advance allowed the major U.S. equity averages to break a four-session losing streak, but remained in negative territory for the week, impacted by technology stocks.
All 11 S&P sectors posted gains. This was led by a 3.4% advance in Materials. Communication Services and Info Tech were also strong, bouncing back from recent weakness. High beta software names were hit by a couple of poor earnings reports yesterday and the sector then provided a source of funds for investors chasing the major indices up later in the day towards the close.
In Europe, shares rose for a third week running. In the UK, the BoE increased its benchmark interest rate by 0.75 percentage point to 3%, the highest level since 2008, to contain inflation. Lagarde said the ECB could not simply mimic the Fed because economic conditions were different in the 19-country euro zone “We have to be attentive to potential spillovers,” Lagarde told a conference in Riga. “We are not alike and we cannot progress either at the same pace (or) under the same diagnosis of our economies.”
China’s stock markets rallied (+5.3%) amid speculation that the country was preparing to relax its zero-tolerance approach to the coronavirus.
MARKETS : The Bear Truth
Investors need some time off after a topsy-turvy year, but things may not be better at the local amusement park. Fed Chair Jay Powell took the market on another rollercoaster.
Notably, the market defended the important 20-dma moving average, keeping the bull market rally from the September lows alive. However, the MACD “buy signal,” which signaled the start of the most recent rally, is dangerously close to flipping.
It did for the NASDAQ as we are close to retest the lows
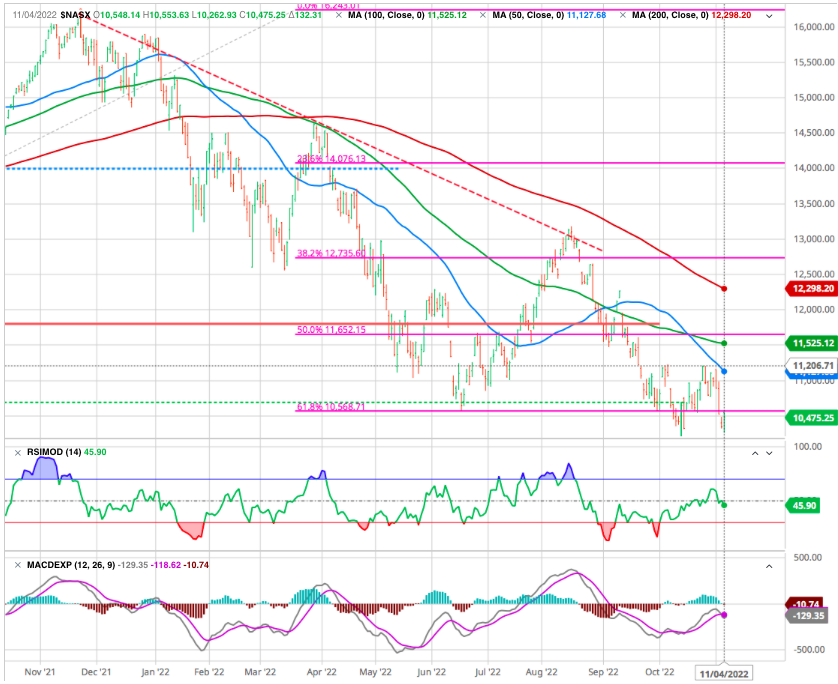
The bear market has NOT reached a bottom.
After a -21% selloff in global stock markets investors are still heavily positioned into stocks versus past bear markets.
‘Asset allocation’ is the process of deciding where to put money to work in the market whether that being stocks, bonds, cash or other financial assets. Investors are still too much positioned in stocks and not enough in cash versus past bear markets
Stock market bottoms are typically associated with retail investors hitting a low point with their stock allocations and hoarding lots of cash.
Here are stock allocation percentages in past bear market bottoms:
Covid crash (2020): 55.2%
Global Financial Crisis (2008 – 2009): 40.8%
Dot Com Bubble (2000 – 2002): 42.8%
Japanese Asset Price Bubble (1991): 42.0%
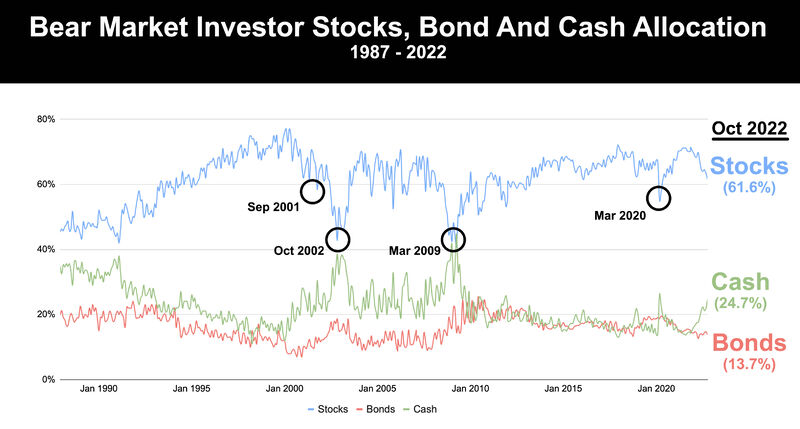
Current (October 2022) stock allocations are still relatively high at 61.4% so we aren’t likely at a market bottom.
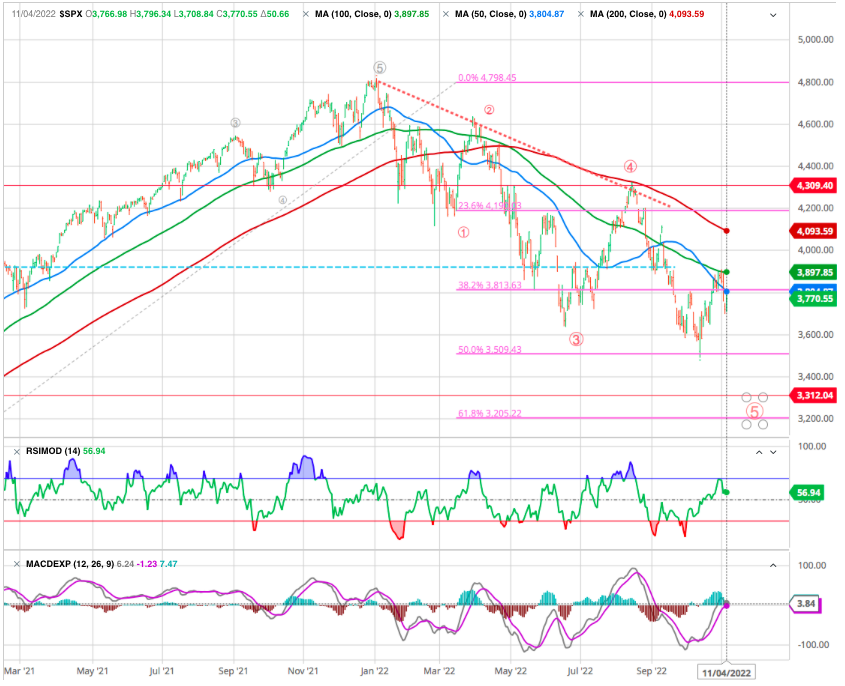
From a long term trend perspective, a prospective crossing over of these longer term moving averages would demarcate this from a shakeout/correction to a proper shift in trend. Once again we share this long term S&P chart and again stressing the rolling moving averages (weekly 50 blue crossing weekly 100 green)to show just how rare this type of sell-off is and how technically dangerous a position the markets seem to be in.
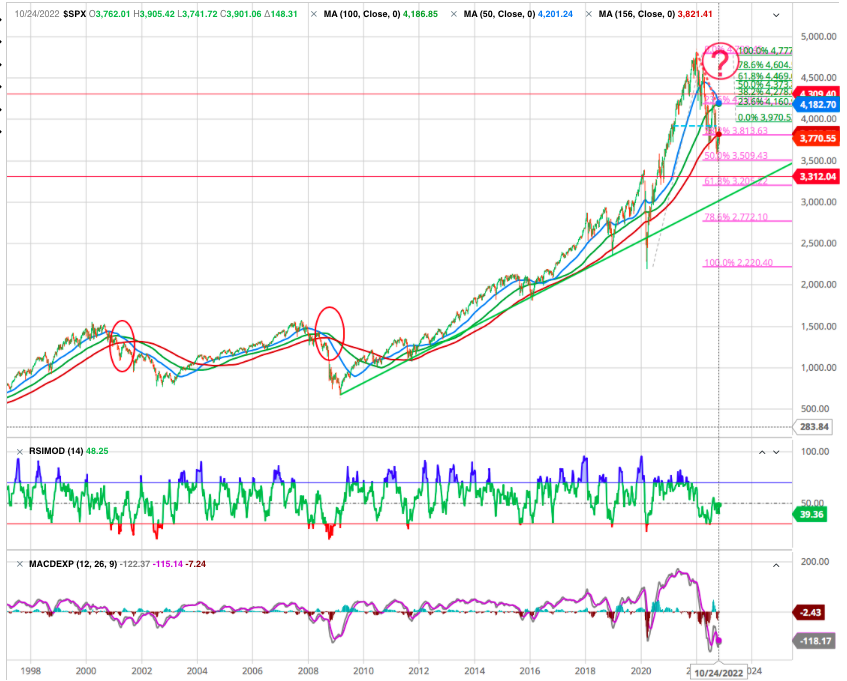
For the time being the L.T weekly 156 MA (red) is acting as a resistance at 3825.
Well stocks would need to stage a very strong rally right about now for these long term moving averages to turn quickly. The last two times these long term moving averages crossed over, a lot of price pain took place.
The Federal Reserve Didn’t Change Course, And Neither Should You
In short, bullish investors were hoping to hear “dovish” news of an upcoming pause or reversal in the Fed’s tightening plans, but what they got was arguably Powell’s most “hawkish” post-meeting press conference of the year. Stocks finally seemed to get the message.
The bottom line is clear:
The Fed will not step in to support the markets until there is clear evidence that inflation is moving back toward its official 2% target OR a severe crisis forces a response. And importantly, it is willing to risk the latter to achieve the former.
In other words, stocks are officially “on their own” for the first time in decades. And as we have consistently reminded you for the past several months, without the Fed’s support, this bear market likely has much further to run. How much further?
Unfortunately, there’s no way to know that in advance. But we can make some educated guesses. From our S&P long term chart we identified :
- Higher probability target area 3200- 3000 = 10% – 15 % from actual level.
- Moderate probability target area 2800- 2600 = 20% – 30 % from actual level.
- Lower probability target area 2200- 2000 = 40% – 50 % from actual level.
We shall also be keeping a close eye on several reliable indicators that have signaled the end of bear markets in the past.
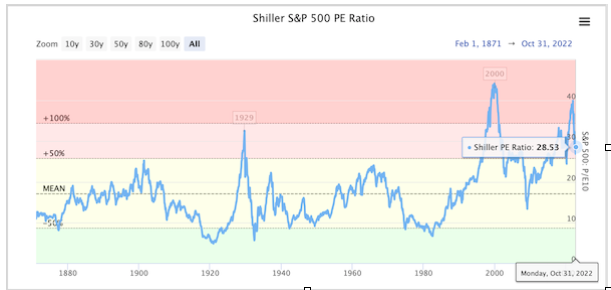
One is a measure of market valuation called the cyclically adjusted price-to-earnings (CAPE) ratio (also known as the Shiller P/E Ratio). The CAPE ratio uses a 10-year average of inflation-adjusted earnings to better account for short-term gyrations in earnings.
This metric is currently around 28 for the SPX. That is down significantly from its recent extreme of 40 last December. However, it’s still more than 50% above the market’s long-term mean.
By this measure, stocks are still closer to historically expensive than historically cheap today. But even that doesn’t necessarily tell the whole story.
Given the Fed’s strong message yesterday, we suspect the bear market could resume immediately. That implies we could see a sharp selloff into the holidays this year.
Market seasonality is generally positive into year-end, so this would be a bit unusual. But it’s not unheard of. As you may recall, the SPX fell nearly 17% between early November and Christmas Eve in 2018.
In any case, a break of the October low in the SPX and other major indexes should confirm the next phase of the bear market is underway and usher in the strongest selling pressure we’ve seen to date.
STRATEGY
check OUR INVESTMENT STRATEGY
Most of our followers are likely already focusing on capital preservation today. If so, there’s no need to make any drastic changes to your portfolio right now. Continue to watch your trailing stop losses on any remaining positions, and don’t hesitate to sell if and when they’re hit.
However, if you are a conservative investor who is still holding a significant portion of your portfolio in stocks today, you could use a break of those October lows as a “get out of Dodge” signal.
In other words, if the three major market indexes close below their recent bear-market lows, you could consider selling most stocks rather than waiting for their individual stop losses to trigger as usual.
The only exception we would make is for energy stocks. As we have mentioned, we are long-term bullish on the energy sector. And more importantly, most energy stocks performed surprisingly well during the first leg of the bear market. They could potentially do so again.
So, we are willing to continue following every individual stops on those positions to ensure we do not sell prematurely.
Midterm elections and stocks
Q4 (October, November, and December) of midterm election years and Q1 (January, February, and March) after the election have historically been the 2 strongest quarters for stock performance of the 16-quarter presidential cycle. The S&P 500 has averaged 6.4% and 6.9% gains during these quarters, respectively. With that said, it’s worth noting that Q2 (April, May, and June) and Q3 (July, August, September) after midterm elections have been among the most volatile.
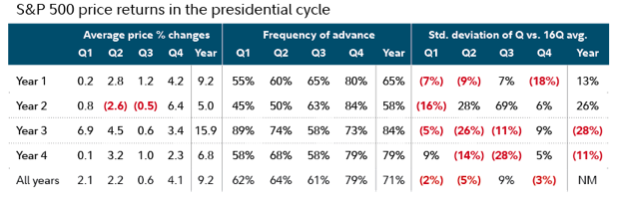
Source : Fidelity
GOLD : Demand from Central Banks
Demand for physical gold from central banks has risen sharply: 400 tons of gold purchased in a single quarter! Demand is four times higher than last year at the same period!
This real rush on physical gold is taking place at a time when gold prices continue to decline. The month of October ended with a new decline, the seventh in a row, which is a record!
Three factors are behind the current decline in gold prices that have caused many managers to take bearish positions in the metal: rising real rates, a rising dollar and a shrinking money supply. But while funds are selling paper gold, at the same time there is a real rush to buy physical gold.
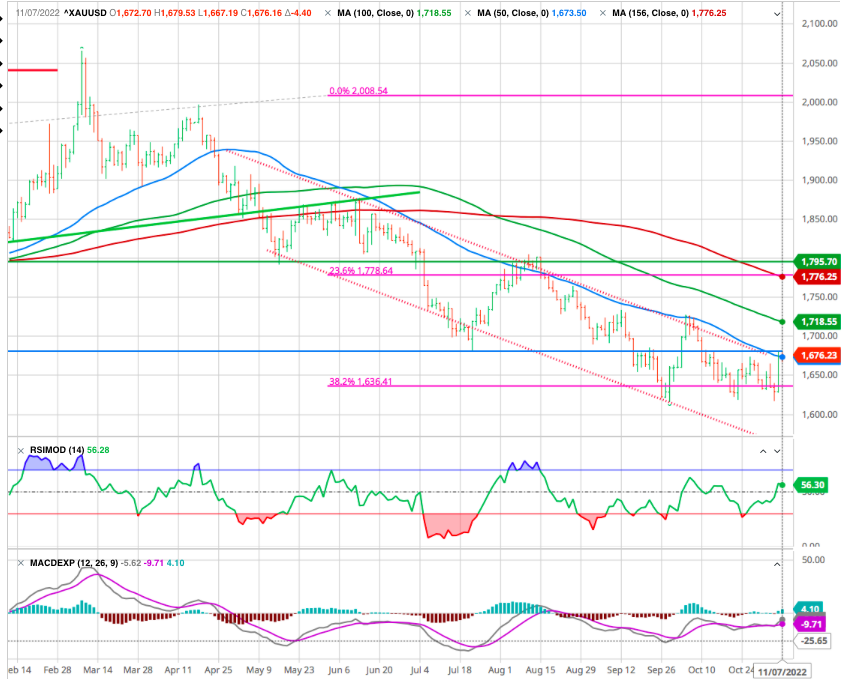
After consolidating on the 38.2 % Fibo correction of the l.t. trend, the metal should break the 1680 level with a close at 1700 to confirm a trend reversal on the upside.
CRYPTOS : Bitcoin Continues To Trade In A Tight Range
This week, bitcoin held up better than US stock indexes by being slightly in the positive around USD 21,000. On the other hand, it is still far from being out of the woods, even if the rebound started last week has given some optimism to crypto-investors.
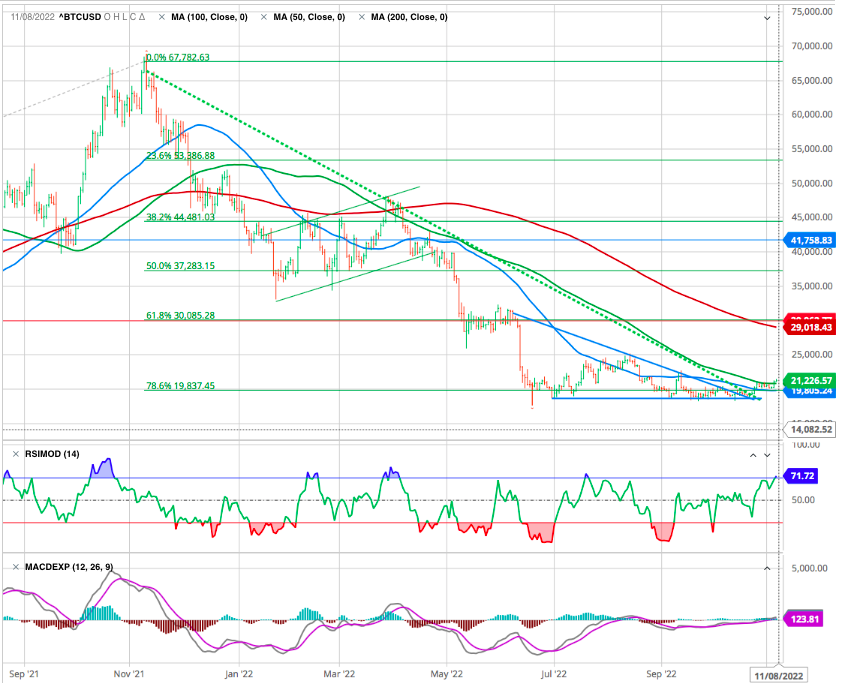
The digital currency is still gravitating not far from its yearly lows and is operating in a macroeconomic environment that is still fragile for risky assets. Bitcoin may take a while to recover as it plays with the nerves of crypto ecosystem aficionados in the coming weeks :
- Long-term holders are trading at a loss proportional to that of previous market cycles, suggesting that, finally, the highest-conviction participants are experiencing losses.
- Short-term holders are at breakeven for the first time since June. Historically, the level at which short-term holders are at breakeven has become “resistance” during bear market rallies.
- Miner balance sheets are underexposed to bitcoin relative to total market cap, suggesting that their selling pressure is and could be absorbed by buyers.
Powell Pivoted to More Hawkish
FED Chair Powell :
“With the lags between policy and economic activity, there’s a lot of uncertainty, so that we note that in determining the pace of future increases will take into account the cumulative tightening of monetary policy, as well as the lags with which monetary policy affects economic activity and inflation… that’s why I’ve said at the last two press conferences that at some point it will become appropriate to slow the pace of increases. So that time is coming, and it may come as soon as the next meeting or the one after that.”
“We may ultimately move to higher levels than we thought at the time of the September meeting. The incoming data since our last meeting suggests the ultimate level of interest rates will be higher than previously expected. The risks are asymmetric. If the Fed does too much, it can cut. If it doesn’t tighten enough, then you’re in real trouble… It is very premature to be thinking about pausing… We think we have a ways to go.”
Powell and Co. will be watching the data and evolving market conditions before making any significant pivot. The Non-Farm Payrolls report for October is out tomorrow, followed by the Consumer Price Index on Nov. 10, and Personal Consumption Expenditures on Dec. 1. The latter is the Fed’s preferred measurement for inflation as it captures changes in consumer behavior and has a broader scope than the CPI.
Happy trades