MARKETSCOPE : Real ? or Fantasy ?
November, 14 2022More Blue Pills !
When the actuary tables say you ought to be dead, what are you going to do? Take Bullgenix its better than hoping for a fed pivot, that would not help anyway.

“Explosive,” “shock” and “relief” are some of the adjectives being used to describe the rally on Thursday as stocks recorded their best session since the early days of the pandemic in 2020. US equities recorded strong gains and bond yields fell as investors celebrated reassuring inflation data. The headline CPI rose yoy to 7.7%, the slowest increase since January. The yoy core (less food and energy) reading fell back to 6.3% from a 40-year high of 6.6% in September.
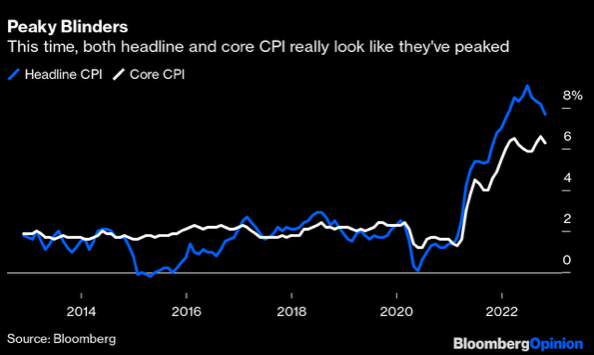
Wea re still a long way from inflation levels getting anywhere near the Fed target of 2%, but most would agree that we have reached the peak and are moving down the other side of the mountain.
 The S&P 500 recorded its best week since June and hit its best intraday level in two months. Growth stocks — tech in particular— benefited the most from falling yields. U.S. Treasury yields fell sharply in response; the 10-year U.S. Treasury note yield ended Thursday at 3.81%, down from 4.17% at the end of the previous week and the US Dollar Index had its 9th largest daily decline since 1980.
Outside of the large cap space where growth has lagged value badly, in the mid and small cap space, performance in Q4 has been roughly equal, although YTD, value stocks have handily outperformed their market cap peers.
On a sector basis, Technology led the way higher rallying over 10% this week, and although every sector was higher, there was a ton of dispersion in this week’s returns, continuing a trend we have seen all quarter and all year.
In the short term, however, investors certainly reacted as though a new world was upon us. But from strictly a technical perspective, the downtrend that has been in place all year remains intact. A rally like this is of course very dramatic to say the least, but you have them all the time in a bear market. The burden of proof still remains firmly on the bulls.
On a fundamental perspective the moderation in prices could give the Fed more breathing room in terms of slowing down the pace of its aggressive rate hikes. Some Fed officials even hinted to a downshift following the data, like San Francisco Fed President Mary Daly and Dallas Fed President Lorie Logan welcomed the most recent inflation data, but warned that the fight with rising prices was far from over.
Moving from 75bps rate hikes to 50bps in December is still a significant “aggressive action” that will impact economic growth in 2023. The Fed is still actively rooting for a weaker stock market and economy.
All eyes will be on the retail sector this week with big reports due out from Home Depot Lowe’s , Walmart , Target , and Macy’s. The retailers step up to the earnings plate with investors looking for signs of the health of the U.S. consumers and just how promotional the holiday season may be with inventory an issue.
In Europe the STOXX Europe 600 Index ended the week 3.66% higher. Shares in China received a late boost from the surprise drop in U.S. inflation but trailed most other global markets as investors worried about new signs of economic fragility.
Of course the main event was the collapse of the FTX platform, the second largest platform in terms of trading volume, the entire cryptocurrency market has shed $2 billion. On Friday, FTX filed for Chapter 11. Sam Bankman Fried resigned. Billions of customer assets are caught up in the crypto exchange’s epic mismanagement.
MARKETS : Wishful Thinking
From a technical perspective, the market tested and held crucial support again at the 20-dma after the FTX (cryptocurrency) blowup on Wednesday. The subsequent rally off support turned our MACD “buy signal” higher, keeping it intact, and the market cleared critical resistance at the 100-dma. Such now sets the stage for a rally to the 200-dma between 4000 and 4100.
The surge in asset prices also cleared levels inducing one of the most impressive short squeezes in financial history that are now forcing short-sellers to cover positions which will add “fuel to the rally” over the next few days.
With $2 trillion in crypto market cap … GONE and $10 trillion in aggregate equity market cap gone … GONE… Liquidity may become a major headwind for stocks heading into year-end, it may be more likely the market will see a new low.
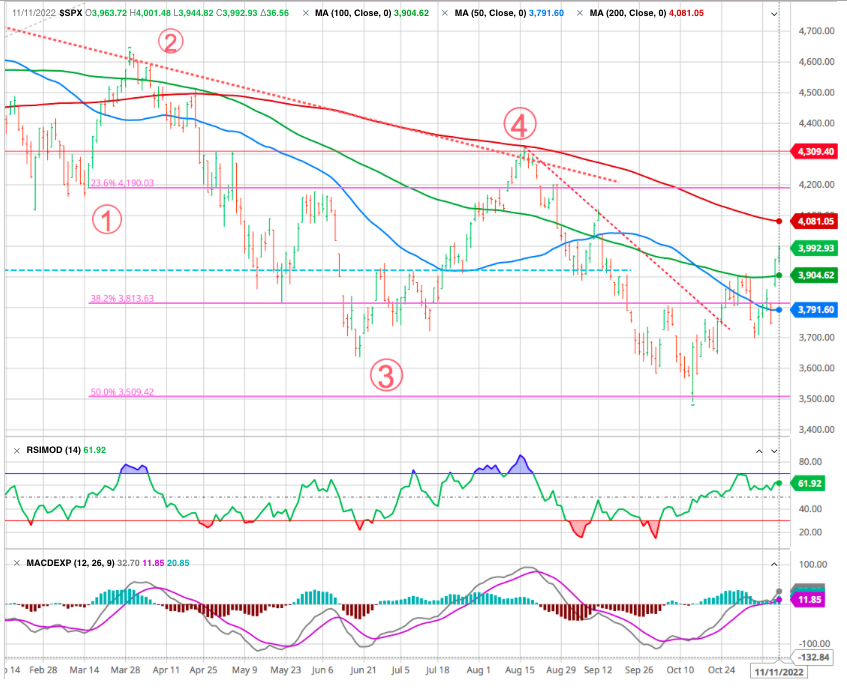
One positive about the more recent pattern for both indices applies to the shorter-term downtrend (dotted red liine) from the August highs. Both the S&P 500 and Nasdaq broke above these downtrends in late October, but in the subsequent pullbacks found support at the prior downtrend. That’s typically considered a positive from a technical perspective, and these higher lows could set the stage for a more durable foundation.
Moreover the broader market internals have been improving as the list of stocks making new lows continues to shrink and the percentage of stocks trading above their 200-DMA expands to a majority (chart above). Its highest level since last April.
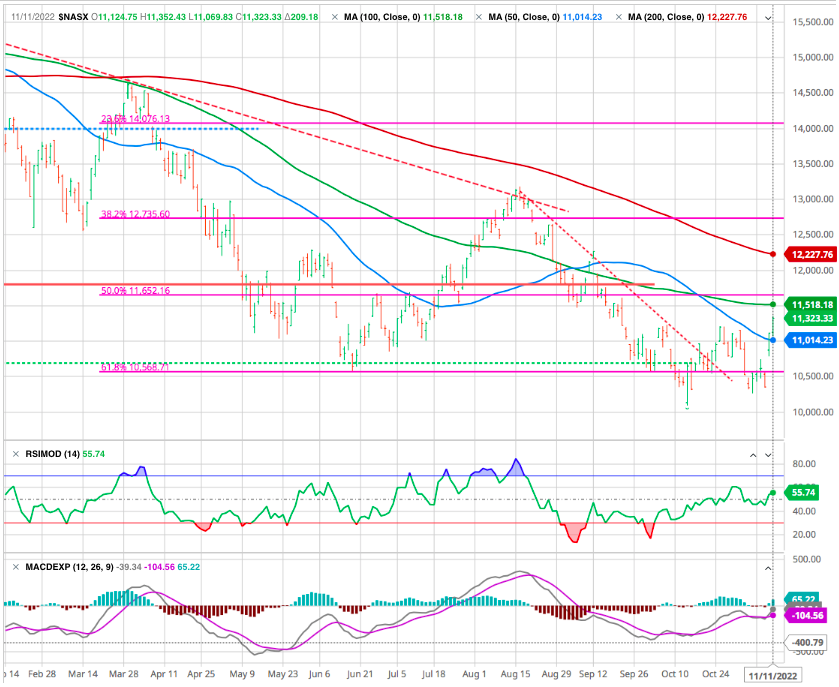
Following each of those prior rallies, though, both indices went on to make new lows, so a big rally alone isn’t enough to indicate that the ‘bottom is in’.
From a technical perspective, the downtrends that have been in place all year remain intact. Given the sharp declines following each prior peak, if the S&P 500 and Nasdaq test the top of these downtrends in the future, investors will want to watch closely to see the reaction. We are also seeing a significant divergence in the price action of the three major indexes since the October lows.
The Dow Jones, S&P 500, and Nasdaq all rallied together through the end of October. However, for the past couple of weeks, the NDX has been lagging behind the others. And as you can see below, this morning’s rally pushed the DJIA and SPX to new recovery highs, while the NDX remains well below its prior high.
Of course, this recent divergence doesn’t guarantee a bearish outcome. But given the low probability of a Fed pivot – as well as the still-bearish message from our indicators and other reliable bear-market signals we are following – we are willing to give it the benefit of the doubt for now.
If last week move higher is quickly reversed, it will add further weight to this divergence signal and suggest that the recent rally is exhausted. We shall then watch for these indexes to move back below their Oct. 13 lows to confirm the next phase of the bear market is underway. Because these general price areas have now been “tested” several times – first in June and then again in September and October – a break of these levels is likely to lead to a violent move lower.
On the other hand, if the NDX joins the DJIA and SPX at new recovery highs, it would lower the odds that the bear market was resuming immediately. And given positive seasonality, it could indicate the rally was likely to continue through the holidays into a year end rally.
Soaring U.S. tech stocks leave some investors doubtful rebound will last.
Hopes that inflation is subsiding are fueling a surge in battered technology and megacap stocks, though some investors believe still-high valuations and doubts over the companies’ earnings outlooks may make a sustained reversal elusive. Tech sector valuations remain well above the overall market, while analysts are dimming their profit outlooks for the group.
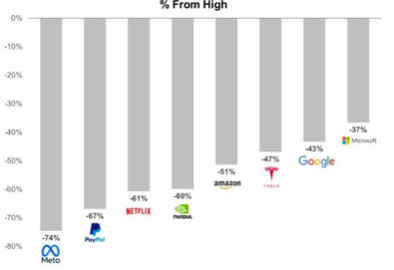
Some of the former leaders highlighted above have already fallen substantially, while those that have declined the least are vulnerable to further downside before this bear market is over.
SOXX
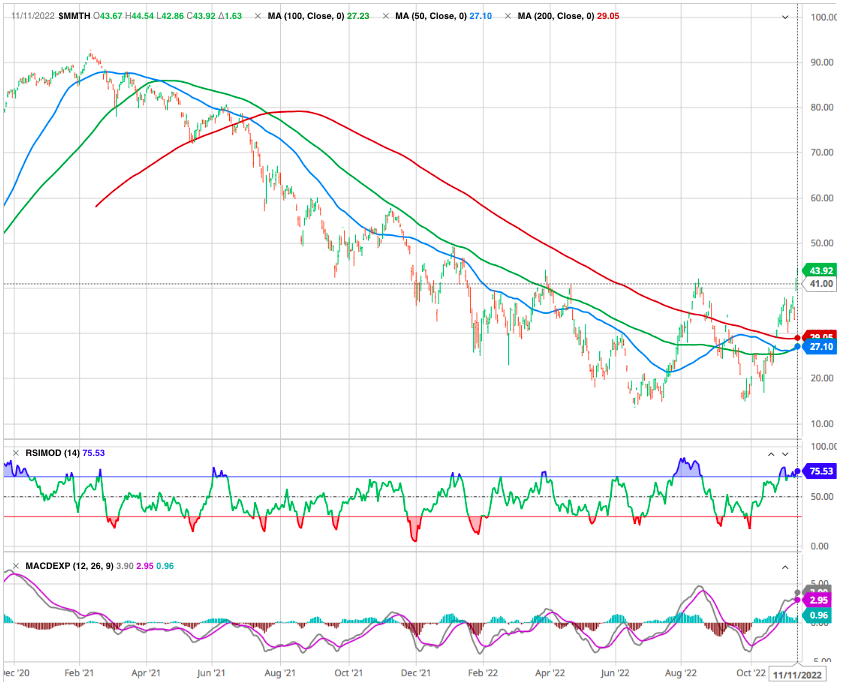
Semis had a monstrous week and are closer to breaking their downtrends >> see below green circle at 378. Some of the gains we have seen in semiconductor stocks over the last week are unbelievable. On Thursday, the Philadelphia Semiconductor Index was up over 10%, and over the five trading days through 11/10, the index was up over 16%. In early afternoon trading on Friday it was also up over 2%. With gains like that, you can only imagine how some of the individual components of the SOX have performed.
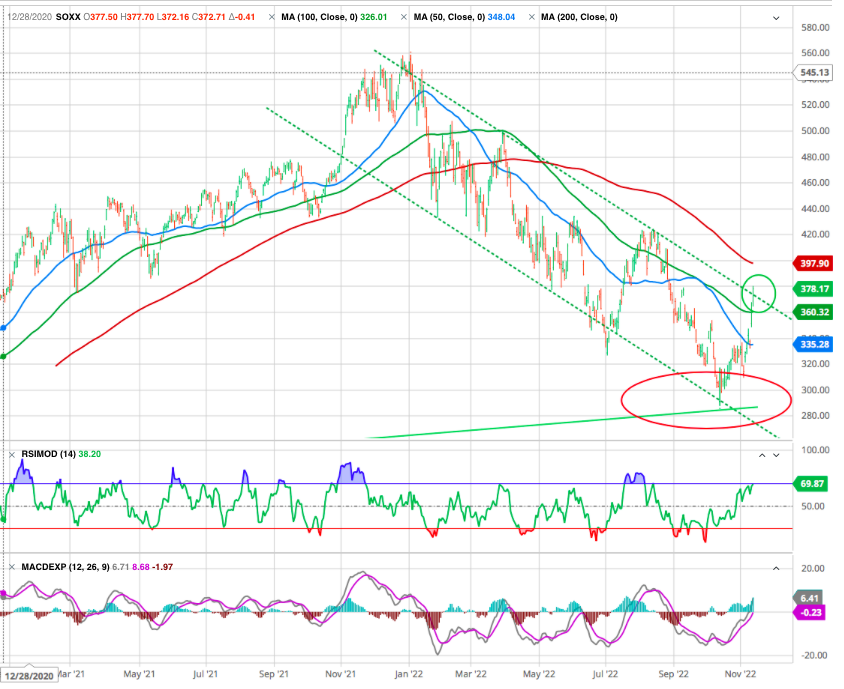
All the 15 largest stocks have experienced double digit moves, and four were up over 20% in the prior five trading days. Even Intel (INTC) was up over 10%! Shifting focus to the semis more broadly, even after this week’s rally, the SOX remains mired in its downtrend that has been in place all year (lower left chart).
There’s a decent potential that the growth/value dynamic could shift if investors truly start to believe that inflation has peaked and we’ve reached peak hawkishness. But those long-term trends are awfully hard to stop once they get rolling like this, so we are not entirely sold that one CPI print is going to totally change the longer-term factor preferences.
They may be far fewer in number than they used to be but traditional value investors are still out there, harnessing the power of “the force” in markets. Investors still interested in “thinking” their way to wealth (rather than giving in to the dark side) would do well to learn from these masters of their craft. Because the opportunity set may be greater today than ever before.
Banks And Brokers On Fire
The Financial sector ETF (XLF) has been on fire since its intraday low of $29.59 on October 13th, which was the day of the hotter than expected September CPI report. The ETF is currently at the very top end of a wide sideways range that has been in place over the last six months. (BLUE SOLID LINE).
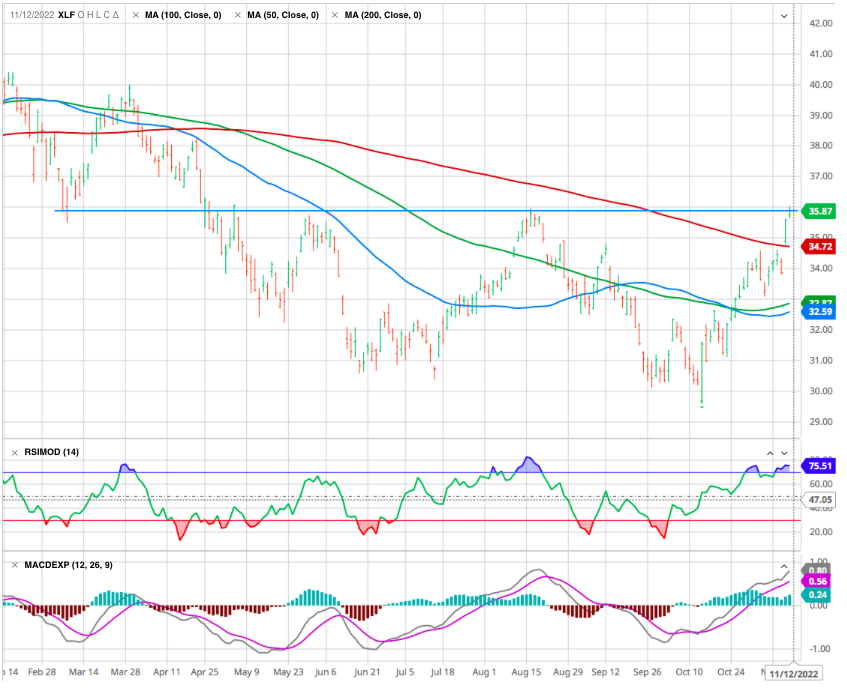
Investors have seemingly been loading up on them with short-term Treasury yields now significantly higher than the interest rates these banks and brokers are paying customers on deposits.
STRATEGY
Again, given the bearish headwinds mentioned earlier, we believe this is extremely unlikely. But we will not be dogmatic if our tools begin to send a more positive message.
We suggest selling into rallies to raise cash, reduce exposures, and rebalance risk accordingly.
The smartest decision for traders and investors may be to sell into strength and patiently wait for more damage in the economy before moving back to fully-invested positions.
GOLD
Gold recorded another weekly bullish streak as it broke through the USD 1,700 per ounce mark. as obwerved in our last week marketsope. Our next targer would be the next reistance close to the 61.8% fibo corrrection of the last wave down at USD /oz 1850 level.
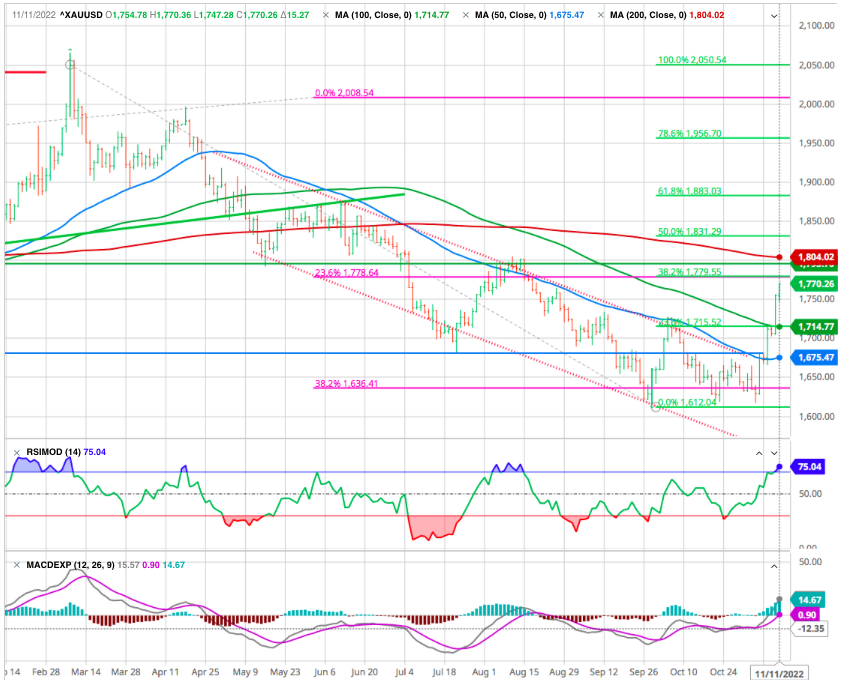
Is it Time to Buy Gold?
- The waning momentum of the US Dollar Index is notable
- This is warranting a dollar downgrade from bullish to neutral
- The dollar demise has been influencing other trends , calling for a regional exposure shift from the US to Europe ex-UK, and a focus on emerging markets and gold, both candidates for future upgrades.
- The fact that precious metals have despite their relatively strong performance, disappointed so many investors is to be viewed positively.
CRYPTOS : That bubble is popping.
Election day and crypto drama.
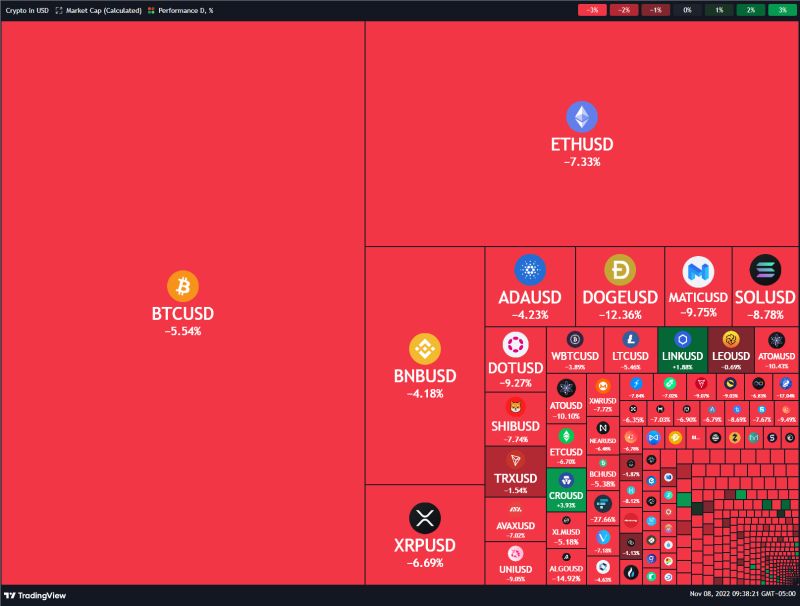
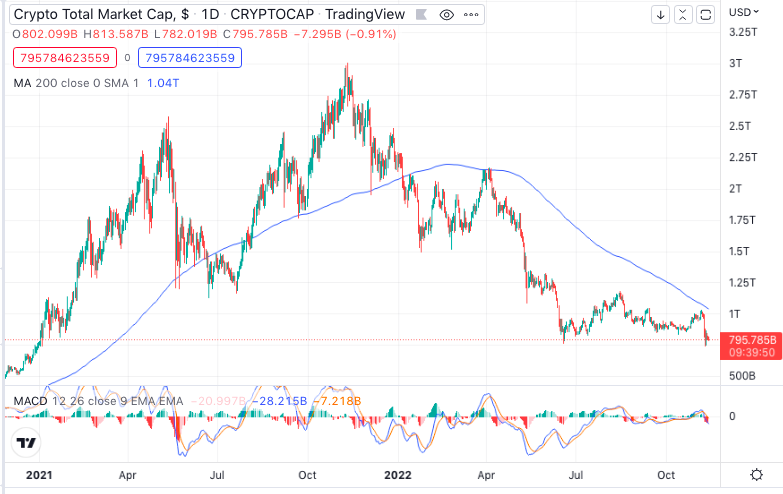
This was a difficult week for digital currencies. In the wake of the collapse of the FTX platform, the second largest platform in terms of trading volume, the entire cryptocurrency market has shed $2 billion.
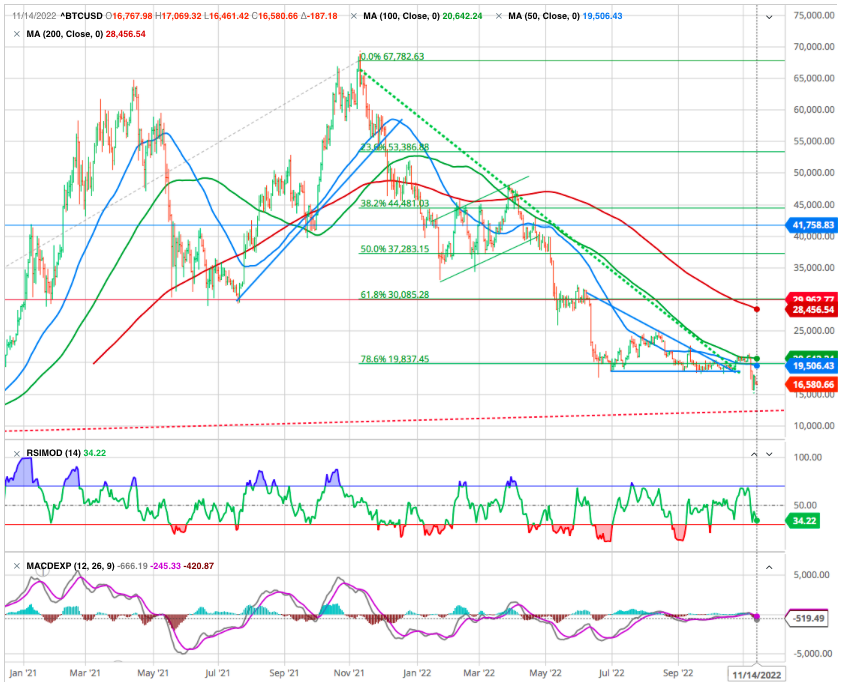
In the general panic, bitcoin has fallen by 20% since Monday and is now back around $16,500. A level it had not revisited since late 2020. We have been uber bearish on crypto assets since Bitcoin fell to $47,000 from its $69,000 high and our allocation to this asset class is precisely zero and will remain zero. We are looking toward a next support of US 12’500 as it corresponds to the long term uptrend (dotted red line).
The crypto winter just turned into an ice age where even the monster digital polar bears and bulls are frozen with shock and awe. We do not yet know all the collateral damage that will cause the bankruptcy of FTX, but this event will leave a mark in the history of crypto-currencies. In the meantime, crypto-investors are seeing their digital windfall melt away like snow in the sun.

You can bet your last Satoshi that we have not eaten the last of the poisoned icing on the crypto cake. P. T. Barnum, the founder of the famous circus was so right – “there is a sucker born every minute” – every second in Cryptoland!
FED : Weaker Inflation Won’t Stop The Fed
AS Lance Robert from RIA cautioned : the more bullish market participants should be aware the Fed is ultimately pushing for lower stock prices. The Fed is removing liquidity by reducing its balance sheet twice as fast as in 2018.
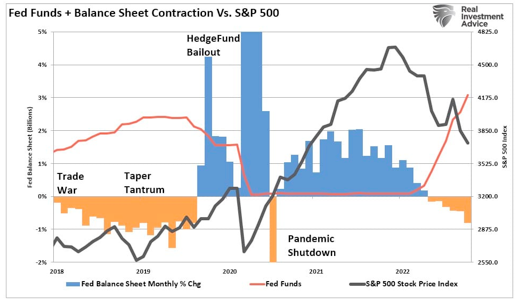
Therefore, it will not be surprising to see Federal Reserve speakers try and swat down asset prices with continued hawkish rhetoric. As far as a “pivot” goes, that still seems to be quite a long way off.
Fed Chair Powell
“And the last thing I’ll say is that I would want people to understand our commitment to getting this done. And to not making the mistake of not doing enough or the mistake of withdrawing our strong policy and doing that too soon. So those, I control those messages and that’s my job.“
For those who don’t remember, the last QT ended in a 20% market plunge over three months. Today, even with weaker inflation, QT is not ending anytime soon.
And do not forget that a Fed’s pivot does not necessarily imply a bull run.
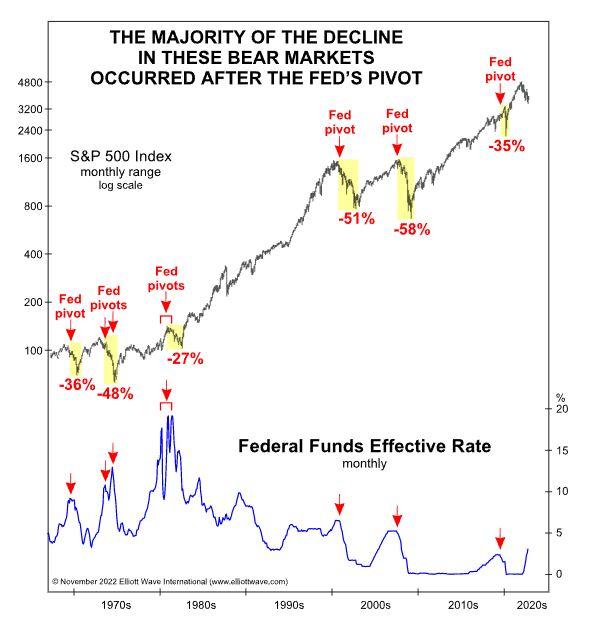
Source: Elliott Wave International
see also our MARKETSCOPE Pivot or not Pivot
Historically, stocks DO bottom and reverse higher near the middle to end of a recession (which has not even begun into November), weeks or months after the Fed has “pivoted” from raising rates to cutting them dramatically.
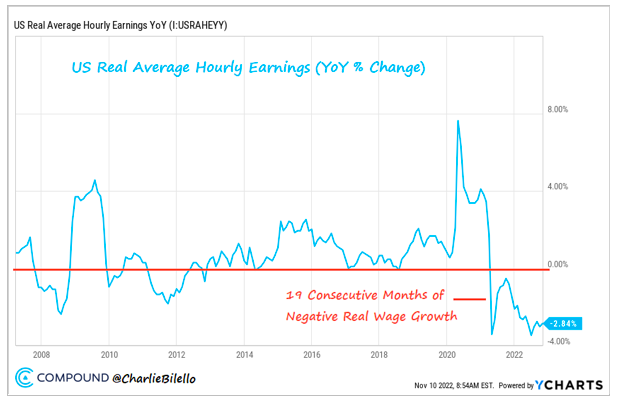
One important guidepost will be when wages outpace inflation again, something we haven’t seen for 19 months in row (a record). This is a decline in prosperity for the American worker (erosion of purchasing power) and is the primary reason why the Fed will continue to hike rates.
Happy trades


