MARKETSCOPE : MACRO MATTERS
September, 11 2023Good News Is Bad News
With Labor Day over, time to go back to business. Thus, it seems a good time to end the summer recess of our Marketscope and get us all back on track with what has been going on.
It may happen that this particular issue flashes back less on the past weeks’ sessions and focuses more on the latest trends and data just gone by last months, just to reboot us all and bring us up to speed.
Equity markets suffered a few setbacks after a fairly calm summer period. In particular, there was a pronounced selloff after Fed Chair Powell delivered a hawkish message in his speech at Jackson Hole -see 2nd part-.
In his remarks, Powell said that getting back to price stability would “likely require maintaining a restrictive policy stance for some time”, which in turn triggered substantial losses for markets as they began to price in a faster pace of rate hikes.
In the US, the services sector performed better than expected in August, while weekly jobless claims were lower than expected, fueling fears of higher rates over a longer period.
US employment figures highlighted a cooling of the job market, Investors continue to favor a central scenario based on three pillars: the end of the monetary tightening cycle followed by a rate cut as early as 2024, a soft landing for the US economy and inflation under control.
In its effort to squash inflation by jacking up interest rates, the Fed has wanted to see more slack in the jobs market. Indeed, an overall imbalance between labor demand and supply is causing wages to remain elevated, but a batch of data this week has pointed to just what the Fed wants to see: moderating labor demand.
A latest report showed Personal Consumption Expenditures (PCE) inflation ramped up in July. Consumer prices increased 3.3% from a year earlier, above the 3% pace in June. On a monthly basis, prices rose 0.2%.
The PCE report may be a lagging economic indicator, but it’s one that Fed Chair Jerome Powell has repeatedly said he uses to assess the health of the economy. In other words, it’s important.
In Europe, the Euro Area inflation rose to a record high since the single currency’s formation, with the flash reading for August coming in at +9.1%. In addition, the hawkish rhetoric from ECB officials continued to ramp up, with the idea of a 75bps hike at the September meeting being openly floated.
Nevertheless, inflation remains resilient on both sides of the Atlantic, heralding a prolonged phase of uncertainty over the real trajectory of central banks. The autumn could therefore continue to be marked by volatility. SEE SECOND PART
Last week
New cuts in oil production and data confirming the economic slowdown in China and the eurozone have rekindled traders’ risk aversion on the main financial markets last week. Volatility resurfaced in the run-up to central bankers’ decisions.
U.S. stocks ended up down for the week as anxiety over the Federal Reserve turning more hawkish impacted investor sentiment.
The tech-heavy Nasdaq Composite finished +0.1% on Friday, as Apple (AAPL) tried to rebound after sliding more than 6% over the past two days amid headlines concerning China’s ban of iPhone use in government agencies.
Europe 600 Index ended 0.76% lower as a string of economic data provided more signals that the eurozone economy continues to stumble.
Chinese stocks retreated as the latest economic indicators reinforced concerns about the country’s weakening outlook. Oil prices rallied for the 9th week of the last 11 with WTI pushing up towards $90 (its highest weekly close since November).
MARKETS : Buy the Rumors, Sell the News
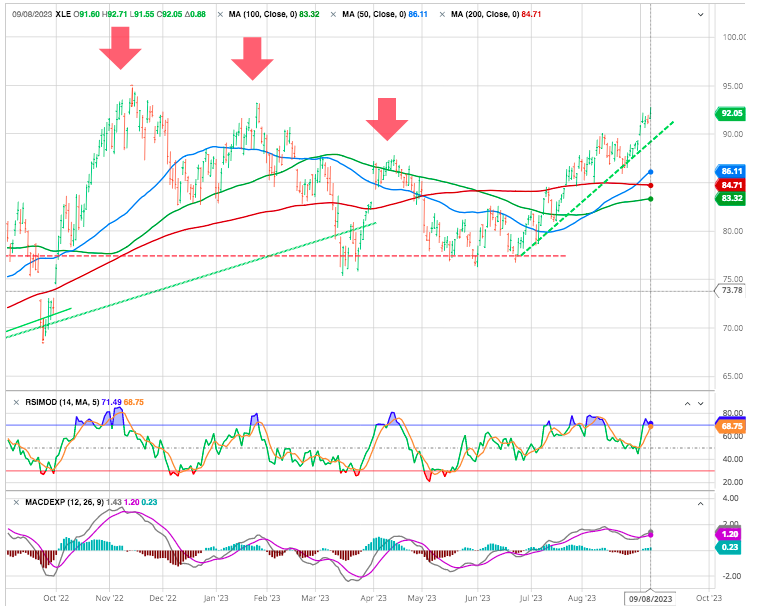
Many looked at the August selloff
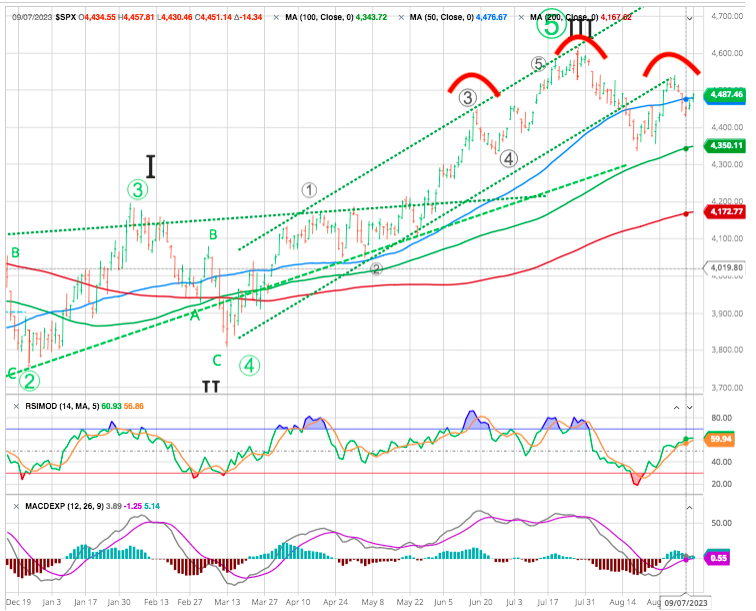
and the market bouncing off a short-term support level (4350). However the market remains comfortably above its upward sloping 200-day moving average.
The market sold off decently over the last week, retesting the rising trend line and holding the 50-DMA. The more extreme overbought condition is about halfway through a corrective cycle, suggesting we could see further “sloppy” trading this week.
Hence, this (possibly important) shoulder-head-shoulder (SHS) topping pattern remains on the cards:
With the market holding within a consolidation range, a breakout to the downside should confirm the start of a seasonal weakness. After a slew of economic data throughout the beginning of the month, which was supportive of a higher for longer monetary policy to remain in place, the late market rally will likely fade, sending the S&P 500 lower to continue its August pullback and back to the 4,175 (200 DMA support) over the next couple of months.
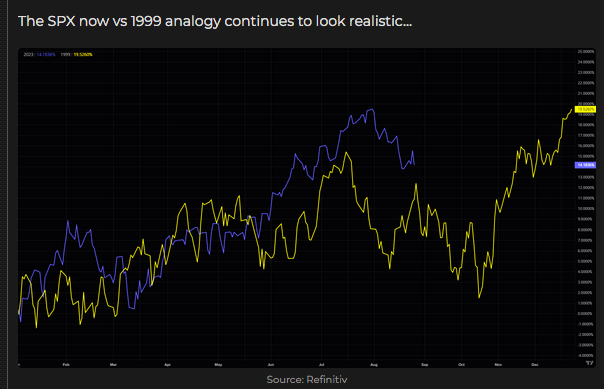
In the immediate financial conditions tightening is probably the bigger risk, and the chart below lays out the risk metrics to monitor.
SPX now (blue) vs 1999 (yellow)
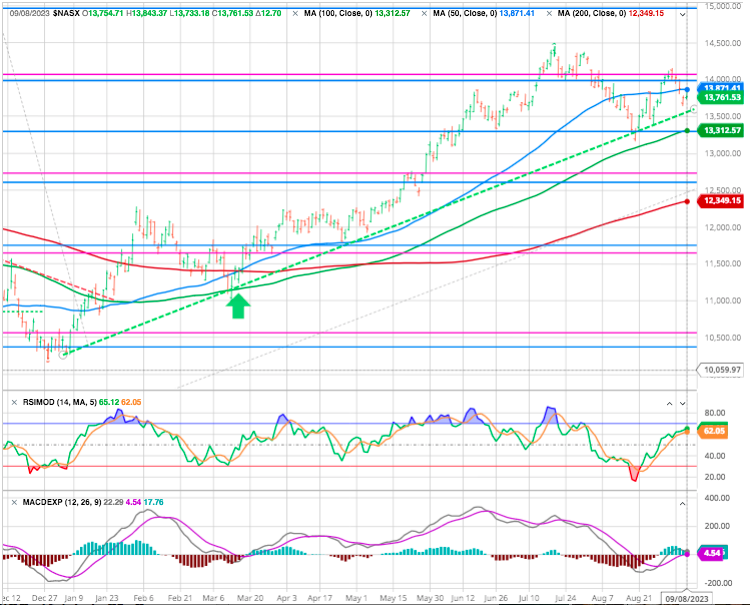
NASDAQ is holding its uptrend thanks to the technical stocks.
We recommend using short-term rallies to rebalance equity risks and overall allocations accordingly. While there is no evidence of a more severe market correction on the near-term horizon, such does not mean it can’t happen. As we get into 2024, the odds of a more meaningful contraction rise as the risk of economic recession grows.
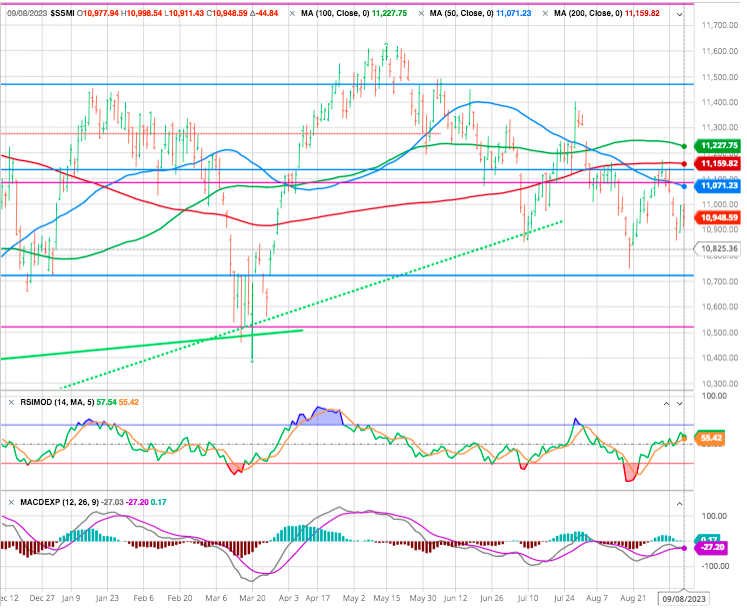
SMI
Attempting a catch up, but still below its 200- day MA. A test of the previous support 10750 is a possibility.
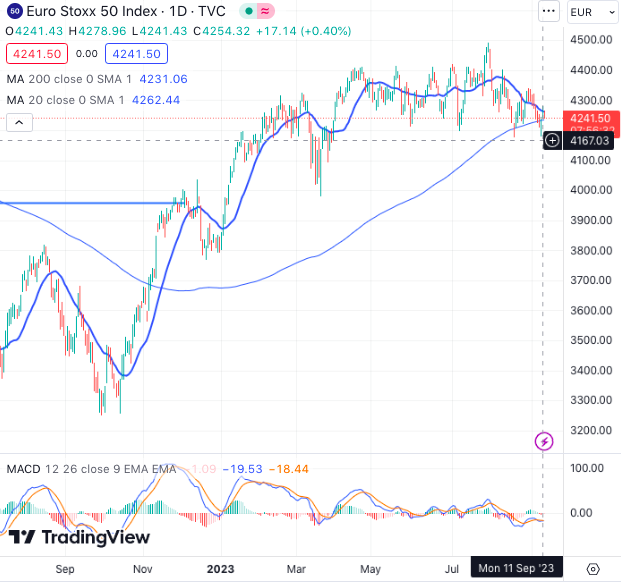
STOXX
Since first reaching key resistance at 4,400, the European index has been trading in a narrow, compressed range. The 50-day SMA, currently holding at 4,329, may act as an intermediary resistance; The index could continue to oscillate in the 4,200-4,400 range before a clear breakout occurs.
OIL: The trend for Crude Oil has turned up.
Oil prices just went out at their highest monthly close since last October. That was almost a year ago.
That’s all folks, more next week.
The Economy is Resilient and Central Bankers Uncertain
Trying to watch the markets as disinterestedly as possible over the summer time from hiking and climbing mountains, one thing seemed clear : the economy is resilient and the central bankers uncertain. August, was a return to markets driven by macro events and maybe the stop to a stock market rebound
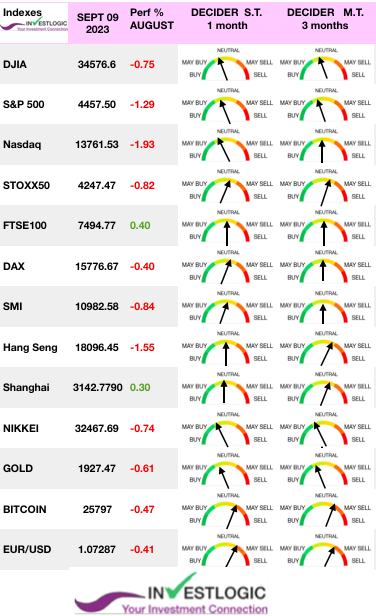
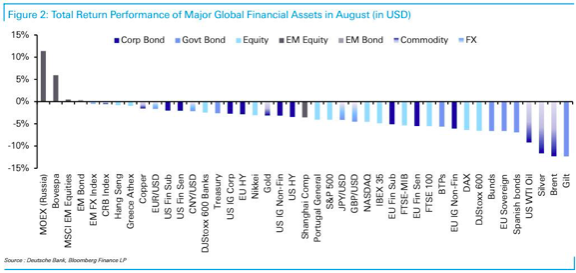
A quick glance at the performance map of some of the closest followed equity benchmarks around the globe reveals that August has lived up to its reputation as a difficult month… and September might well be the cruelest month !
For financial markets, the latter part of summer really was quite calm. Nobody made any great attempt to upset the apple cart. Even the annual central bankers’ symposium in Jackson Hole, Wyoming, at the end of August created little news.
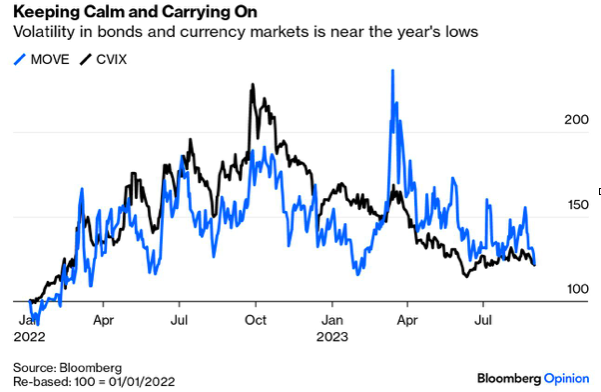
It’s also startling that volatility is dissipating. Surprisingly strong data in the US, an important step toward tighter monetary policy in Japan, and deeply disquieting data out of China all provide ample excuse for macro markets to move around. But they aren’t.
The prospect of faster rate hikes and some weak data releases meant equities lost ground again in August. The S&P 500 was down -4.1% on a total return basis, and in Europe the STOXX 600 was down -5.0%. One exception to this pattern was in emerging markets, with the MSCI EM index posting a modest +0.4% gain for the month.
Some ‘things’ stick out immediately:
- The weakest markets on a YTD basis (China & HK) were also the weakest in August.
- Ignoring the small Portuguese market for a moment, some of the strongest markets on a YTD basis (e.g. Nasdaq, Japan) held up best the first half.
- UK’s FTSE-100 3.4% drop in August takes the index into negative territory on a YTD-basis, joining only Chinese and Hong Kong stocks to “achieve” that.
- The S&P 500, was down 1.8% after four consecutive up months, but up over four percent from the intra-month low.
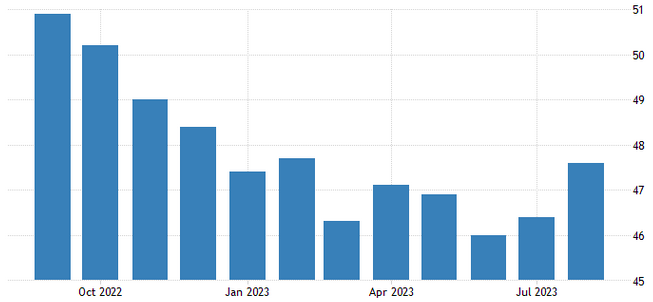
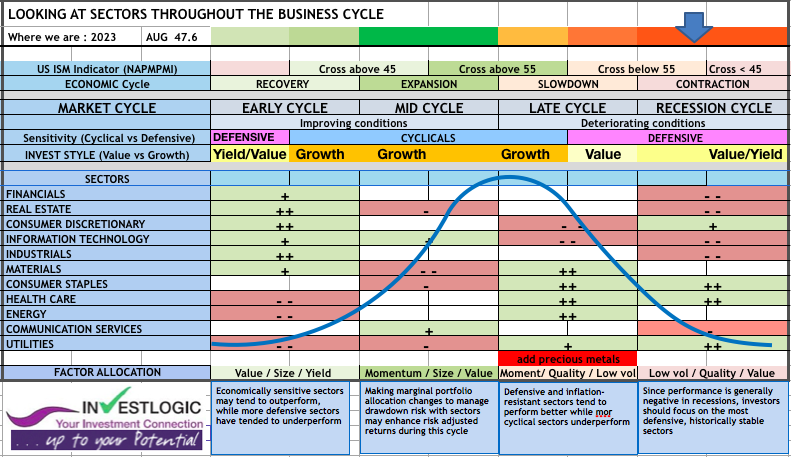
The August Manufacturing PMI registered 47.6 percent, 1.2 percentage points higher than the 46.4 percent recorded in July. Regarding the overall economy, this figure indicates a ninth month of contraction after a 30-month period of expansion.
The New Orders Index remained in contraction territory at 46.8 percent, 0.5 percentage point lower than the figure of 47.3 percent recorded in July.
As our proprietary ABS matrix shows.
see more here
Interest Rates: HIGHER FOR LONGER
Looking at the interest rates, the situation is more mixed.
Have US yields peaked? The question is on everyone’s lips, in trading rooms the world over. Every new statistic is scrutinized to ensure that the central scenario – inflation under control, soft landing for the US economy – is not hit by any hiccups. Neither too hot to avoid further monetary tightening, nor too cold to avoid reviving fears of a recession.
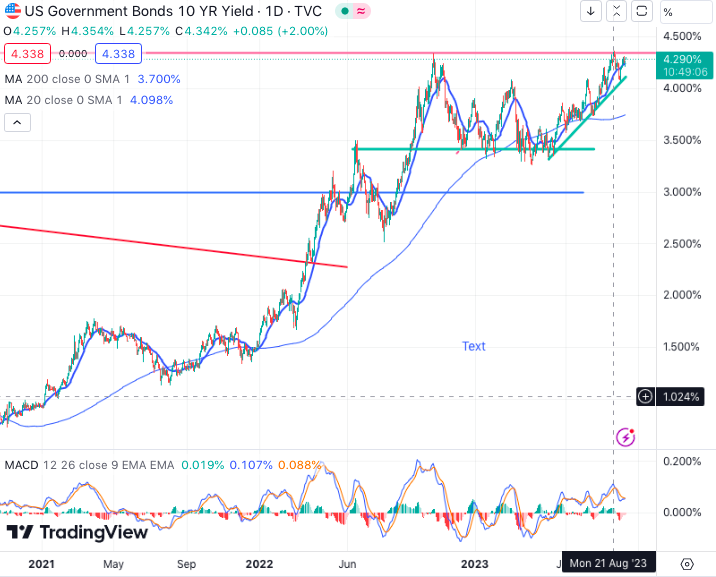
To gauge the mood, it’s best to look at the evolution of the US 10-year. On an uptrend since last April, it has already tested its 2022 highs at 4.34%, but has failed to break through them.
Someone somewhere was determined to break the 10-year Treasury yield, the most important number in global finance, above the level of 4%. It does increasingly look as though the 10-year yield is getting comfortable above 4%.
The MOVE index of bond volatility is now at its lowest since the eve of the US regional banking crisis earlier this year.
In general, if the economy is relatively dynamic, it would make sense for rates to settle at a higher level, while they will be lower when it is sluggish.
 Fed Chair Jerome Powell homed in on this issue in the most discussed passage of his speech at Jackson Hole, and appeared to come down on the side of the latter. But with some caveats:
Real interest rates are now positive and well above mainstream estimates of the neutral policy rate. We see the current stance of policy as restrictive, putting downward pressure on economic activity, hiring, and inflation. But we cannot identify with certainty the neutral rate of interest, and thus there is always uncertainty about the precise level of monetary policy restraint.
He went on to say that growth in the US has been higher than expected so far this year, an assessment with which virtually everyone would agree. What should we make of this?
If it was stronger than anticipated because effects of the policy are lagged, it’s a dovish outlook. If it was stronger because the economy is very resilient and will remain so, it’s hawkish, and they may need to raise rates again. He didn’t give a view on which it is.
That may well be because he doesn’t know himself. As it stands, however, the market is implicitly betting that the economic strength is because the lags before tighter monetary policy makes itself felt are proving to be longer than usual.
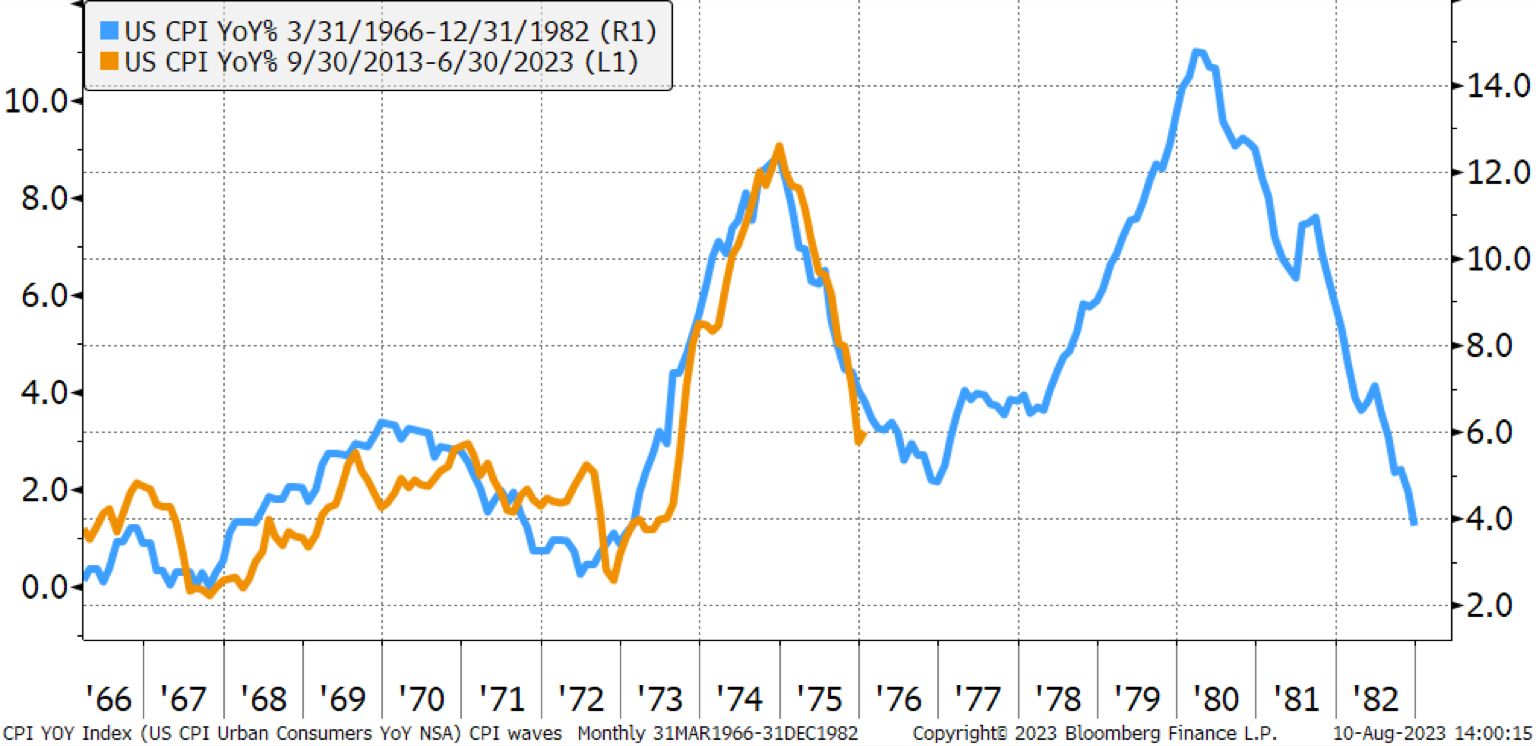
There are two lessons from the 1970s for the Fed today, see chart below.
First, if the Fed turns dovish too quickly, then inflation and inflation expectations will not settle at 2%. Second, if the economy re-accelerates, the Fed will have to raise rates a lot more.
The implication for markets is that the Fed will be keeping the cost of capital higher for longer than the market is currently pricing to ensure that the FOMC doesn’t repeat the mistakes made in the 1970s.
Lately, the CME FedWatch tool indicated a 6% probability of an interest rate increase of 25 points at the next Fed meeting scheduled for September 19-20, while trading on the fed funds contract implies a probability of just under 35% that an interest rate hike of either 25 to 50 basis points will take place before or at the November meeting.
In our opinion the Fed isn’t going to cut interest rates until the stock market crashes, or inflation is at 2%. Consumers don’t need a monthly report to recognize prices are rising. Americans of every income level feel the squeeze every day.
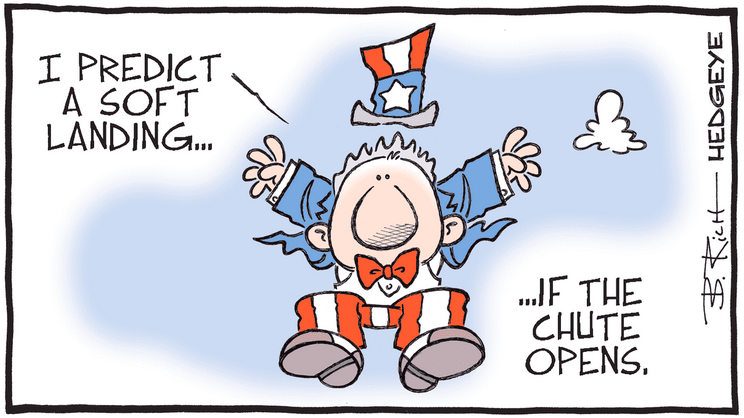
A trap driven by a fantasy narrative of inflation melting, allowing the Fed to cut rates and ease up on monetary policy as the US economy glides to a soft landing. While there may be some early signs that the economy may be starting to soften, it is still too strong and resilient and far from getting the Fed to change its projected restrictive monetary policy path.
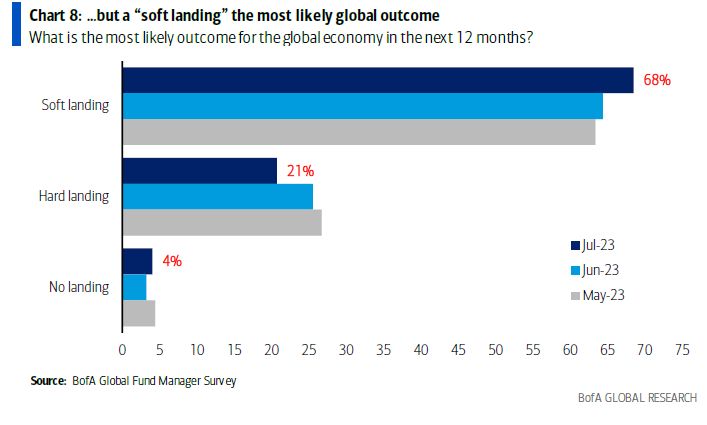
The soft landing of the us economy is the new consensus according to BofA survey.
Happy trades and a successful September!
BONUS :
Remember August


