MARKETSCOPE : Earnings Season – Place your Bets
April, 25 2022The Frog Who Wanted to Be as Big as a Bull
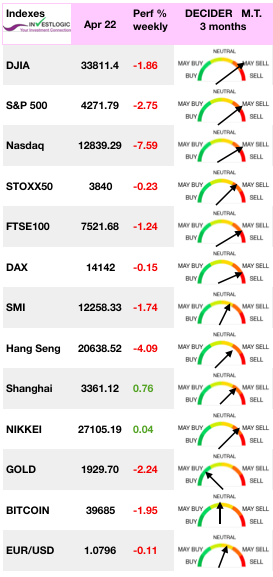 This was a difficult week for markets. The shift in market expectations for even more tightening came after Fed Chairman Jerome Powell said at an IMF debate Thursday that a 50-basis-point hike in March was “on the table.
Shares in Europe fell amid ongoing concerns about the war in Ukraine and increased hawkishness among central bank policymakers. The STOXX Europe 600 Index ended 1.4% lower.
In Asia, the yen was hovering around a two-decade
low against the U.S. dollar. Chinese markets slide as investors
worried about the economic fallout from covid lockdowns after
officials said tough restrictions would remain in place.
Investors are now forced to deal with the reality that money will not continue flowing so abundantly… They will be closely watching the flurry of corporate results due this week to get more clues about the state of the economy. Volatility should remain high, and the pace of corporate earnings reports should intensify.
“Surely all of us working in finance realise by now that something is likely to snap in the financial system and probably quite soon. Maybe the outcome wouldn’t be so ugly if central bankers had not spent recent decades ramping up asset prices to today’s grotesque levels through their monetary incontinence. But they did ! ” as Albert Edwards from SG observed.
The bigger focus is on Federal Reserve expectations. FOMC members will be in a pre-meeting blackout period from giving talks, but analysts will continue to buzz. Bank of America anticipates the Fed will hike 50 basis points at the next three meetings and 25 points thereafter until the fed funds rate reaches 3.50% in May of 2023.
See the Economist article
MARKETS
What this means for stocks and bonds:
The selloff in Treasury bonds accelerated as expectations for even more hawkish policy rose and favoring a recession.
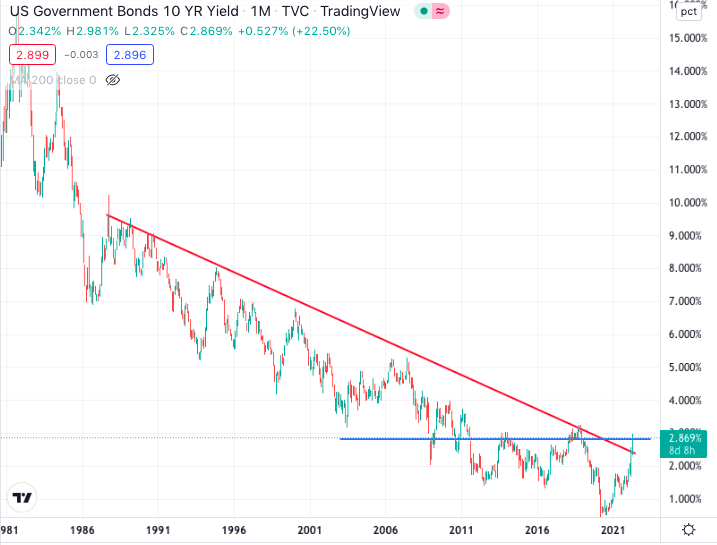
This may be the most important financial chart in the world today.
It shows the interest rate (or “yield”) on the benchmark 10-year U.S. Treasury note over the past 40-plus years. However, the long-term charts of every other Treasury security from two-year notes to 30-year bonds look almost identical.
Each time yields have touched – or sometimes just approached – this multidecade downtrend resistance (represented by the red line), they’ve peaked and begun to move lower. And each time this has happened, some kind of trouble has followed relatively soon after.
In other words, these resistance lines appear to indicate the point where interest rates become “too high” for the economy or markets to support. And as you can see, these points have been occurring at lower and lower levels over time.
Fear is back
Stocks started Thursday with a rally, but the big rise in rates (especially real rates) reversed the trend.
As noted in our MARKETSCOPE of Feb 21,2022 we had a Bear Market Signal on the index end January. The monthly moving average convergence divergence indicator (MACD) also rang a significant warning bell. It measures the difference between the 12 and 24-month moving averages. When that line crosses below the 6-month signal line, such suggests the market is at risk.
Our Decider – multi time frame oscillator system- here
While there are certainly some false signals along the way, it is worth noting that many of the sell signals are closely associated with more critical market-related events, corrections, and bear markets.
For NASDAQ a bear market target would be around 10’250 which correspond to the 38.2% correction of the 2009-2022 uptrend, as well as the 61.8% (purple) of the latest wave from march 2020 and finally to the expansion of the present correction in a third wave to 1.23.6% ( of 1st wave length from the latest top).
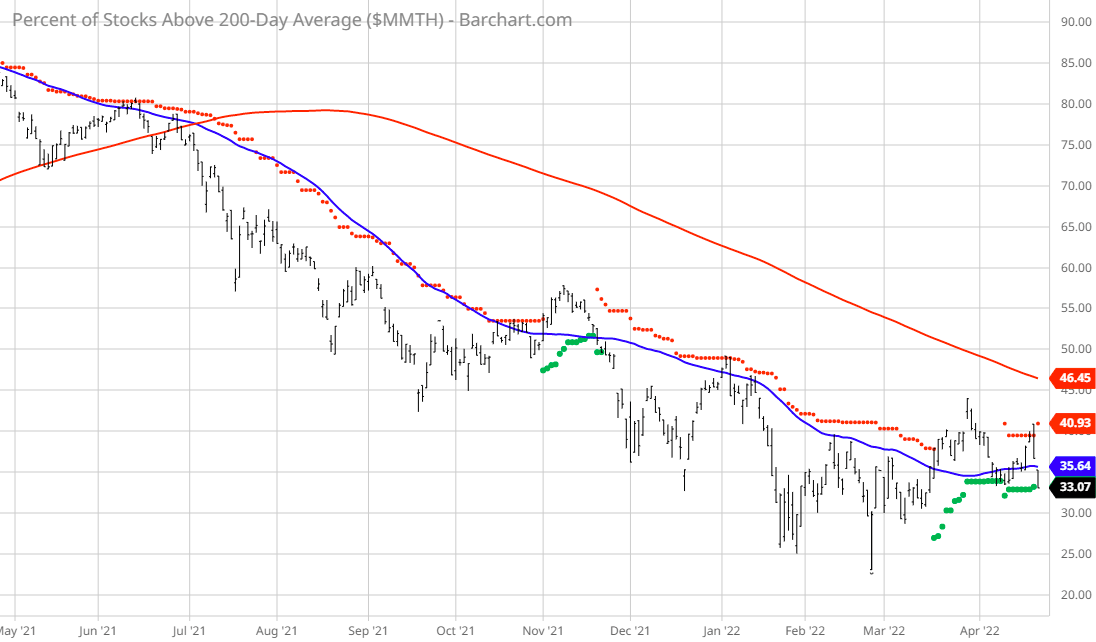
One of the key indicators we look at regularly is how many stocks are trading above and below their 200 day moving averages. For the last year there has been a steady decline in that number. You can see that even though we seem to be bouncing off a bottom as yet there is not a firm upward momentum.
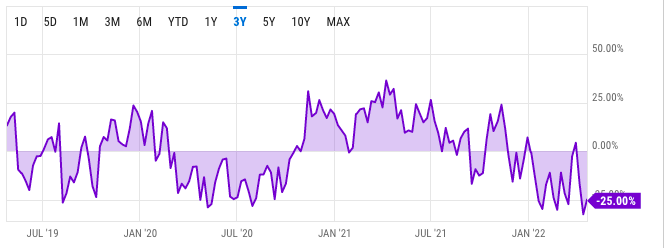
Investors are upset, as evidenced by a big jump in the equity put/call volume ratio on Friday. The Investors Intelligence Bull-Bear spread ratio is back under -25%.
EARNINGS
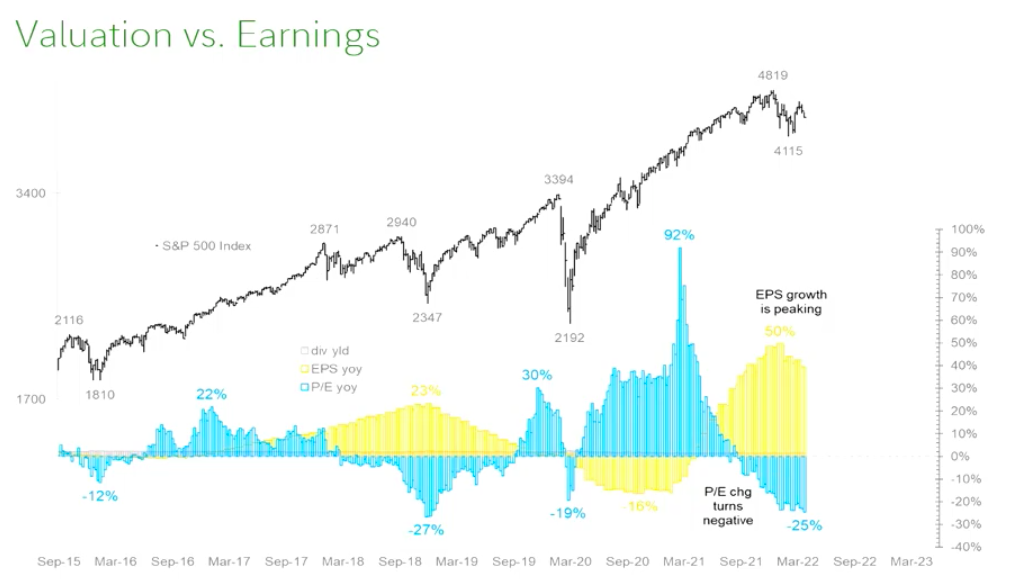
There is not much positive news to focus on currently. While we are in the midst of earnings season, we see the impact of higher input costs weighing on profit margins like Newmont Mining. We saw a shift in consumer sentiment with Netflix and concerns about outlooks as Gap Stores consumption slowed.Only the consumer staples sector ended in positive territory. Such doesn’t bode well for earnings and economic growth later this year and, with valuations elevated, makes maintaining current prices more difficult.
Tech giants will be pushed into the spotlight with Apple, Amazon, Microsoft, Alphabet, Meta Platforms (META), and Intel all on the earnings stage. The earnings season so far has been somewhat balanced between some sizzling results (think Tesla) and major disappointments (think Netflix).
Alphabet & Microsoft report on Tuesday night, Meta on Wednesday night, Apple and Amazon on Thursday night. Don’t expect great things from Microsoft/Amazon and Alphabet. The three trade below their 40 week moving averages suggesting there is more downside ahead.
That leaves the market’s hopes resting on Apple Apple reports its 1Q this Thursday April 28th. Being the last FAANG standing this could well determined whether this market bounces back or slides even further
The stock is still above its 200 DMA and still in its latest uptrend channel. It could well rebound on these limits.
We are going to have a tough spring and summer
Purchasing managers indexes, real bond yields, retail sales and more….they are all saying the same thing: there is trouble ahead.
History shows that when the market is down through April, it has fallen from May to September six out of 15 times , or 40% of the time.
History means investors don’t loose a lot by being conservative in a year like this.
GOLD
Gold bugs have been a lonely bunch , but that may be about to change. This week Gold made a run at $2,000 a level above where it closed back in August 2020 before retreating to $1,935 on Friday.
This week Gold made a run at $2,000 a level above where it closed back in August 2020 before retreating to $1,935 on Friday. Precious metals have been penalized by the Fed’s change in tone, which has strengthened the greenback and bond yields, much to the dismay of gold.
This sharp decline is also affecting silver (which is trading at USD 24.3) as well as platinum (USD 930). Note that palladium has stalled this week, an outperformance that is linked to the significant weight of Russia in the production of this metal, which accounts for nearly a third of global supply.
CRYPTO
Bitcoin is still unable to break out of the $40,000 zone in which it has been gravitating for more than 10 days now. A lateralization of the price of the digital currency that has enough to put the nerves of crypto-investors to the test. The cryptosphere players are letting themselves be carried along by the gloomy macroeconomic situation, which has little or no inherently bullish catalysts to revive the crypto-asset market.
it is a risk asset that has gone up during the pandemic for the same reasons as high growth stocks. That demand will shift into gold as people realize Bitcoin is not doing what they thought. Gold is not about getting rich. It is about staying rich or not going broke as inflation wipes people out.
Happy trades


