

MARKETSCOPE : Good news? Bad news! and vice versa.
June, 06 2022
We hold on to what we can.
 Markets tried to rally last week, but Friday was difficult for Wall Street.
Stocks fell sharply on Friday to cap their eighth weekly loss out of the last nine, as a stronger than expected report on U.S. nonfarm payrolls suggested the labor market remains robust enough for the Federal Reserve to raise rates quickly.
Sentiment also was hurt by a report that Tesla’s Elon Musk may be considering job cuts on worries over the economic outlook. Musk’s misgivings followed comments earlier in the week from J.P. Morgan’s Jamie Dimon, who said he foresees an economic “hurricane” ahead from the war in Ukraine and the Fed’s tightening policies.
The benchmark 10-year Treasury yield climbed above 2.9% after the report, leading to outsized losses among tech stocks.
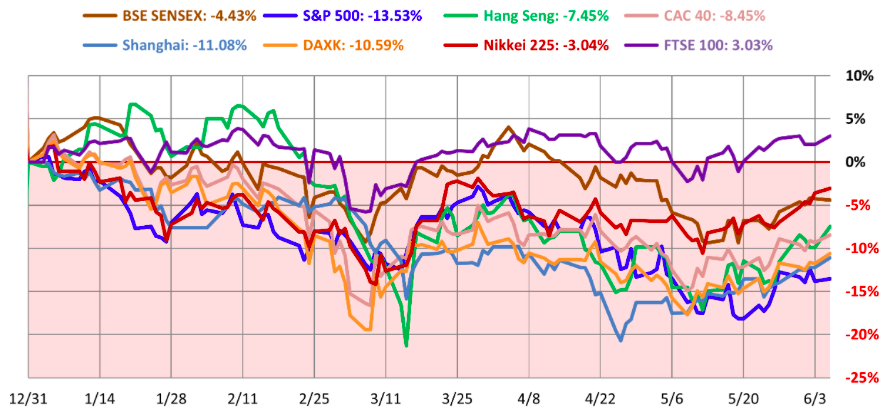
European shares fell in thin volume as the UK market closed early to celebrate the Queen’s 70th year on the throne. Inflation in the 19 EU countries accelerated more than expected in May to another record high of 8.1%. In Asia, Japan’s Nikkei 225 was positive for the week while Chinese stocks rallied after Beijing unveiled a raft of support measures to cushion an economic slowdown.
Things improved a bit on financial markets with the return of a good old habit: any signal likely to weigh on the Fed’s rate hike is welcomed. So a weak macroeconomic statistic invariably triggers the “if things get worse, the Fed will be forced to limit its rate hikes” reasoning. SEE our report What If the FED Put Is Still Prevailing ?
Unfortunately that role has now reversed as the good news for the economy is bad news for markets as the Fed looks to raise rates and tighten monetary policy.
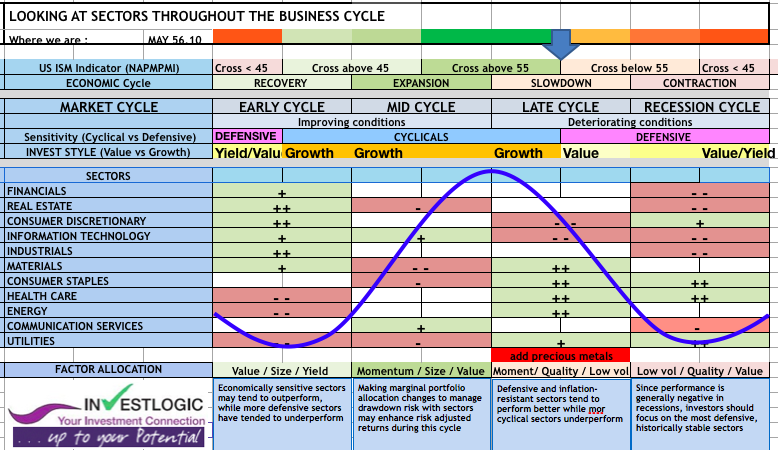
Such an example came on June 1, when the ISM manufacturing report was stronger than expected and showed economic improvement in May versus April. US ISM Manufacturing PMI is at a current level of 56.10, up from 55.40 last month and down from 61.20 one year ago. Of course, while weaker than April’s level, the price paid component of the report was still higher than expected. (Below our ABS Matrix).
MARKETS : Don’t try to catch the bottom
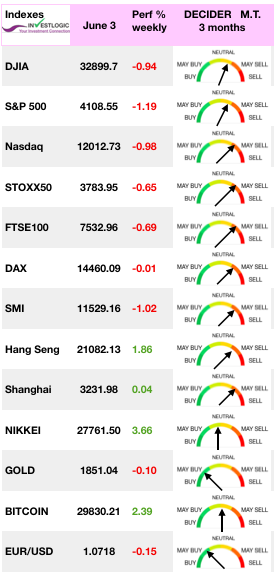
World Markets as of June 6,2022
A rally finally took hold as investors found reasons to be bullish. That rally pushed the market above the 20-dma and triggered a reasonably strong “buy” signal. However, despite the optimism of the bulls, we noted an essential headwind to the rally. For the most part, the 20-dma has consistently acted as the “exit” for ‘trapped longs.’
While the market did clear the 20-dma, the “trapped longs” headed to the exits at the initial 38.2% Fibonacci retracement level from the March highs. That level was also where previous important support for the February and April lows got broken.
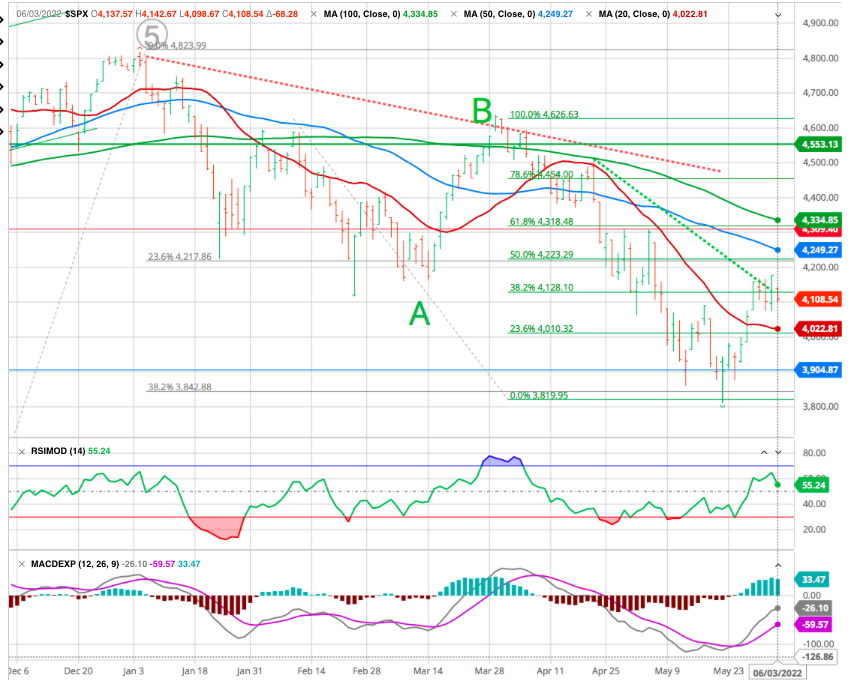
On the bulls side The Fibonacci retracement levels from the March peak, the 50- and 200-dma, and the downtrend line from the January highs all present a challenge to the bulls short-term.
However, the recovery in buying pressure shows improvement in the number of stocks making new highs versus new lows on multiple indices.
While we could certainly see a reasonably strong reflexive rally in the short-term, there are still sufficient reasons to remain cautious on the markets over the next several months.
The bad news is that the market broke critical support at the 12-month moving average during May. However, the late-month rally kept the market above support at the 2-year moving average. The 24-month moving average is critical as it has been the bullish trending support line during the last 25-years.
However, the most crucial signal remains the long-term MACD indicator in the bottom panel. When that indicator has previously crossed lower, it signaled the peak of a bear market or significant correction.
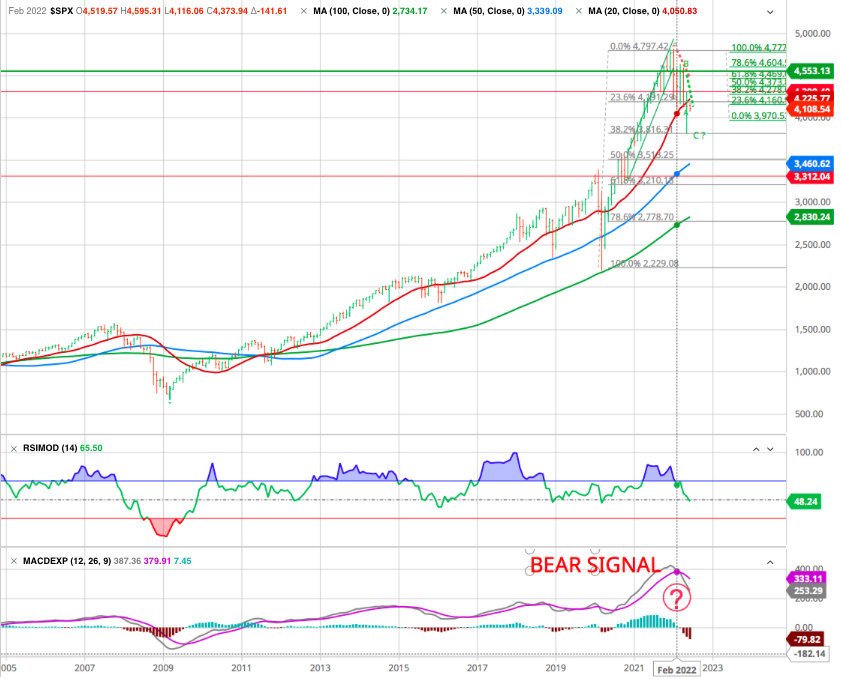
That cross lower occurred in January of this year. With a long-term sell signal intact, and markets well above previous bottoms, there is still downside risk ahead.
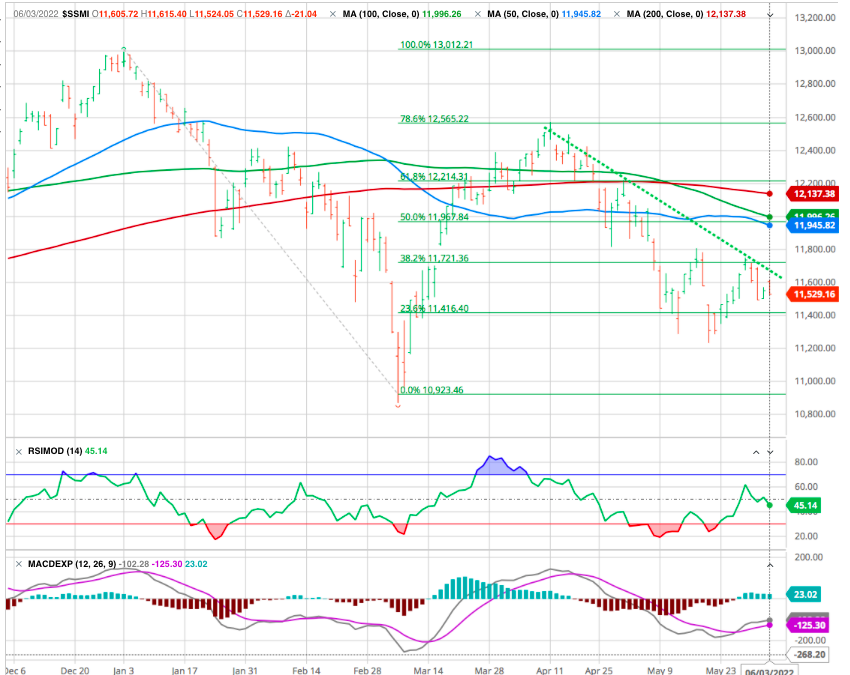
Swiss Stock Market
As for the S&P500 investors exited at the initial 38.2% Fibonacci retracement level from the March highs. We still believe we can catch the 11’900 levle (50% correction level and MA 50 and MA 100)
OIL
Prices have been on a roller coaster ride again this week. The member countries of the European Union have finally agreed on a ban on Russian oil. With most OPEC+ members struggling to meet their production quotas, it is difficult to see OPEC+ production increasing significantly in the coming months, especially if Russian production declines. In terms of prices, Brent is trading near USD 118.
GOLD
In precious metals, gold and silver are struggling to rebound and are trading at USD 1862 and USD 22.2 respectively.
CRYPTOS
For its part, bitcoin could end a streak of 9 consecutive weeks of decline if it closes above USD 30’000. After shedding more than 30% of its capitalization over the past two months, the digital currency is still not out of the woods in this very deteriorated macroeconomic environment and may yet test the nerves of crypto-investors during this June.
No Stress On The Fed…Yet
The bearish case hinges on the Fed remaining aggressive in tightening monetary policy. For now, that certainly appears to be the case, as there is little market stress to deter them from continuing their focus on combatting inflation.
SEE our report What If the FED Put Is Still Prevailing ?
Remember the analogy we mentioned last time. After years of increasing intervention, the markets and the economy are effectively addicted to easy money. And even though the Fed has only just begun to tighten, both are already going into withdrawal.
For the time being, the markets are doing the Fed’s job for it. Lower equity valuations, higher gas prices and higher mortgage rates have quickly changed consumer and business psychology. Demand is coming down, which should translate into some loosening in the job market.
Perhaps the most worrisome signs are in housing. Data last week showed new home inventories surged to nine months of supply, one of the highest levels on record. Similar levels have almost always preceded sharp declines in home prices and recessions for the past 50 years. We are also beginning to see signs of stress in the corporate credit market as well. In particular, Bloomberg recently noted spreads on investment-grade bonds are now approaching the danger zone that has warned of significant economic trouble in the past.
We previously shared the following long-term chart of the yield on 10-year U.S. Treasury notes. But the charts of other Treasury yields, from two-year notes to 30-year bonds, looked similar…
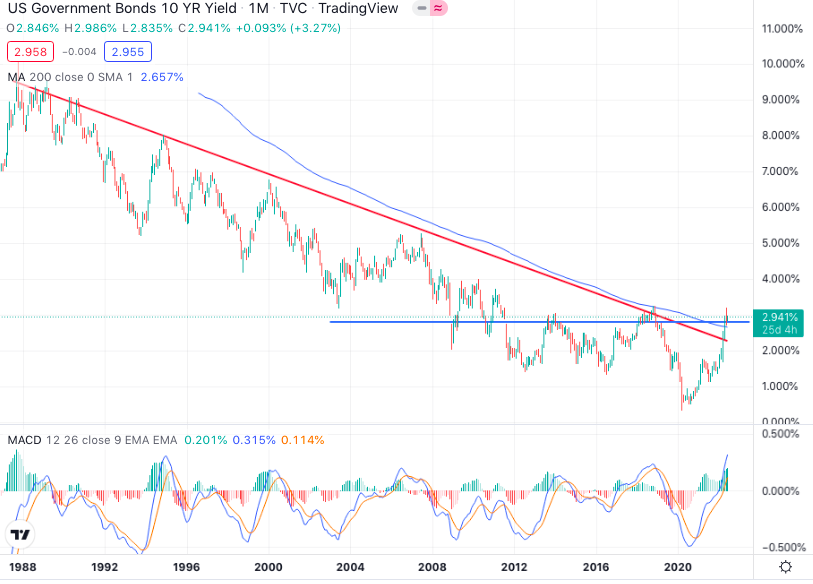
Since that update, rates pulled back and have been consolidating above these long-term levels (red line).
Below is an updated look at the 10-year yield. But again, the charts of other rates look similar today…
This chart suggests rates are likely to make a significant move in the weeks ahead. And because interest rates and inflation are generally correlated, this move could have a substantial influence on Federal Reserve policy as well.
If interest rates resume their recent climb, it would indicate inflation pressures may not be easing as many folks expect.
This would keep pressure on the Fed to continue tightening as promised. And this would likely continue to put downside pressure on stocks and potentially trigger significant problems in the markets or the economy in the not-too-distant future.
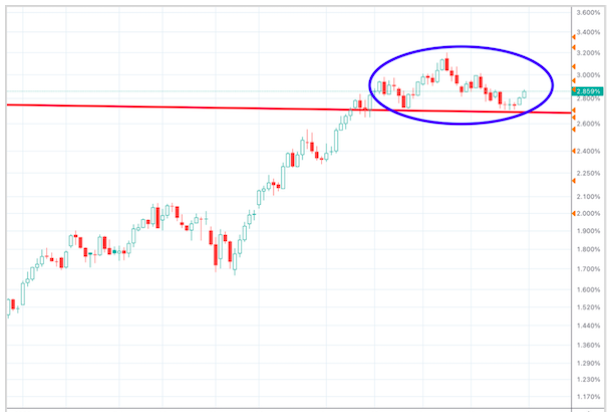
The recent price action (blue circle in the chart above) suggests this is the more likely outcome right now. This type of “breakout and retest” pattern often resolves in the direction of the previous trend.
However, if rates were to turn lower and move decidedly back below the long-term trend (red line) again, we believe the odds would change significantly.
As Bloomberg author John Authers wrote we could move into a “risk-on” narrative, as investors bet that central banks won’t have to raise interest rates so much after all. If that’s right, then of course you should buy bonds. That pushed down their yield — which justifies paying a higher price for stocks.
This would signal the demise of TINA, or There Is No Alternative (to stocks), and her replacement by TARA: There Are Reasonable Alternatives (to stocks).
Happy trades