

Charting an Investing Path
November, 30 2023
One possible approach using charts
At Investlogic, we believe it’s important to start your investment process with a long-term plan that is built upon your individual goals, risk tolerance, time horizon, liquidity requirements, and tax constraints. From there, you can create a long-term, strategic asset allocation. We believe investment selection should start with careful fundamental analysis.
Those who have experience forged by time in the markets will tell you that it’s imperative to have a system of sorts in place. You need to be able to define how much you are willing to risk vs. how much gain is likely.Those who survive across the decades in the greatest game on earth will also inform you that preservation of capital is paramount.
Coupled with an attempt to understand the underlying economic backdrop, you could seek to project how a company’s financial performance will develop over the medium to long term, and then examine how your estimates for a company’s performance compare with the market valuation of its stock.
If you think the investment’s valuation does not adequately reflect its prospects, you could consider buying. If you own an investment and think the market’s expectations are greater than yours, you might think about selling.
While there are multiple manners of doing this, we have found technical analysis to be a tool of immense utility for traders and investors alike.
Cholera Outbreak
What does technical analysis have in common with a cholera outbreak in London in 1854? In both cases, it’s about the power of pattern recognition.
After several weeks of an increasing number of people getting sick, resulting in hundreds of deaths, without being able to determine the cause, British physician John Snow decided to plot the locations of afflicted residents in London’s Soho district on a map. By looking at this chart (see city map), he was able to determine that a centrally located public water pump near Broad Street was the source.
Pattern power: How a map solved the mystery of the 1854 cholera epidemic in London
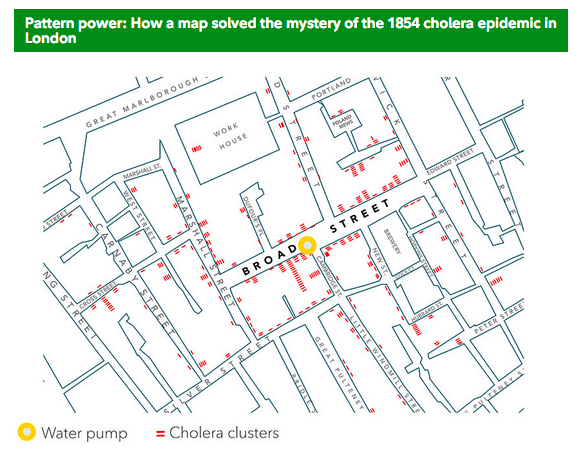
This is a sectional representation of a map originally created by British physician John Snow showing cholera cases clustering around a single water pump.
Without the aid of germ theory, which had yet to be discovered, this simple visualization helped Dr. Snow uncover the source of the problem. It is this type of pattern recognition that is at the heart of technical analysis—and how charts can help you invest.
Of course, as was the case with Dr. Snow’s efforts to solve the London cholera outbreak, charts are just one tool that may be able to help you achieve your investing goals. Fundamental analysis, which entails attempting to measure an investment’s intrinsic value by examining related economic, financial, and other qualitative and quantitative factors, can help you decide what to buy or sell. Technical analysis can help you spot trends and decide when to buy or sell.
What can technicals do for you?
It is at that point that you could turn to charts and technical analysis. It is a truism that, over the long term, stock performance is a reflection of a company’s earnings.
However, as an adjunct to fundamental analysis, technical analysis can play an important role in identifying entry or exit points for a stock, in spotting emerging changes that may not yet be reflected in fundamental estimates for a company or industry, and as a reality check on your fundamental expectations about a stock, an industry, and, at times, even the broad market as a whole.
If this is an approach that appeals to you, here’s a blueprint for how you can incorporate charts and technical analysis to evaluate almost all types of financial securities.
Once you feel you’ve analyzed all the fundamental factors that may affect an investment opportunity, consider looking at charts and indicators to see whether there are technical factors that may help confirm (or refute) your views on where the market and its components may head. As a byproduct, technicals can also help you uncover pockets of opportunity, and, finally, key price levels at which to buy or sell.
Beyond your fundamental approach, you might pay attention to relative strength charts. Consider a bull market, where stock prices are generally rising. In this scenario, technical analysis may help you identify “the best of the best.”
By finding patterns among stocks with strong and weak relative strength, you might discern industries that may be coming into or out of favor, or understand broad market themes. For example, if many cyclical companies are showing strong relative strength, it might be an early signal of broad economic pickup in the future. Conversely, if defensive industries like consumer staples or utilities start to show improving relative strength, it can be one sign that an economic slowdown may be on the horizon.
Cool chart tools
There is a great assortment of charting indicators that are at your disposal. For example, do you like to find investments that seem to have the momentum to perform well over the short or medium term? A momentum indicator measures the rate of change of prices, which can be a signal of increasing or decreasing interest by investors.
If a price chart is trending up, you might think that investors are expecting good financial performance in the future. In cases where recent performance has been strong, it may suggest that investors expect good things to continue.
More intriguing for you may be when recent performance has been poor; a subsequently improving chart can reflect a potential turn in fundamental performance months or quarters before that is reflected in financial statements.
By the same token, when fundamental performance has been strong and a company’s chart begins to deteriorate, it provides occasion to consider what factors other investors may be seeing that you might not have built into your analysis.
Several momentum indicators include:
- Moving averages—A stock’s normal movements can be volatile, gyrating up or down, sometimes making it a little difficult to assess its general direction. The primary purpose of moving averages is to smooth out the data you’re reviewing to help get a clearer sense of the trend.
- RSI—This tool is an oscillator (something that moves between a range), scaled from 0 to 100, that is used primarily to determine whether a stock or other security is overbought or oversold.
- Stochastics—Like RSI, this is another oscillator that is used to determine whether a stock or other security is overbought or oversold.
- MACD—Like RSI and stochastics, this is a slightly more complex oscillator that is used to determine whether a stock or other security is overbought or oversold, and it can generate frequent buy and sell signals.
- Bollinger Bands —This indicator uses a stock or other security’s standard deviation to generate buy and sell signals based off its price performance.
In addition to analyzing momentum, some traders may also look for repeatable patterns—much like Dr. Snow did in the London cholera outbreak. There are many different types of chart patterns, including:
- Channels—A price range that a stock (or other security) trades within over a period of time, which may reveal potentially important price levels to watch, for potential breakouts.
- Traditional chart patterns—Head and shoulders (a reversal pattern that looks like 2 shoulders and a head), V bottoms and tops (reversal patterns that resemble the letter “V”), and triangles (continuation patterns that resemble a triangle) represent just a few of the traditional chart patterns that can generate trading signals.
- Japanese candlesticks—Candlestick charts combine elements of line and bar charts to depict how a stock or other security trades. Each individual candlestick shows a security’s open, high, low, and close for a day, week, or month, depending on the time frame you choose, and combinations of candlesticks can reveal patterns.
Nothing is perfect in this world, but for those looking to open their eyes to a new universe of trading and investing, why not consider studying this further? It may just be one of the most illuminating projects you undertake.
Also check our older presentation Point Break : L.T. cycles . Kondratieff and Elliott waves
Whether and how you choose to utilize charts depends on your investing goals and outlook. They may not be for everyone. However, if patterns and data visualization appeal to you, technical analysis can be a useful tool to help power up your investing strategy.
Until next time
*Source : Fidelity Investments