What Are The Charts Telling Us ?
April, 13 2023
What Are The Charts Telling Us?
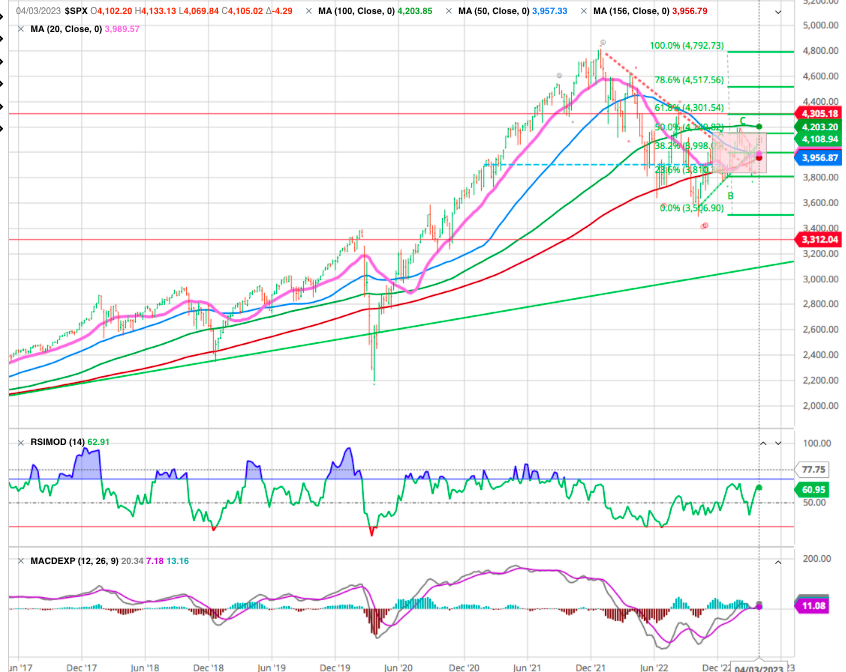
We have been in a bear market all along 2022. Then moving sideways following the end of the year. The question is which way the index will move out of this channel remains unknown. Time and charts will tell. The positive is that it hold above the downtrend line (dotted red) and hold above our l.t. support 156 week MA (red) and a daily golden cross.
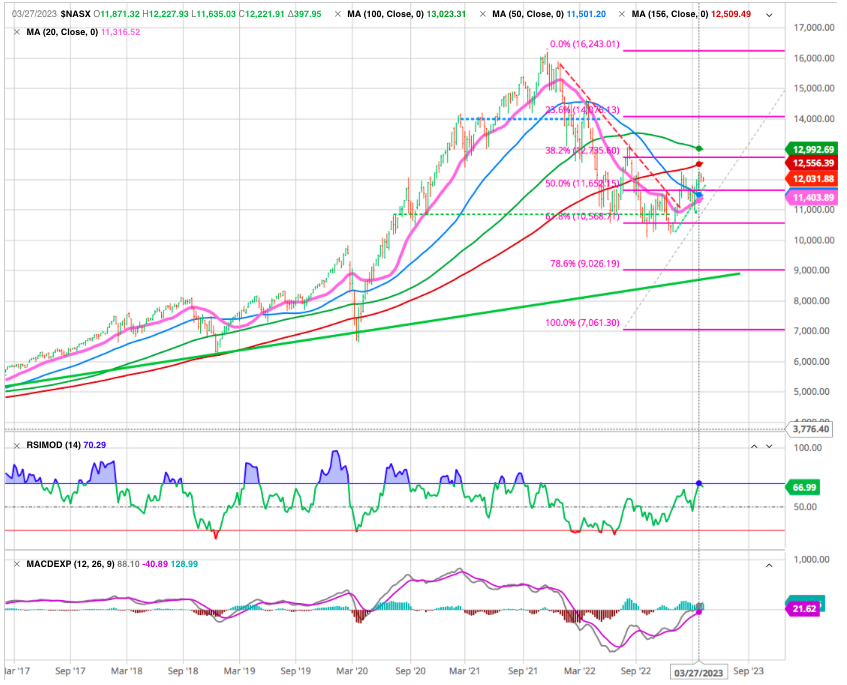
For the Nasdaq the situation is apparently bit more complex. The index remains below our 156 WMA which represents a strong resistance but close to a possible golden cross on the daily chart and our MACD is turning lower.
Swiss Market Index
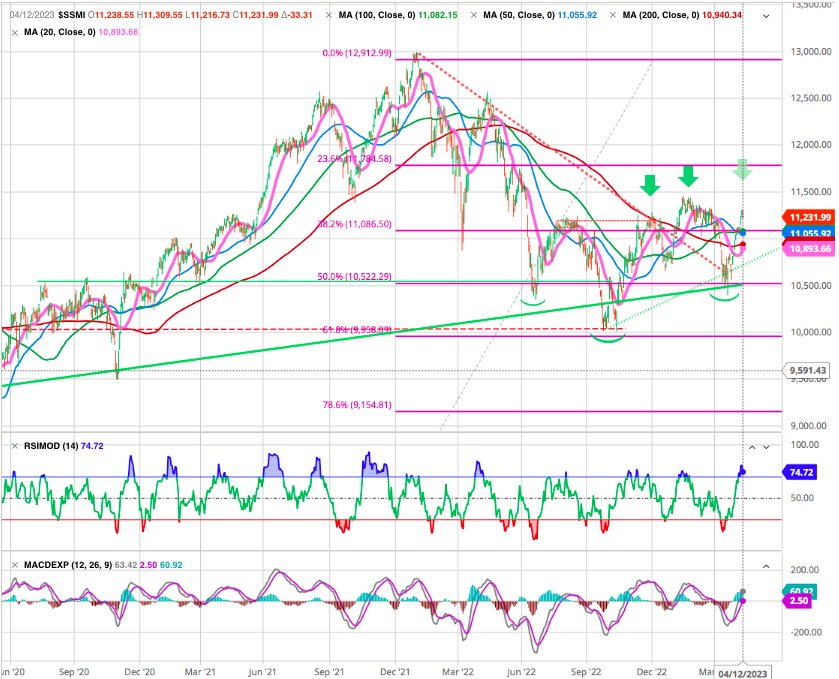
The Swiss market recovered from its severe weakness of mid March testing its long term uptrend (green line) at 10400 completing what’s appear a Head&Shoulder. We need now higher lows and a confirming higher high. around11’400. The resistance would be the next Fibo level at 11’700.
Otherwise the market will probably be stucked in a large sideways pattern. Support at 10’800.
SECTORS
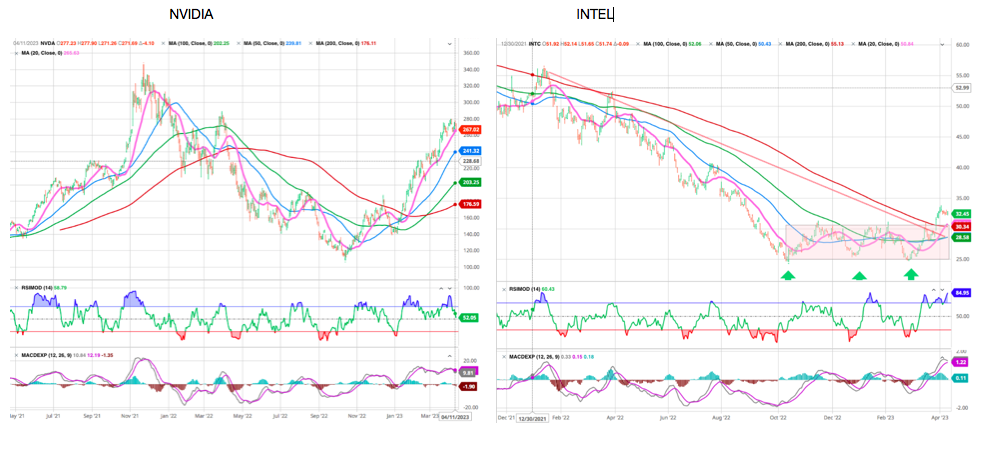
Looking at the sectors the Semiconductors are clearly up(dotted green) but testing a resistance around 450. The good performance fo Nvidia (facing some strong resistance (290-310) ) and potential break for Intel after a triple bottom.
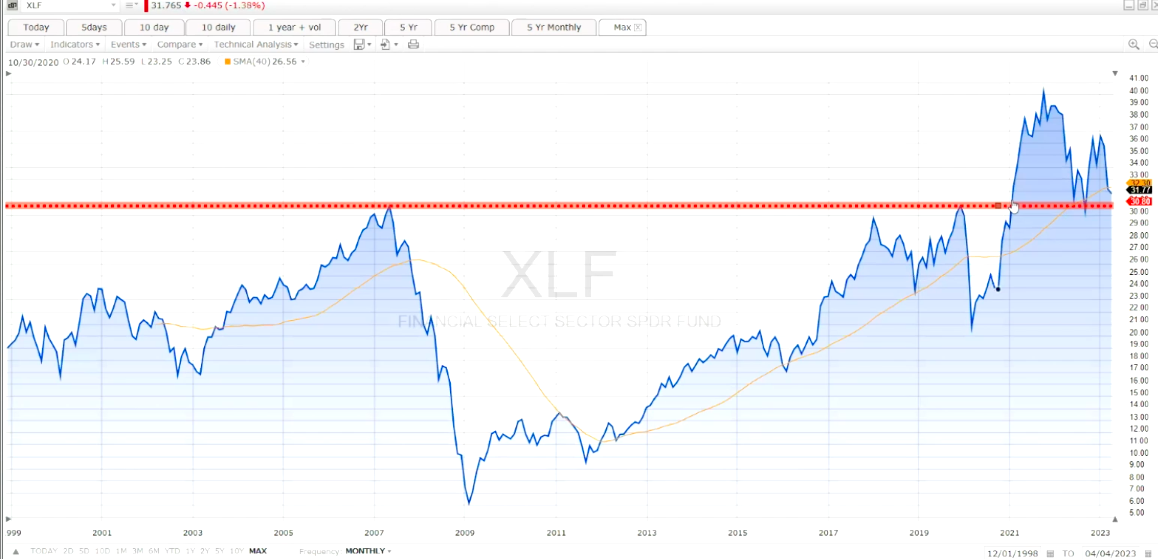
The Financial Sector held the support at 30.5 but is clearly weaker
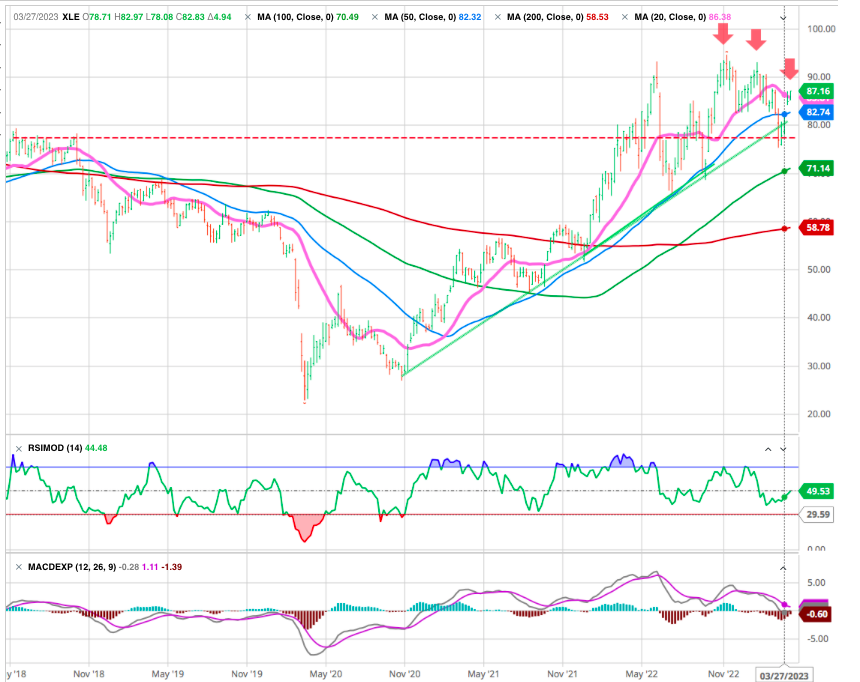
For the Energy Sector although it is holding its uptrend (green dotted) and long term support (red dotted), it nevertheless appears weaker.
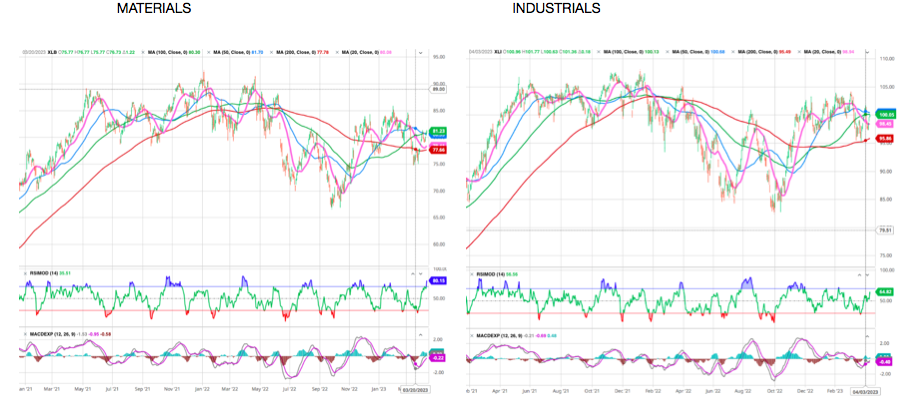
Some other sectors remain positive, Materials and Industrials, although they are topish (which would be normal if we are heading to recession).
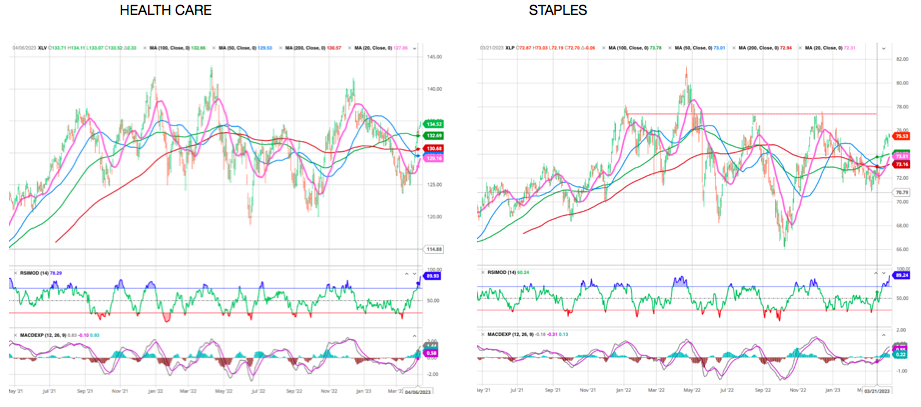
Health care and Staples remain positive as defensive .
Stay tuned


