WEEKLY MARKETS REVIEW AS OF APRIL 19
April, 21 2013
Stocks End Higher, But Log Worst Weekly Drop in 2013

However, the primary cause of the flight from risk was broader concern about global growth prospects, highlighted by the IMF’s downgrade in its latest World Economic Outlook (WEO).
According to the WEO, the IMF now expects global growth to accelerate only minimally this year, edging up from 3.2% in 2012 to a still sub-trend 3.3% in 2013, 0.2 point lower than its January assessment. Notably, the IMF believes that a more prolonged European recession will keep advanced economy growth at a disturbingly sluggish 1.2% in 2013. And although conditions in the US look better, even its growth rate remains lackluster because of substantial fiscal drag. Indeed, the IMF now expects the US to grow just 1.9% in 2013. Meanwhile, the IMF has materially downgraded its 2013 growth expectations for all five of the so-called BRICS (Brazil, Russia, India, China, and South Africa) which together produce over half of developing economy output on a PPP-basis. Alas, the weaker than expected Q1 GDP print for China reported early this week served to highlight the unfortunate possibility of a disappointment.
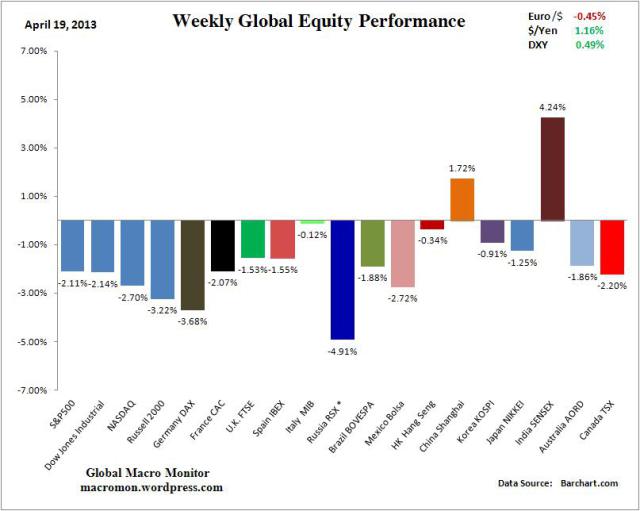
Equities: There was a widespread sell-off, with all markets falling this week. The range varies from a scant 0.1% in Italy (although the MIB continues to lag so far this year) to a marked 3.7% in Germany. The S&P found a bid on Friday following earnings reports from Capital One and Google. As the Dow broke an important trend line at 14,500 Friday “this rally is a little weary,” said Art Cashin “The ‘buy the dips’ have been in and they bought most of the dips. The question is will they continue, or is the market getting ready for the spring swoon everyone is talking about.”
Bonds: Conversely, there was a widespread rally in sovereign bond markets, with 10-year yields falling as much as 11 basis points in Italy and Australia and as little as one basis point in Germany.
Currencies: JPY remains offered, and that will likely continue after the G20 gave Japan leeway to reflate its economy. The RMB caught a bid after the Peoples’ Bank of China suggested that the currency’s trading band would be increased “in the near future.” The short-Yen trade has legs – right up to its chin! The G20 softballed the issue, with everyone committing to not manipulate their currencies – promise and cross my heart – and that leaves the way open for a break below 100
Commodities: Oil caught a slight bid toward the end of the week, but generally remains offered on anemic global growth prospects. Gold continued to fall sharply in the early sessions but then stabilized around $1400 per ounce.
“Sell in May, and go away”
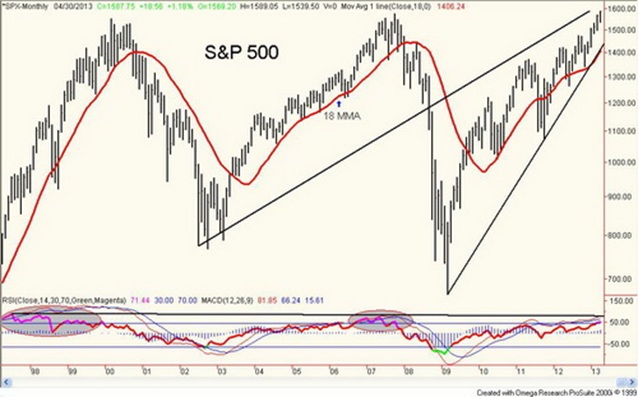
The monthly chart of the S&P 500 is potentially very bearish. The S&P 500 is forming what appears as a huge ascending wedge triangle. The top channel is formed by joining the low of July 2002 with the higher low of February 2003. A couple of things stand out with the channel line. First, the line appears to have acted as the breakdown zone for the financial crash of 2008. The second thing is that the 2011 high touched up close to the channel but failed to breakout over. A sharp correction followed.

The lower channel is formed from the low of March 2009 and up through the low of October 2011. The low of November 2012 tested down towards the line but failed to break it. The current market is testing the top of the channel. Wedge triangles are not unusual. This one just happens to be forming on a long-term chart. The breakdown zone is currently near 1,430 and the 18-month moving average. A breakdown of the wedge triangle potentially implies objectives that could take the S&P 500 in theory all the way back to its 2009 lows (666). Minimum objectives could be at least the halfway point at around 1,130.
Note the indicators as well. Both the MACD indicator and the RSI indicator are making lower highs even as the S&P 500 moves to new nominal highs. The rally of 2002-2007 took 5 years before the S&P 500 returned to its 2000 highs. This time around, the rally took a less time as the market is just over four years from its March 2009 low.
So what is going on? The market was up sharply in January and February. Mutual funds in the US need to be fully invested especially when a quarter end is coming up as it was in March. It is also year-end for a number of funds as well as some hedge funds. Therefore, a market closing higher into the end of March means big performance fees. The early part of April can bring further buying. The funds are usually probing higher to see if there any sellers. As there is incentive for the funds to keep the “party” going for a while so that they can sell to late comers. Then when the market tops and falls, they all announce “Sell in May, and go away”. It is not unusual for markets to have tops in April and October.
There remains a potential objective for the S&P 500 up to as high as 1,605 or it could be up to 1,620. But at this point there are no higher objectives. The market is being driven by QE in the US, Japan and even in Europe as the Euro zone has come back from the precipice of Cyprus by tapping into depositors funds. Depositor’s funds are now at risk in the western economies as it has been revealed that agreements are in place to use depositor fund to bail-in collapsing banks rather than bailouts from the taxpayer.
The first breakdown point of note for the S&P 500 is at 1,535. The low last week was at 1,539. As the S&P 500 climbs in the wedge triangle, time is running out as the wedge narrows. Rather than it being “up, up and away” investor’s should heed the signs as it might well be an “or”.


