

Weekly Market Review as of June 8
June, 10 2013Why Shouldn’t I Work for the NSA? (Good Will Hunting)
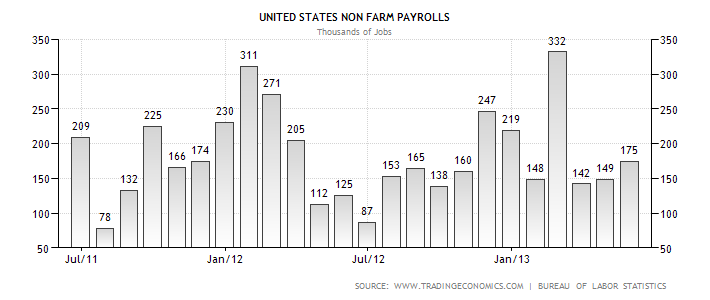
Equities have hit a rough patch in what has been an impressive rally year-to-date. The heightened uncertainty about monetary policy prospects has also eroded risk appetites, especially the rampant speculation that the Fed might be poised to reduce policy accommodation.But the US catches a bid following Friday’s decent jobs print. Non Farm Payrolls in the United States increased to 175 Thousand in May of 2013 from a revised 149 Thousand in April of 2013. Unemployment rate of 7.6% higher than expected

The nearly 20% drop in the Nikkei over the last three weeks deserves special notice (along with the sharp appreciation of the yen and jump in JGB yields). Some BoJ board members are reportedly worried that the “contradictory” signals the Bank is sending out with its extremely aggressive monetary easing has the potential to generate volatility. And ironically, this apparent dissonance in the BoJ messaging seems to have done just that.
Equities:Equities are mostly down on the week. US equities remain in uptrend. The MSCI Emerging Markets Index fell 0.3% last week, outperforming developed markets. The MSCI China Index fell 0.3% ahead of the latest purchasing managers’ index data, as investors looked for signs of a pickup in growth. The International Monetary Fund said that it had cut its economic growth forecast for China from 8% to around 7.75% this year and in 2014 due to weak global export demand. Russia’s RTS fell 4.1%, hit by declining oil prices and a weakening rouble, while Turkey’s ISE 100 was down 5.5% as anti-government protests in Istanbul sparked nervousness among investors. Nevertheless EM as the chart below, which ranks the top 10 equity markets’ total return over these past four years over-performed. Stocks in Indonesia grew 372 percent, Turkey rose 286 percent and Mexico has climbed 211 percent. Even Singapore, Korea and Australia climbed more than the U.S. stocks.


Bonds: Monetary policy uncertainty keeps G7 bonds volatile. Aussie bonds rally on weak data and RBA dovishness. Government bonds were battered over the week as economic data (housing and consumer confidence in the US) printed ahead of expectations and Federal Reserve officials continued to opine on the merits of tapering asset purchases. In addition to all the global liquidity sloshing around, central banks have also “crushed bond yields to the point that almost 50 percent of all global government bond market cap currently trades below 1 percent,” according to BoA-ML.
Elsewhere in the world, the focus remains on easing monetary policy. Thailand became the latest emerging market central banks to cut rates, joining Hungary, Poland and Israel.
Currencies: USD is mostly lower with JPY notably moving well below 100. In contrast, AUD continues to depreciate.
Commodities:Commodities generally rose as the US dollar fell. Falling US inventories further bolstered oil. WTI (West Texas Intermediate) Crude Oil. Having broken down out of its multi-month triangle consolidation pattern back in April, the US oil bench mark, WTI, rallied and has once again re-established the pattern. What this typically means is that sooner or later the price of crude oil will breakout sharply in one direction or the other.

Japan Just Gave Us a Warning of What’s Coming Our Way
Anyone looking for clues as to what’s coming our way in the markets need only look to Japan where the QE forever policy has finally hit the wall. This is how market bubbles burst: the market enters a blow off top and then implodes violently, taking out all of its gains in a fraction of the time it took to create them.

Prior to the Prime Minister elections in September 2012, the Bank of Japan had already launched EIGHT QE efforts equal to over 20% of Japan’s GDP. Throughout this period of money printing, Japan’s rate of GDP growth fell while its unemployment rate barely budged. There was little if any evidence that QE had accomplished anything.
However, this didn’t deter Prime Minister candidate Shinzo Abe from believing that QE was the answer to Japan’s woes. Abe ran on a platform of aggressive monetary expansion. As soon as he was elected he began promising to get the Bank of Japan’s money printers to work. The Japanese stock market, the Nikkei, took the hint and erupted higher, rallying over 70% in less than six months.
Sure enough, in April 2013, the Bank of Japan announced a massive $1.4 trillion QE program (equal to another 24% of Japan’s GDP). And the Nikkei experienced one last blow off top before collapsing. In a matter of weeks, the Nikkei erased all of its post-QE gains, taking out its critical trendline and entering a bear market.
 See our report BANZAI ! Abegeddon
In Japan, the term Banzai! literally means “ten thousand years” and can be used to wish someone long life and happiness. But during World War II, “Banzai!” was shouted in battle. It was the Japanese equivalent of “Long live the king!” – but to soldiers on the other side it came to mean a suicidal, hell-for-leather attack.
If the central bankers of the world think they’re hearing a battle cry of “Banzai!” from the lips of their Japanese brethren, they may not be far from wrong, because the Japanese are indeed on a mad charge to fight deflation at all costs. As with all good suicidal charges, at least in legend and lore, once the cry has gone up and the thundering charge has begun, there can be no turning back.
A New Normal
Sometimes there is no clear theme, and I try to be honest about that. In the past I have described it as a “lull before the storm” and as “waiting for evidence.” This week I see an absence of major new data. At the same time the markets are at a crucial point for both technicians and traders. That is the main reason for the recent volatility.
PIMCO invented and popularized “new normal” and every word by their public spokesmen gets plenty of media attention. I want to highlight an alternative “normalization” viewpoint from Brad DeLong, a Berkeley econ prof. His positions means both that he has the highest qualifications possible and that he will be ignored by most of my market colleagues because of their own biases.
I see the following key questions?
- Is this a potential tipping point for markets – both bonds and stocks?
- What is the real “new normal?”
What will be the new normal? How will the wide gap between the valuation of stocks and bonds be resolved? My own answer has been that the two will converge. Bond and stock prices will both move lower.
Precious Metals Update
In the mid-April commodities smash oil, gold, silver, platinum and palladium all fell sharply. Since then however, palladium has decoupled from the other precious metals, particularly gold and silver, and has rallied by 17.6%.

We participated last week to the second Swiss Mining Institute Seminar highlighting the gold mining industry and trends. It appears that excellent gold stock opportunities are still available in this wonderfully miserable market. Gold stocks represent excellent opportunities to create wealth. (SEE OUR NEXT ISSUE FOR COMPLETE REPORT). The history of this sector shows that there have been critical times to invest to produce life-changing wealth. Not surprisingly, this has typically coincided with times when public sentiment has been at all-time lows. Today’s market is similar to a replay of a movie that we’ve all seen before. The low sentiment toward gold and gold stocks was also very prevalent in 1999.
So what do opportunities for gold look like now and how do I find them? There is real opportunity in this market to buy the all-stars of this industry at a discount.
