Weekly Market Review as of July 28
July, 29 2013“The Walking Dead”
We are in the midst of a thoroughly lackluster recovery in the advanced economies. The US is stuck around 2.0% annual growth, Europe is stagnating, and Japan is just emerging from its third recession in four years. Yet equity markets have rallied robustly throughout the upswing.
In Japan, bad inflation and persistent deflation. The June CPI (Consumer Price Index) ex-food rose 0.4% y/y, the highest rate in almost five years. When energy is stripped out, though, (to make it equivalent to U.S. Core CPI), it was -0.2%. That’s the lowest rate of deflation since 2009.
In China, growth concerns rose. The closely-watched HSBC Flash China Manufacturing PMI was weaker than expected, dropping for a third consecutive month in July, to 47.7, an 11-month low. Prime Minister Li clearly laid out the Chinese government’s goals: “reasonable growth” of 7.5% or better, provided that inflation remains below 3.5%. More importantly, he suggested there was a minimum ‘red line’ at 7.0% growth ,which would spur new stimulus. Beijing ordered cuts to (excess) production capacity in 19 industries.
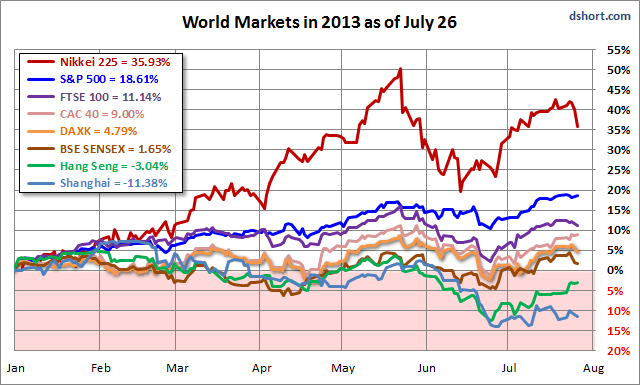
Even those markets that have lagged because of domestic problems are up sharply from their 2009 lows. For example, the Italian MIB has risen 33.0%, the French CAC 58% and the UK FTSE 86%. The other majors have performed much better, with the Japanese Nikkei up 100%, the German DAX 125% and the US S&P 150%.
What explains the divergence between economic and market performance? There seem to be three reasons.
- Equity markets were obviously oversold in early 2009 as extreme risk aversion took hold.
- Profitability has held up remarkably well despite sluggish growth, reflecting job shedding and investment in labor-saving technologies.
- Monetary policy has clearly played an important role. The best example of that comes from Japan, where immediately prior to the prospect of Abenomics, the Nikkei was just 23% above its 2009 low.
The reality is that we have witnessed this same behavior by investors time and time again the outcome of which has never been good. Despite words of advice from some of the great investors of our time that the road to investment success is paved by knowing when to:
- “buy low and sell high”
- “cut losers short and let winners run,” or;
- “buy fear and sell greed”
Side Note :
“The market is unforgiving and can give or take with astonishing speed,” writes a self-described novice investor. “I have experienced about all the emotional aspects of the business and have both made and lost money. I believe I am finally becoming a more patient investor and have definitely learned a lot in the past year. Of course, I recognize that I still have a long ways to go before I approach the maturity level I am seeking…”
Show me an investor who has never lost money on a trade, and I’ll show you someone who isn’t exactly being truthful about his results. Don’t lie to yourself. That’s the most important psychological aspect of trading and investing that hardly anyone ever talks about. Own your losses. Accept that the market was right, and you were wrong. Then move on to your next idea.
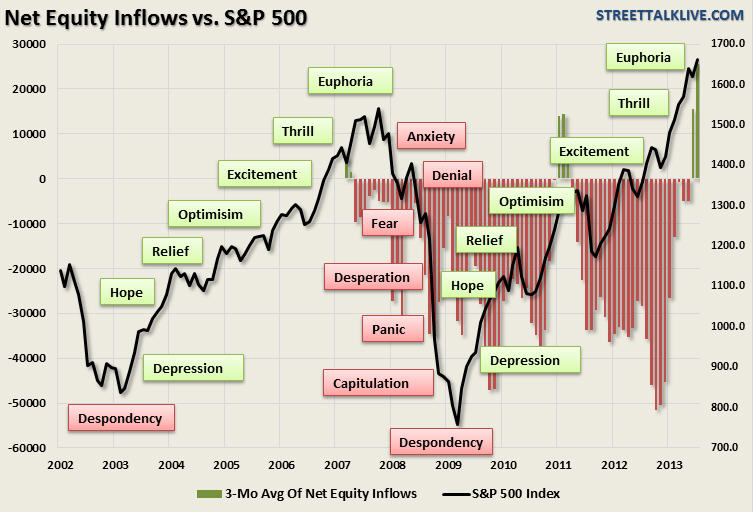
No one is immune to the emotional rollercoaster. How do you feel about the market right now? How do you feel about the stocks in your portfolio? Now take a look at the above illustration the cycle of market emotions:
If you can recognize how your feelings line up with the market, you will begin to see the hidden opportunities that are usually clouded by powerful emotions and poor judgment…
Equities: Markets were mixed this week. The S&P hit a record high 1608.8 (intraday) on Monday, but gave up some ground over the rest of the week. Nonetheless the market still appears to be in an uptrend, unlike its northern neighbor where the TSE has traded sideways over the last 18 months. The French and Italian markets picked up a bid on signs that a eurozone recovery is imminent. Interestingly, the positive sentiment did not extend to the DAX. The Japanese market sold-off ahead of the busiest week for earnings reports.
Emerging markets had no such troubles. iShares MSCI Emerging Markets Index ETF (EEM) gained 1.4%. With U.S. stocks trading near record highs and uncertainty surrounding U.S. Federal Reserve’s tapering, it’s little surprise that U.S. investors wanted to take a pause. Emerging markets, however, have been beaten down so much recently, that at least it’s fair to ask whether they’re now cheap enough to buy ( See report here Markets are Cheap But Cheap Enough to Buy? ).
Still, the gains weren’t spread equally. There were some big winners, sure, but also some big losers. ETFs devoted to Russia, Chile, Indonesia and India all dropped more than 1%, but none got hit harder than the iShares MSCI Turkey Investable Market Index ETF (TUR), which dropped 4.3% after its central bank increased interest rates.
Bonds: Positive economic data out of the US (factory orders) the eurozone (PMIs) and the UK (GDP) lent an offered tone to G7 bonds, but the sell-offs were limited. Fed speak has succeeded in stopping a prospective “rot” in bonds, but officials have not tried (and do not want) to walk the market all the way back. Hence, the yield on the 10-year Treasury note continues to trade between 2.50% and 2.60%, about 35 basis points above the level immediately prior to the infamous Bernanke press conference on June 19. Japanese bonds rallied slightly… somewhat counterintuitive given the acceleration of inflation. See below “let’s rock and rotate”.
Currencies: The yen benefited from the re-emergence of inflation, and the results of the Japanese election which provided the ruling coalition with a working majority in the Upper House. The euro benefited from the PMI data, which suggested that the eurozone is finally emerging from recession.
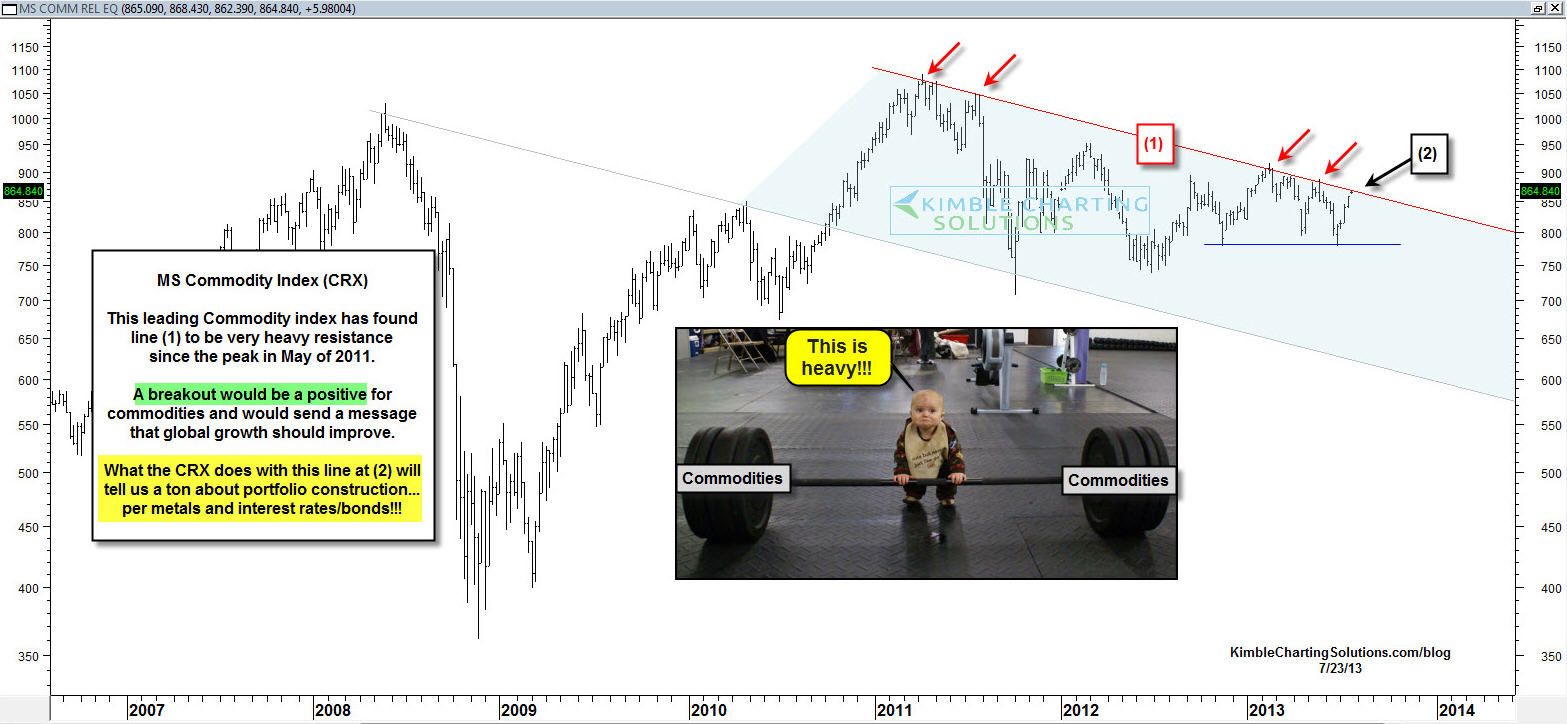
Commodities (MS Commodity Index/CRX) has underperformed the S&P 500 by 40% since May of 2011.
When it comes to portfolio construction, a breakout by the CRX index would suggest that weak performing commodities could push higher and be a plus for the metals complex (gold, silver & copper) and could put pressure on the bond market, pushing bond prices lower and yields higher.
We have to face the fact that, at this time, resistance is resistance. Should the heavy resistance break, portfolio construction/heavier weighting towards this poor performing area should be considered.
The CRX chart below illstrates that line (1) has been very heavy resistance for the past 26 months. What the CRX does with the heavy resistance over the next few weeks will tell us a ton about the global inflation/growth story.
U.S. Stocks: What Now?
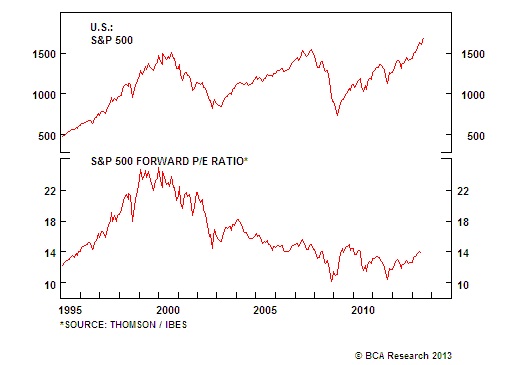
The U.S. stock market is becoming fully valued, with the market trading at 14.5 times forward earnings.
True, corporate earnings are still good and could get even better in the months ahead, especially if global economic conditions improve and the dollar’s appreciation takes a pause. But over the longer run, corporate profit growth will inevitably gravitate toward nominal GDP growth, which should be around 4-5%per annum.
Expected returns in U.S. common stocks should be around 6% (with a dividend yield of 2%). Anything above this expected return should be considered excessive, and would rely on continued multiples expansion. Such expansion remains possible, but will depend on the interaction between the U.S. economy and Federal Reserve policy. Any increase in interest rate expectations may not be conducive for a continued upward re-rating of equity multiples.
Earnings Watch: Halfway through the Year – So Far, So Good
The capital markets were relatively quiet last week. About 2/3 of companies in the S&P 500 Index have beat expectations and revenues are surprising on the upside, tracking for about 6% year over year (y/y) growth. This is key, since there is only limited potential for companies to continue to build earnings through cost cutting.
- ”Smokestack” industrials are OK, as capital spending looks poised for second-half strength.
- The consumer seems to be OK as well, as auto sales have been strong and other consumer discretionary groups have been decent as well.
- Banks are surprising on the upside. Loan demand is rising and lending margins are solid.
- Large-cap stocks are generally doing a better job than small-caps of meeting/beating earnings estimates.
It’s been an odd earnings season so far. Talking heads are replete with examples of ad hoc names that have exceeded beaten-down earnings expectations choosing to ignore the bellwether names that have missed and guided down.
Data are thrown around left and right to support the argument that stocks are cheap to forward-earnings, that growth is around the corner, and that all is well in the real economy supporting the lofty exuberance among US equity markets.
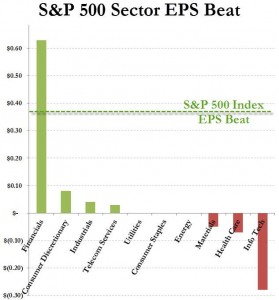
However, if one so chooses, the chart below should give you a glimpse behind the facade of the Q2 2013 EPS ‘beat’. There is one source of the elixir of life, one provider of the mother’s milk of stocks; S&P aggregate Q2 EPS is tracking $0.38 above the season start levels (around 0.8% beat) and financials account for an astounding $0.63 of that!
Transports Lagging Amid Signs of Slowing Momentum
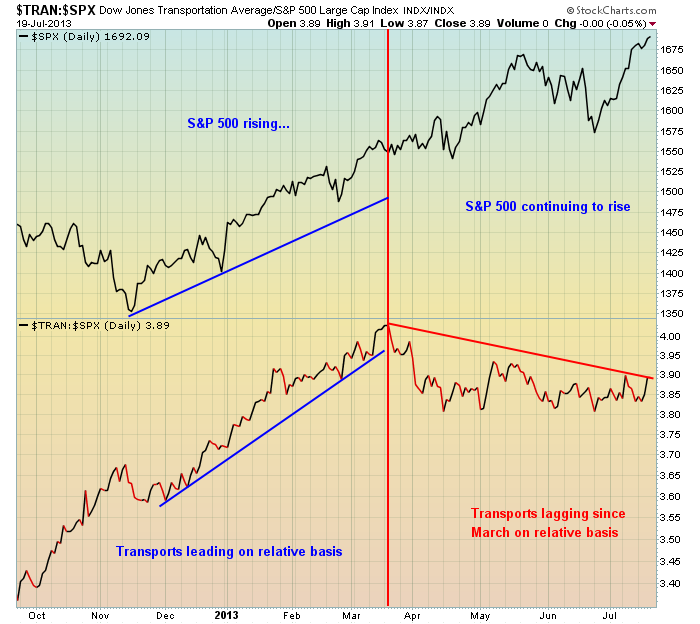
Transportation stocks helped lead the market rally from October 2012 through March 2013, but since that time it’s been a struggle on a relative basis. Relative support resides near the 3.80 level in the chart above – a relative close beneath this level could be an additional warning sign. The biggest problem for transports, however, is the sign of slowing momentum on the longer-term weekly chart. Check out this relative chart:
Let’s rock and rotate
Everybody is rushing to the other side of the bond boat, trying to catch a stiff breeze that could just turn on the sailors. Be careful out there.
 The FOMC will meet again on July 31. There are few expectations that the Fed will look to taper its current asset purchase program in this meeting. The general thought being that the Fed would look to make such a move in September at its two day meeting that will also provide updated economic projections as well as an hour long press conference held by Fed Chairman Ben Bernanke. This would allow the FOMC to lay out the process for the tapering plan.
Lately, Fedspeak has plummeted to new depths of indecipherability as frantic Fed governors, terrified by the extent of the reaction to the slightest hint that the Free Money Express is pulling into the station, have scrambled to fine-tune the effects their hieroglyphics have had on markets.
Dovish! No, hawkish! No, Dovish! Wait… what was the question again? As Bill Fleckenstein noted, “…when I contemplate the amount of damage that will be done by four years (and counting) of QE, I really just shudder in wonder at how big the disaster might be, though there is no doubt it will be a disaster… Either it is going to continue to buy bonds forever, which is impossible, or there is going to be a massive dislocation at some moment in time because someone else is going to have to buy that debt when the Fed ultimately stops.” The important point is that, ultimately, it won’t be the Fed that decides where interest rates are, but rather the market.
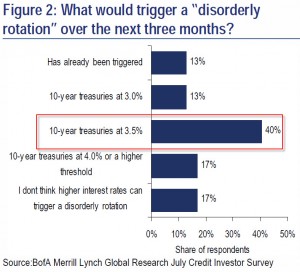
The on-again-off-again ‘great rotation’ from bonds to money-markets to stocks has (so far) seen retail flood into stocks as the BTFATH mentality is rife. Through soothing “word of mouth” intervention, Bernanke’s most important accomplishment over the past few weeks has been to significantly reduce the market’s perception of upside tail risk for longer term interest rates. But, they remain very concerned in the short term about the scenario of a more disorderly rotation out of high grade funds, where credit spreads widen in response to further increases in interest rates. In this case, institutional investors will ‘leave’ risk markets en masse (with no rotation to stocks) as unwinds occur en masse. For now, it appears a 3.5% 10Y rate is the line-in-the-sand for a ‘disordely’ rotation.
The bottom-line:
1)Great Rotation has started at retail level
2) Mainly from IG bonds to stocks (not HY which is seeing inflows again as ‘low-beta’ yieldy stocks)
3) Bernanke managed to keep a lid on rate expectations and calm markets back from the edge…
4) BUT – a disorderly ‘rotation’ remains the major concern
5) 40% of institutional investors see 3.5% 10Y as the line in the sand for ‘disorder’
6) Disorderly rotation is a retreat from risk markets entirely (rates not driven by growth but by unwinds) as its impact on credit spreads would then flow back into equities and make them considerably more expensive on any discounted cashflow basis.
7) Ball is in Bernanke’s court (and the FOMC is coming up soon).
So far, with investors becoming increasingly comfortable with credit spreads, we have seen a more orderly rotation over the past few weeks and credit spreads have retraced much of their rates induced widening.
However, clearly the increase in rates has been sufficient to start the rotation out of bonds, into equities on the retail side. The most recent development has been the strong rebound to significant high yield inflows we saw this week. However, high grade bond funds are still experiencing outflows – especially when disregarding the consistent inflows to short term funds.
But unless Bernanke manages to keep a lid on interest rate volatility, despite the increase in interest rates, we think the risk is that institutional money moves to the sidelines (at least initially).
Your feeling woefully but happily inadequate analyst


