MARKETSCOPE : The Bear Season : Episode V : Bull trap ?
March, 21 2022Hawks are Bulls Best Friends
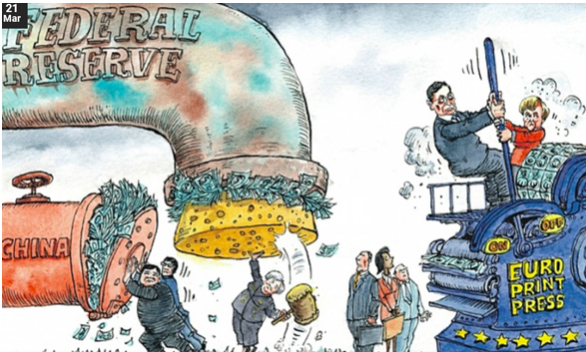
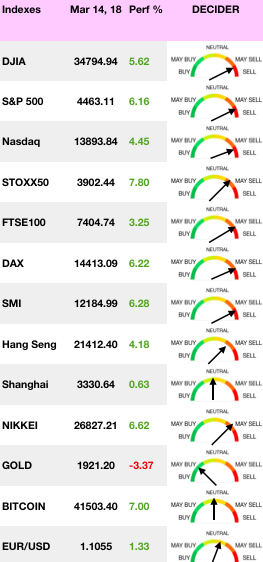
This week saw a rebound in the world’s major stock markets, as they seem to be adjusting to the Ukrainian conflict as the FOMC meeting went off largely as expected. The Fed hiked rates by 0.25% the first time in 3 years to counter inflationary pressures.
Stocks closed out their best week since November 2020, as buy-the-dip investors sprang into action after the market started the week from an oversold position.
The week’s big move came even after the Federal Reserve raised its benchmark rate for the first time since 2018, as the Fed move was widely expected, which helped embolden bullish sentiment. -SEE BELOW-.
Inflation, on the other hand, is taking hold in a rather permanent way. Supply chain bottlenecks and strong post-pandemic household demand already boosted inflation, and rising energy prices following economic sanctions, and possible embargoes against Russia, could push inflation to new highs.
In China, the government is looking to implement measures to boost the economy, but also to maintain stability on financial markets and develop effective policies against property risks.
Technology shares led stock gains after investors endured a $3.5 trillion triple witching event and a rebalancing of benchmark indexes.
This environment has caused renewed enthusiasm among investors, who are now more risk averse. But beware, the optimistic investor sentiment is still very precarious, and could be shattered by any additional bad news.
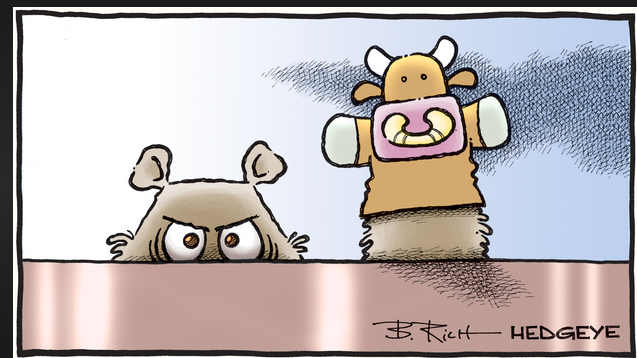
Bears hiding (Bull trap?)
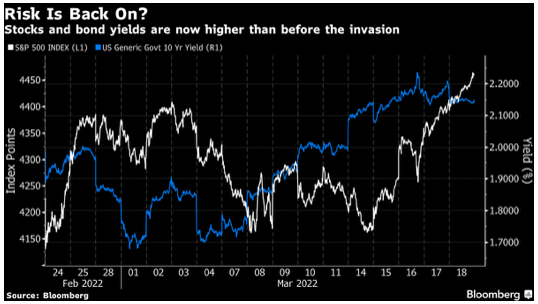
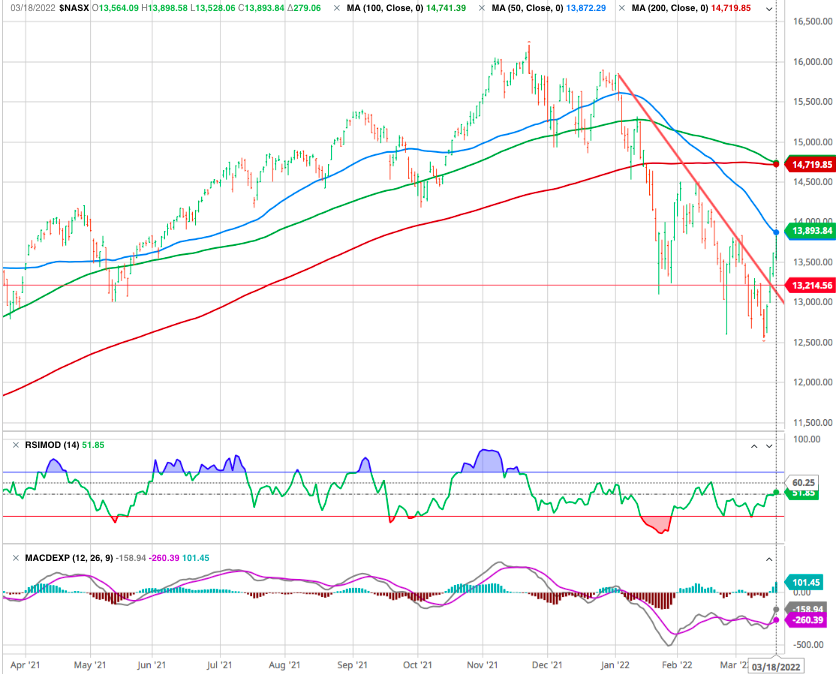
If you look at the markets, it appears as though it’s safe to take risk again and the worst is over. U.S. stocks are now comfortably higher than they were at the point of the invasion, while bond yields have risen to significant new highs after a brief flight to safety :
We previously stated that any rally above the downtrend would test the 50- and 200-dma averages. That test occurred on Friday, with the index clearing the 50- and sitting just below the 200-dma our reference indexes. With markets back to short-term overbought, it may be challenging for markets to clear resistance next week.
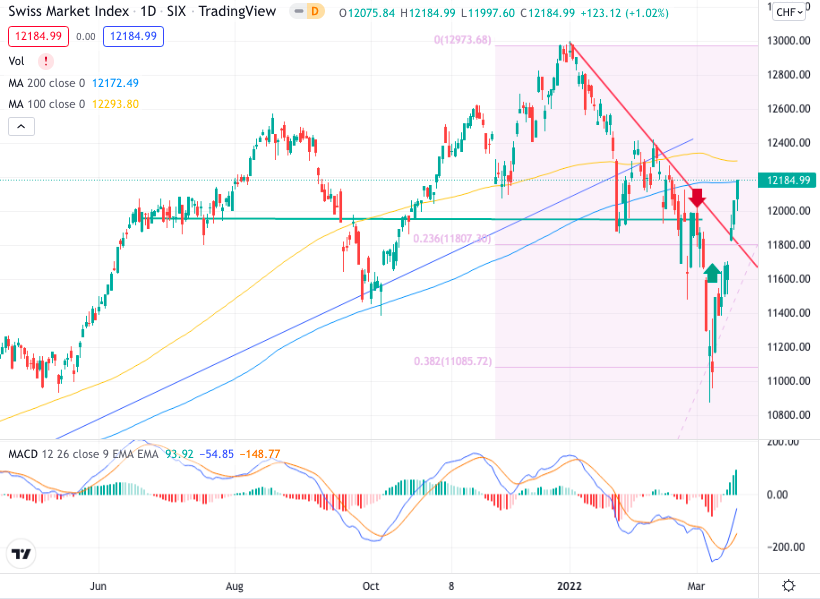
As for the Swiss Index after testing the 38.2% correction support it surged up to 23.6% level and breaking upside the congestion level as well as the downtrend line and testing the 200 MA acting now as resistance.
Some issues suggest this rally may be limited to the upside, keeping this a more tradeable rally.
- Liquidity that drove the rally from the 2020 lows is reversing.
The Fed is hiking interest rates. - Inflation is hot.
- Earnings will slow along with economic growth.
- There are a lot of “trapped longs” that need an exit.
That negative sentiment could be very constructive for a relatively strong counter-trend rally that will likely surprise the bears. However it could also be a set-up to trap the bulls later this year as we potentially face a “policy mistake”.
All in all this could be the “everything bubble” finally bursting and the pain could ripple throughout every household in America for years to come.
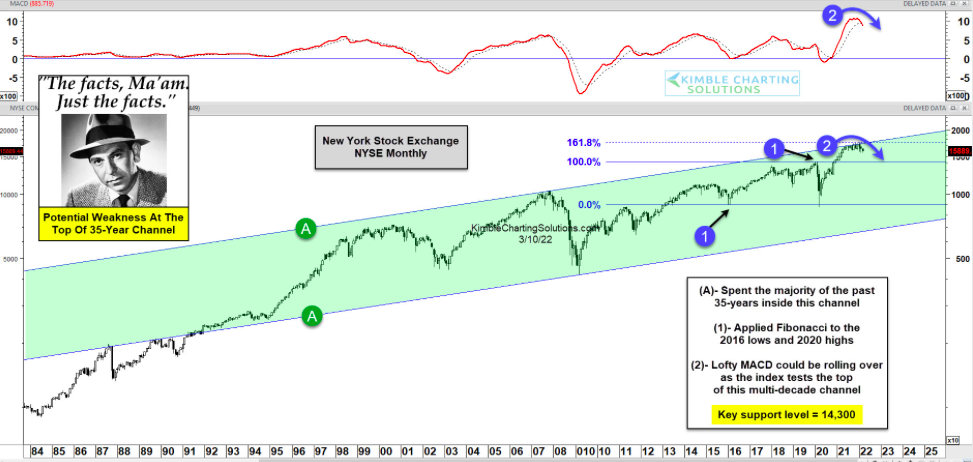
A long-term “monthly” view of the New York Stock Exchange (NYSE) and highlights why this stock market index is at risk of rolling over.
As you can see, the NYSE spent the past 35 years in a rising trend channel marked by each (A). And more recently, price reached the top of that channel (resistance) and began to turn lower.
But this area turned out to be more than just channel resistance… it’s a major 1.618 applied Fibonacci extension level as well (when using 2016 lows and 2020 highs). And as the NYSE price hit this 1.618 Fibonacci level, the MACD (momentum) indicator hit some of its loftiest readings on record… and began to turn lower.
So with price and momentum turning lower from the top of a 35-year channel, it’s probably wise to stay cautious.
TINA : What Else ?!
You have heard this one before, but it continues to be a reason to give ballast to stocks. Cash might give flexibility, but it doesn’t yet provide any kind of an attractive return. Bond yields are rising, meaning that people are selling bonds, and if the Fed is telling the truth about its intentions, it makes sense to expect them to fall further.
Some things currently suggest a follow-through rally is possible, encouraging the “bulls” to declare the “bottom is in.”
- Extremely negative investor sentiment.
- High cash levels.
- Low equity positioning by fund managers.
Stocks seems the best alternative. With the Fed and higher inflation expectations prompting people to sell bonds in recent weeks, the only sensible refuge was equities, particularly in the U.S. If a recession can somehow be avoided, on this argument, stocks should be a sensible place to shelter — not a great time to invest but better than anything else.
That negative sentiment is very constructive for a relatively strong counter-trend rally that will likely surprise the bears. But it could also be a set-up to trap the bulls later this year as we potentially face a “policy mistake”.
Against this backdrop, we nonetheless continue to like the following themes:
- Switzerland (given its defensive stance thanks to healthcare and staples companies) .
- UK (given its exposure to energy, mining companies).
- Materials (as the sector offers a hedge against rising prices) .
- Gold (A safe haven as inflation and uncertainty rise).
- Alternative energy (as the theme comes back amid rising crude and gas prices). Look at Uranium !
- Cybersecurity (given the recent rise in cyber attacks around the world).
Another way to offset that is to overweight energy ( hedge against inflation), financials ( hedge against rising rates). Move from emerging markets ( typically don’t do well when FED rates go up) and move into Europe ( oversold markets now).
OIL
While oil prices have given up some ground this week, volatility has not abated. The last few sessions have remained turbulent, with often brutal daily movements, both up and down. Operators are closely watching the talks between Russian and Ukrainian delegations, looking for the slightest sign of appeasement that would be synonymous with an easing of prices.
GOLD
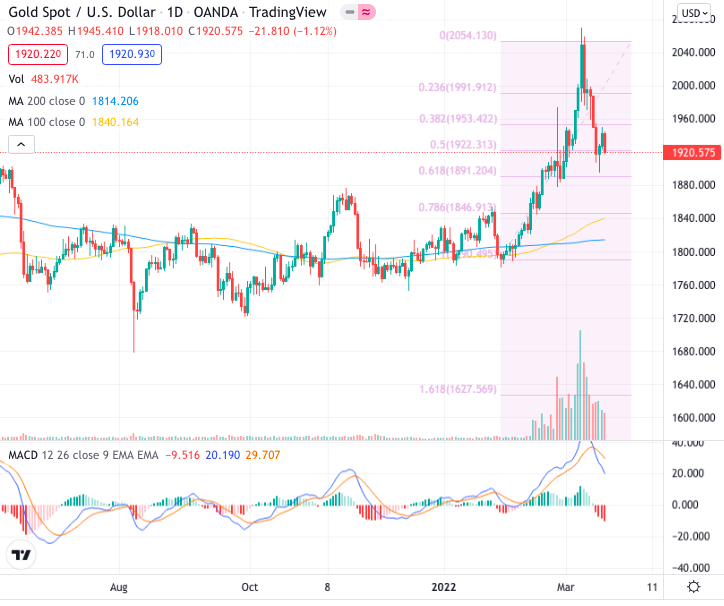
The uncertainty pushed gold down for a second straight week, to its biggest weekly decline in percentage terms, since November.
Following through with the Wednesday rate decision, Fed Governor Christopher Waller – one of the more hawkish members of the FOMC – said U.S. economic data is “screaming” for bigger half percentage point rate hikes in coming months to stamp out inflation. Fed Governor Christopher Waller ’s hawkish comments, along with similar messages from other Fed representatives, helped the dollar rebound Friday, thumbing down commodities denominated in the currency, including gold.
Investors have regained some risk appetite, as evidenced by the changes in the world’s major stock indices. This is at the expense of gold, but also of the precious metals segment in general, as silver, platinum and palladium recorded a week of declines.
Still, pressure prices combined with concerns about fallout from the Russia-Ukraine war played up gold’s dual economic-political hedge to bring it back above the $1,900 support it briefly broke earlier in the week (rebounding on the 61.8% correction of the last up wave).
The weekly stochastic of 60/75 had a negative crossover with RSI 59 points south, all ingredients for a continuation of the downside if prices fail to break above $1,960-$1,985.
We would have consistent buying between $1,880-$1,920 as any further acceleration on the war front can take gold back up to $2,010 and $2,070 in a short spell.
Technicals aside, gold’s volatility comes largely from the war in Ukraine, which can continue to cause dramatic and wild swings,
CRYPTO
Nervousness in the cryptocurrency market has come down a notch this week. Despite a still very tense geopolitical environment, the market leader, bitcoin, has now been hovering around $40,000 for many days. It must be said that in this burning political and economic context, the appetite of investors for digital assets, considered risky assets, may still be suspended for some time. A situation that puts the nerves of crypto-investors, who are used to large amplitudes on the price of the crypto-currency, to a severe test.
Will the Tightening Bring a Recession ?
TIGHTENING
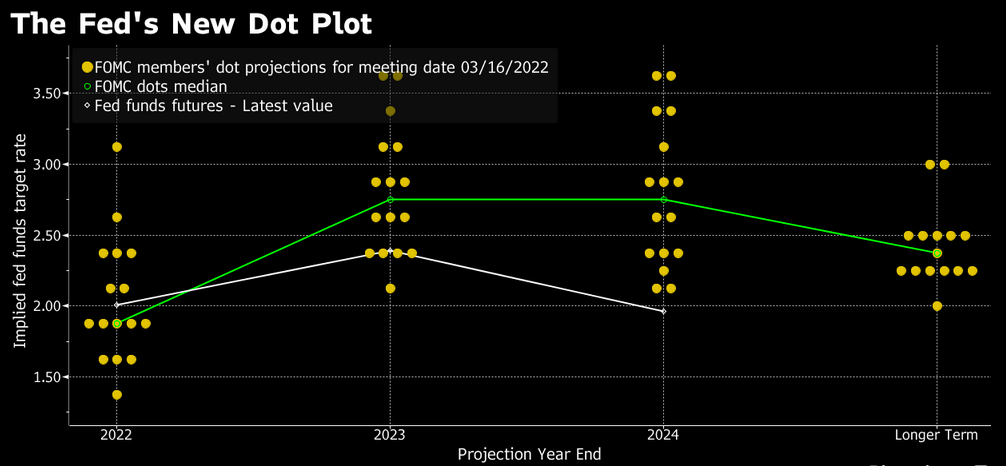
The FED decision was expected, but the summary of economic projections took what many saw as a hawkish tilt, with the median forecast for rates to end 2022 at 1.9%, up from 0.9% in December, and the majority of Fed officials looking for seven hikes this year. Officials see rates at 2.8% at the end of 2023, up from 1.6% at the previous Fed meeting.
FED DOT
The Fed dot plot, released periodically by the Federal Open Market Committee (FOMC), indicates each FOMC member’s projections of the future federal funds rate over the next three years. More specifically, each Federal Reserve member anonymously indicates their own midpoint of target range for the federal funds rate for the end of each of the following three years. Each member’s dot reflects their own idea of the appropriate policy path to take in order to foster economic activity and maintain inflation around the Fed’s 2% target.
This tightening of monetary and liquidity conditions is predicated in an environment of strong economic growth (especially the job market), and high inflation. At this stage, the Fed appears more concerned by the risk on higher inflation from the Ukraine war, than by potential downside risks to US growth.
A less strong, but still upward economic growth outlook for the US: the Fed has revised down its GDP growth forecasts for 2022 (from 4.0% to 2.8%), to a level still clearly above the 1.8% long term potential growth rate of the US economy.
Higher inflation for longer: the Fed has revised its inflation forecast higher, not only for 2022 (to 4.3%) but also for 2023 (to 2.7%) and 2024 (to 2.3%). Therefore, in its current scenario, the Fed doesn’t see inflation coming back in line with its 2% target for quite some time.
The unintentional comedians at the Fed don’t think this aggressive rate hike schedule will cause a recession. Or will they revised their attitude when the economy slows significantly?
It is a big problem, with the Federal Reserve already stuck between a rock and a hard place with regard to monetary policy. Soaring commodities and red-hot inflation mean the central bank will need to accelerate its tightening, though doing so risks tipping the economy into a recession. On the other hand, taking more of an accommodative state and allowing inflation to rip higher would likely result in the same outcome.
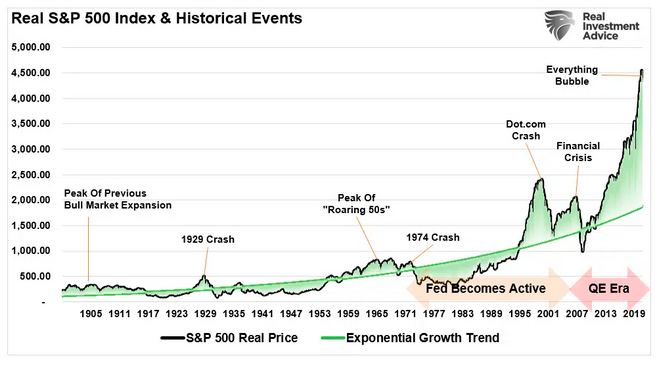
Lastly, the Fed is hiking rates with the financial market’s deviated from long-term growth trends.
The massive flood of liquidity from the Government, the Fed’s zero-interest-rate policy, and $120 billion in QE created inflation in consumer prices and financial assets. Currently, market valuations are more extended than at any other point in history other than the “Dot.com” bubble. We can realign the data above with valuations.
RECESSION
On the other hand, the question is whether the economy will turn into recession. Significantly, historically, economic recessions have had the power to turn corrections into bear markets.
On average, according to Deutsche Bank’s analyst Jim Reid “it takes around three years from the first Fed hike to recession. However the bad news is that all but one of the recessions inside 37 months (essentially three years) occurred when the 2s10s curve inverted before the hiking cycle ended.”
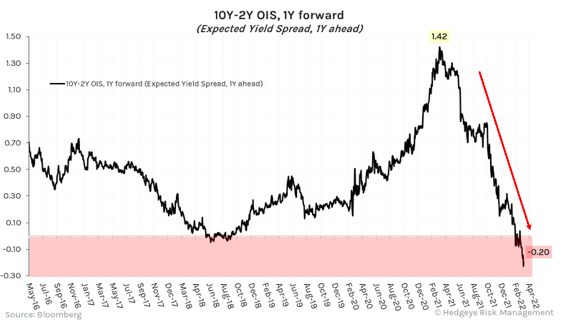
As a reminder, none of the US recessions in the last 70 years have occurred until the 2s10s has inverted. On average it takes 12-18 months from inversion to recession.
The chart above shows the expected yield curve in 1 year, which is currently inverted at -20 bps. While not every inverted yield curve has preceded a recession, every recession has been preceded by an inverted yield curve…
Conversely, most of the time, a bear markets suggests recession is imminent.
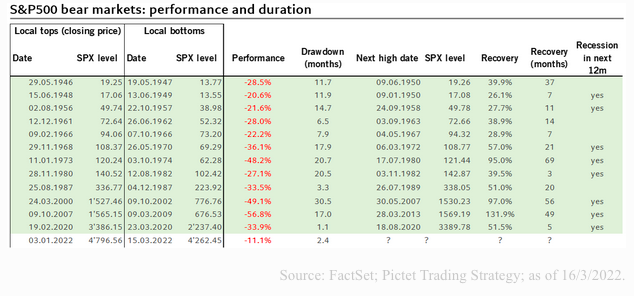
The table below from Pictet Treading shows the historical market performance data for each instance the S&P500 has fallen into a bear market since 1945.
Of the 12 previous bear markets recorded since 1945 for the S&P500, recession has followed within 12 months of the start of the bear market in 8 cases.
It also shows how bear markets have historically tended to be more intense and have lasted longer when the economy has fallen into recession.
The extent of the correction in the S&P500 could depend on the probability of a recession in the U.S. economy
Has the Ice Age ended?
With inflation on the rise, the era of negative bond yields seems to be coming to an end. Will this new paradigm curb risk-taking and lead to asset class rotation?
After decades of low and negative interest rates, the frozen global economy is showing the first signs of thawing with bond yields making their way back into positive territory. Will this drive capital away from riskier investments?
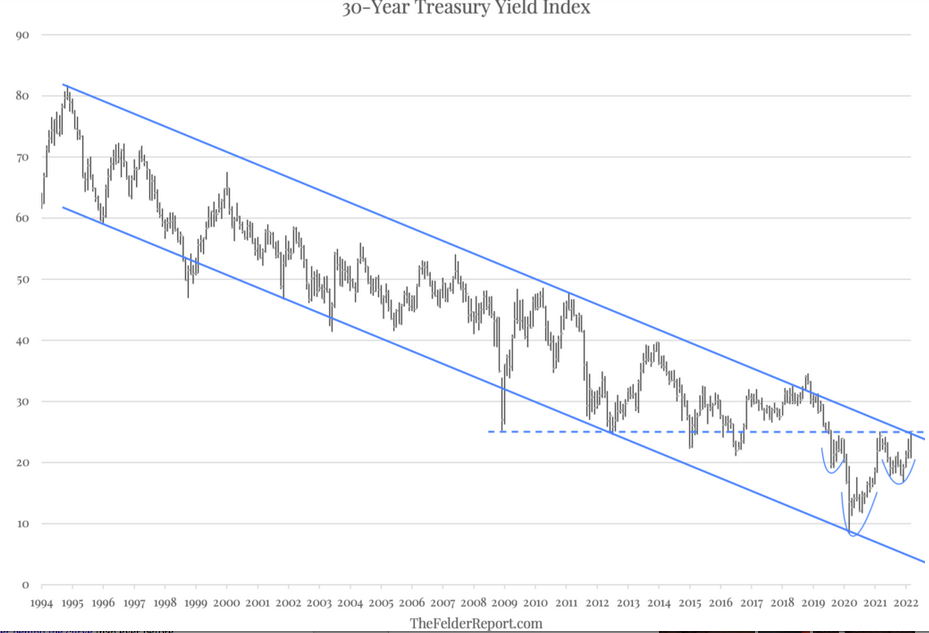
The long-term chart of the 30-year treasury yield from TheFelder Report may now be the most important chart in the world. For the past 30 years or so, the yield on the long bond has formed a fairly neat channel that has only been violated relatively briefly at times. The drop below 1%, at the height of the Covid panic, tested the lower end of that channel. Since then, it has reversed higher and now appears poised to test the upper end. This area also coincides with key horizontal resistance at 2.5% that dates back to the lows put in at the height of the Great Financial Crisis.
In reversing from its low two years ago, the 30-year yield has also formed a pretty clear inverted head and shoulders pattern so it appears we are at a crucial spot for the multi-decade bond bull market. A reversal lower here for the long bond yield would suggest that the bull market remains intact; a breakout higher, however, would suggest it has finally come to an end. It would also indicate that, after a very long hiatus, the bond vigilantes may have returned and are determined to pressure a Federal Reserve that has fallen further behind the curve than ever before.
Happy trades


