No News Is Good News !
March, 11 2024All things being equal, the timing for the first Fed and ECB rate cuts is drawing closer. As long as this statement remains relevant, investors have little cause for alarm. Appetite for risky assets therefore remains intact.
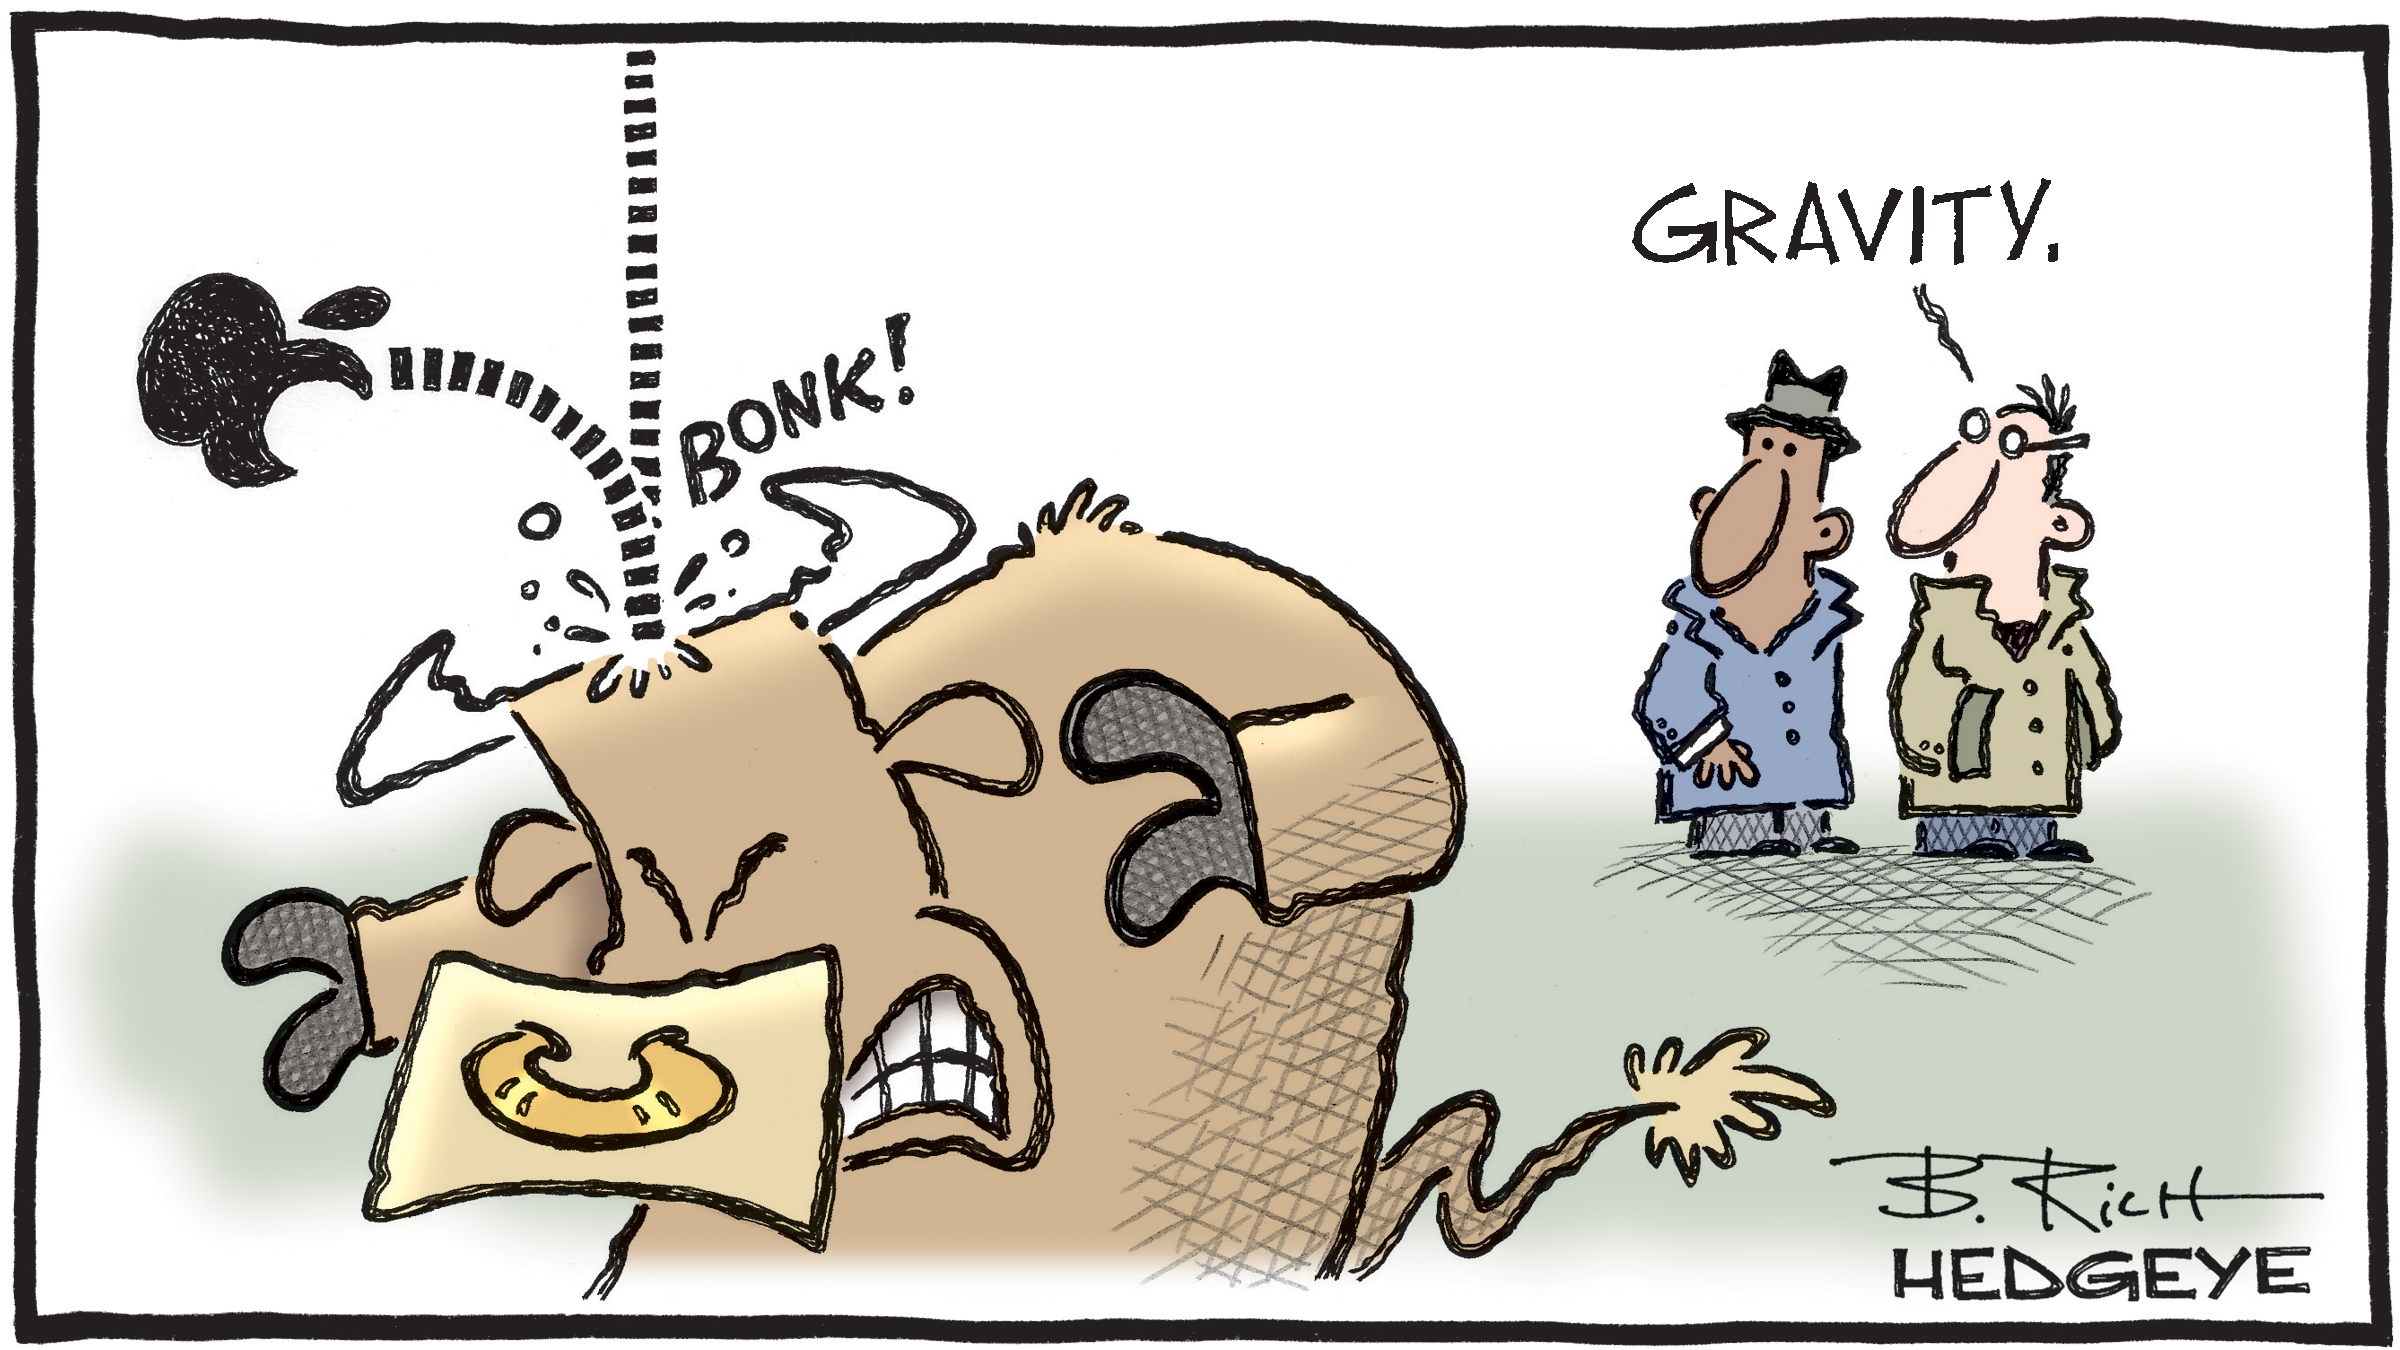
Bulls walking across the ice should start to watch their step more closely.
Traders Check Avalanche Conditions
Fed Chair Jay Powell told Congress that the Federal Reserve was “not far” from having the necessary confidence to cut rates. Christine Lagarde lowered the European Central Bank’s forecasts for both growth and inflation for this year — and said that the ECB might have enough data to start cutting in June. This led to great excitement in stock markets.
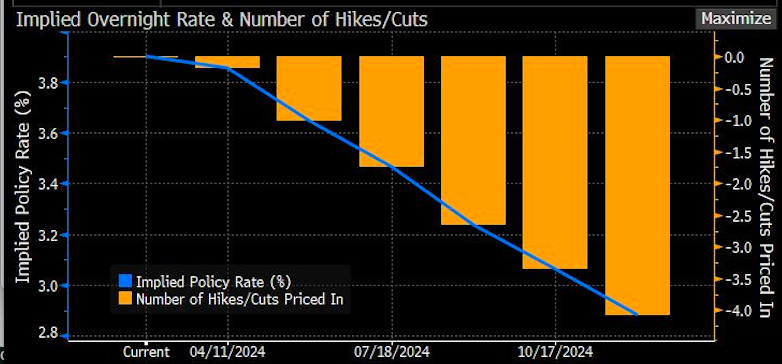
Market dialled back the prospect of an April cut (18.3%). June is likely the starting point for cuts (fully priced by the market), and Lagarde’s tone gave the impression that the ECB wants to move slowly through the easing cycle..jpg
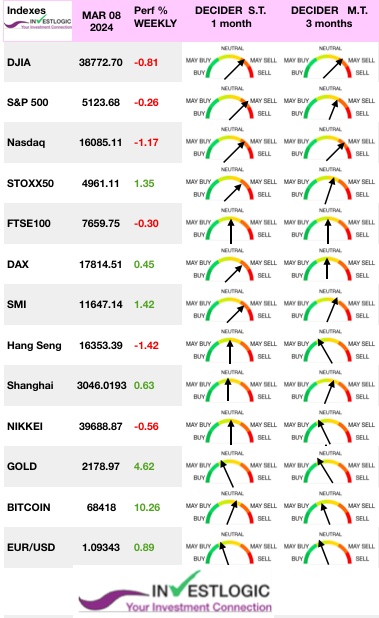 The S&P 500 and Nasdaq Composite indices reached new record intraday highs before pulling back late Friday. Small-cap and value shares outperformed, while mega-cap tech shares lagged due in part to a decline in Apple following reports about slowing iPhone sales in China.
Gold soared to a new record high just shy of $2200 on Friday. Bitcoin hit a new all-time high at $70,000 on Friday.
Fed Chair Jay Powell gave his semiannual testimony to Congress and basically repeated the Fed’s narrative from the January FOMC meeting. He did not update the narrative with the most recent data on the labor market and inflation.
Jerome Powell’s less-hawkish than expected comments and the downside economic surprises helped push the yield on the US 10-year to its lowest intraday level (4.03%) since February 2.
It is important not to rush into anything, while being aware of the risks of an overly restrictive policy on the health of the US economy. In short, he left the door open to a first rate cut in June, which is all the market was waiting for. Meanwhile, employment continues to be resilient.
In Europe, the ECB has left rates unchanged and looks set to start cutting them in June. STOXX Europe 600 Index gained ground for the seventh straight week, hitting a record high as ECB keeps rates steady but cuts macro forecasts.
China once again blew hot and cold: the targets set by the authorities for 2024 are rather ambitious, but the market finds it hard to see how they can be achieved unless Beijing introduces more promising public policies.
It’s off again for a round of US statistics this week, with price data. The consumer price index report for February will be closely watched next week. Economists expect headline CPI to rise 0.4% month-over-month for February and be up 0.3% for the core CPI, February producer prices and consumer indicators (retail sales, University of Michigan consumer confidence).
MARKETS : Fearlessness Is Carelessness in This Bull Market
It’s getting a bit “number go up” in US equities. Despite the incessant advance, there are still several tailwinds to keep the rally intact. But that does not mean investors should become blasé.
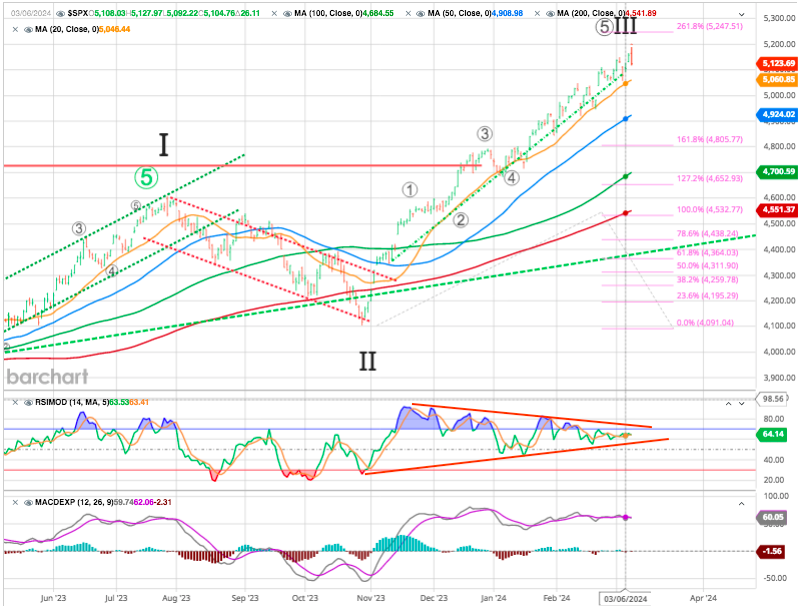
The market tested the 20-DMA (orange), the bottom of the trend channel, early in the week, which sparked buyers to push the index to all-time highs by the week’s end. At the same time, volatility remains compressed, with the deviation from the 200-DMA growing. As shown, the breadth of the market and momentum are both negatively diverging from the rising market, which historically serves as a warning.
To date, the rally off the October 2023 low has provided very little retracements.
We had a set-up which points us to the 5285 (2.618 % of wave 1) the next resistance level. see Fibo expansion we put on the chart for your convenience).
As we are approaching it now, and possibly completing the wave 5 of III we can expect a pullback this week. If that pullback is corrective, and we do not break back below 4950 (which is basically where the market bottomed during that last pullback and 50 DMA.) we have a set-up which will then point us to the 5350.
However whether this rally ends, and we then break back below 4950, and suggests that breaking that support will cause the algos to start selling. Such a switch in market dynamics would likely lead to a 5-10% correction over a few months. it will open the door to a major market top in 2024, a potential decline that can be exceptionally rapid and violent in nature.
We have a first support support in the SPX is in the 4785 area (top of wave 3). Alternatively, a break of support at any point in time now will open the door for the larger pullback pointing us down towards the 4350-4500.
Bull markets can be particularly inflammatory as they have a habit of persisting for much longer than many believe possible. Whether you think that’s a good thing or not, it is what it is.
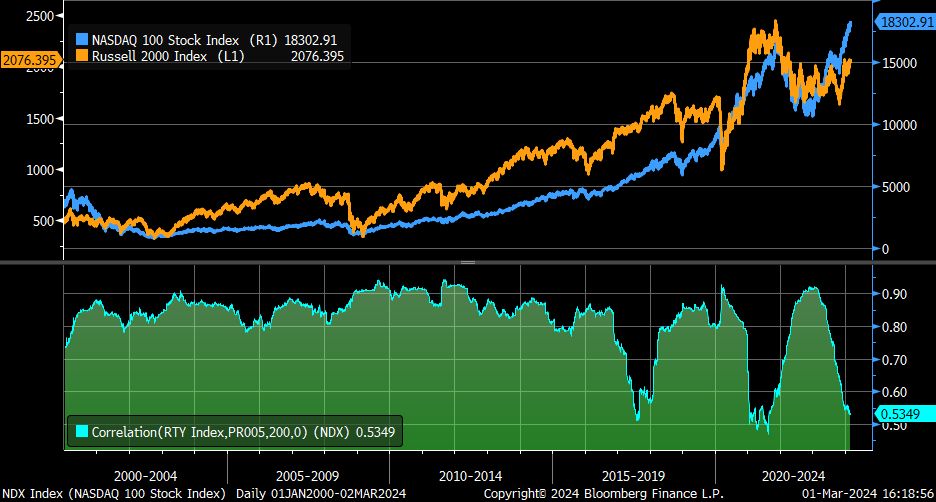
Over past year, rolling 200-day correlation between moves in NASDAQ 100 (blue) and Russell 2000 (orange) has broken down … quite a shift from 2000-2016, when indexes were moving together
Nonetheless, even the most fervent bulls should be acutely aware that they are on a frozen lake, where they could be walking on thin ice long before the surface betrays any signs of it.
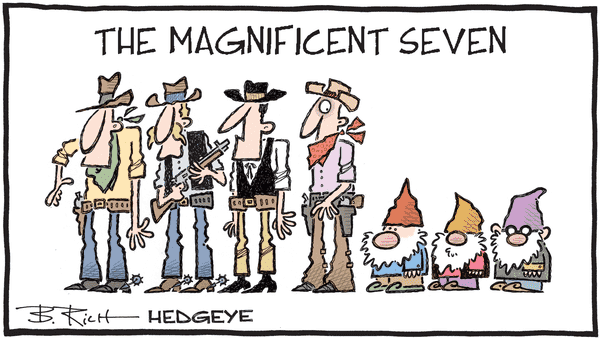
Last year it paid to own just 7 of the largest cap stocks and stay the hell out of everything else. Now the market is beginning to shoot dead the leaders of last year’s top-heavy rally.
“While The Market Is Not Yet In Bubble Territory, Tech May Already Be”
Despite a generally positive trend with stocks enjoying a seventh consecutive week of inflows totaling $91 billion—the strongest streak in two years—technology funds faced the “largest outflow ever” of $4.4 billion, according to Bank of America.
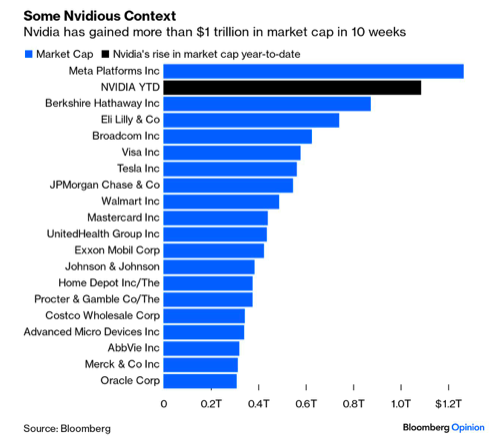
The Magnificent Seven make things tougher, as they are far from equal. Anyone benchmarked to the S&P 500 is more or less obliged to hold them, but it makes a difference which you hold. Only Meta Platforms Inc. and Nvidia are ahead of the Magnificent Seven index at present, with the whole group increasingly reliant on Nvidia. Nvidia has now tripled since the previous market top at the end of 2021.
Meanwhile, two Magnificents — Apple Inc. and Tesla — have dropped below their 200-day moving averages, suggesting they’re in a long-term downward trend. Alphabet Inc. is close to joining them. Dispersion is significant. Such dispersion creates opportunities, but also a lot of risk.
The extra value that the market has accorded to the Nvidia in the last 10 weeks is more than the entire current market value of Warren Buffett’s Berkshire Hathaway.
Source Bloomberg Opinion
There are undoubtedly signs of excess across markets. The stock prices of AI firms will suffer if heightened expectations don’t match up to reality, but they are very unlikely to go to zero, as happened to many companies in the Dotcom bust.
Source- TME.
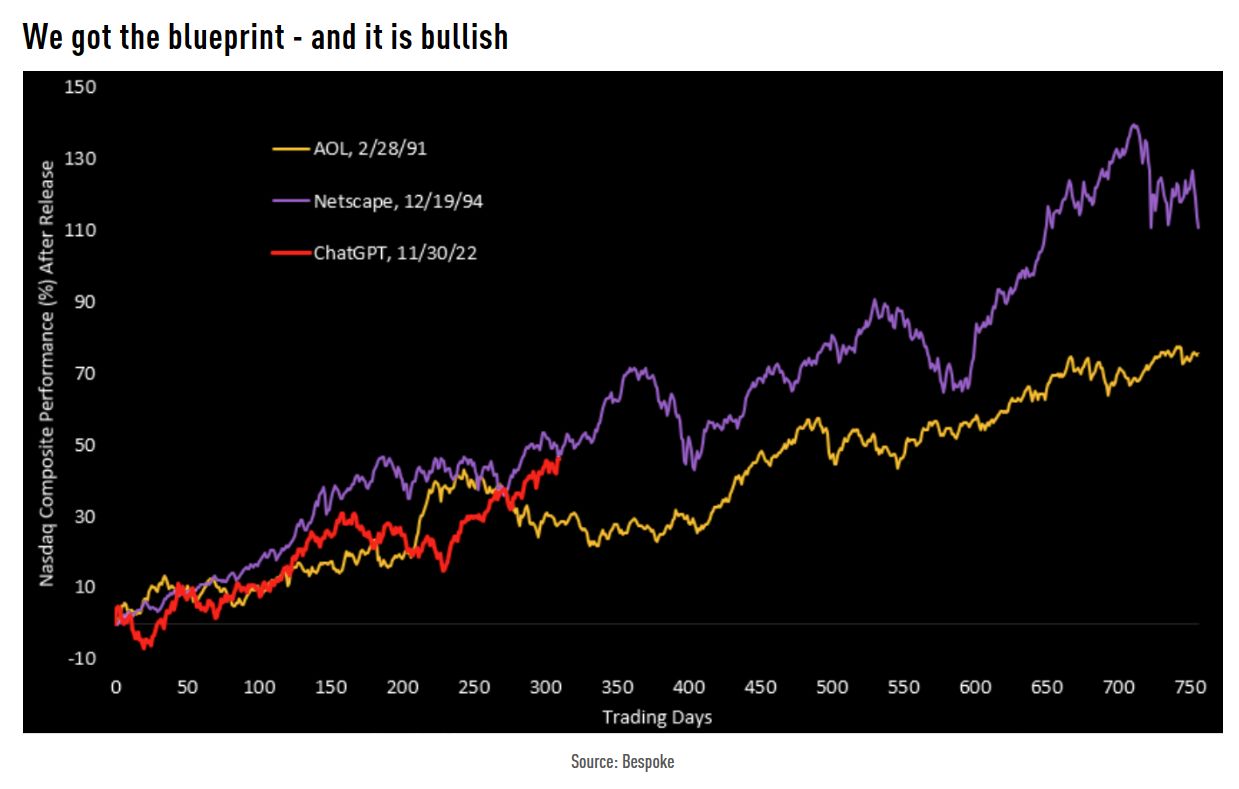
It’s been 309 trading days since ChatGPT was released on 11 30 22 and the Nasdaq is up 46.07 %. In the 309 trading days after Netscape (the first web browser) was released in December 1994, the Nasdaq was up 45.9 %.
Nvidia : Bull markets end with euphoria.
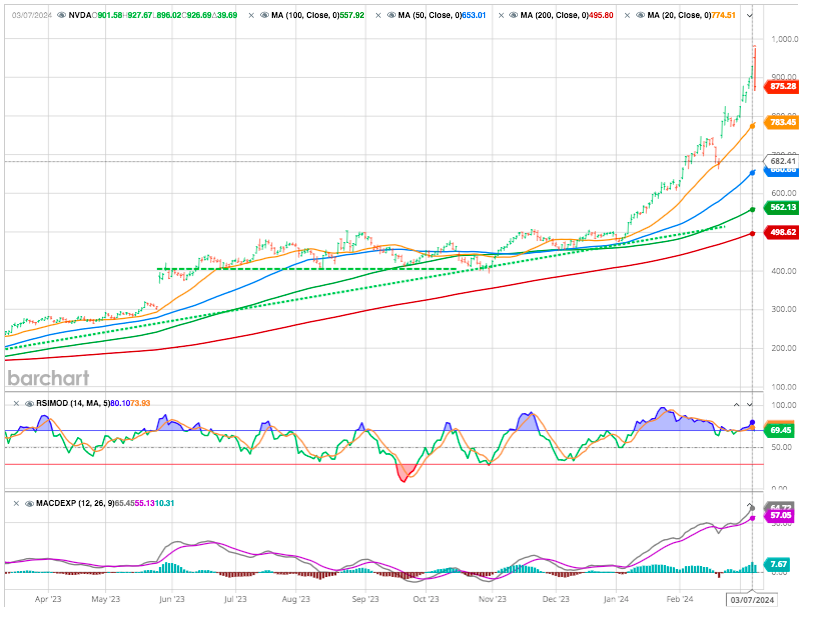
Last Friday, Nvidia’s 10% intraday decline (peak-to-trough) represents a decrease in value of a quarter of a trillion dollars in a few hours. This is most likely the largest ever daily % bearish candle on a $2T company. Although after its recent surge, there’s nothing too worrying about that. Nvidia Corp.’s market cap dropped almost $120 billion on Friday, but that still left it up $210 billion for the month.
Past Friday, NVIDIA shaped a price action called “bearish key reversal”. The theory states that the invalidation level is half the range of the key (920) and the target level is the range of the key projected from the low point (756).
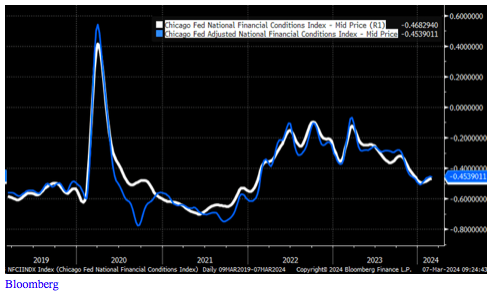
Financial Conditions Have Eased
Excess liquidity (the difference between real narrow money growth and economic growth) is still rising. It is difficult for risk assets to sell off significantly when excess liquidity is abundant.
The easing of conditions has been relatively consistent over the past year, with easing seemingly picking up in November, but it has shown some tightening in recent weeks.
Source Bloomberg
It isn’t clear if this is a change in trend or a short-term bump. One would think, though, that if conditions continued to ease, recent economic activity may only strengthen further.
GOLD
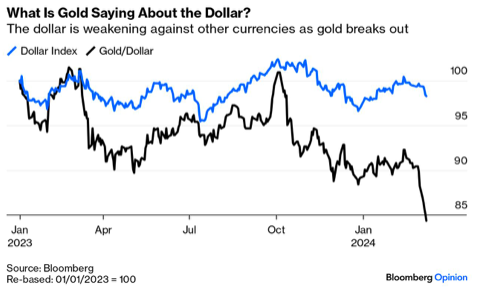
The dollar is falling against its main trading partners, in what may reflect anxiety, but it’s just had a startling drop against gold, which has broken out to set new records.
Generally, gold fares well on rate cuts, while the dollar is weakened. But the probability of rate cuts has barely budged in bond markets and futures, while currencies have moved sharply. That implies that the gold market is picking up something it doesn’t like.
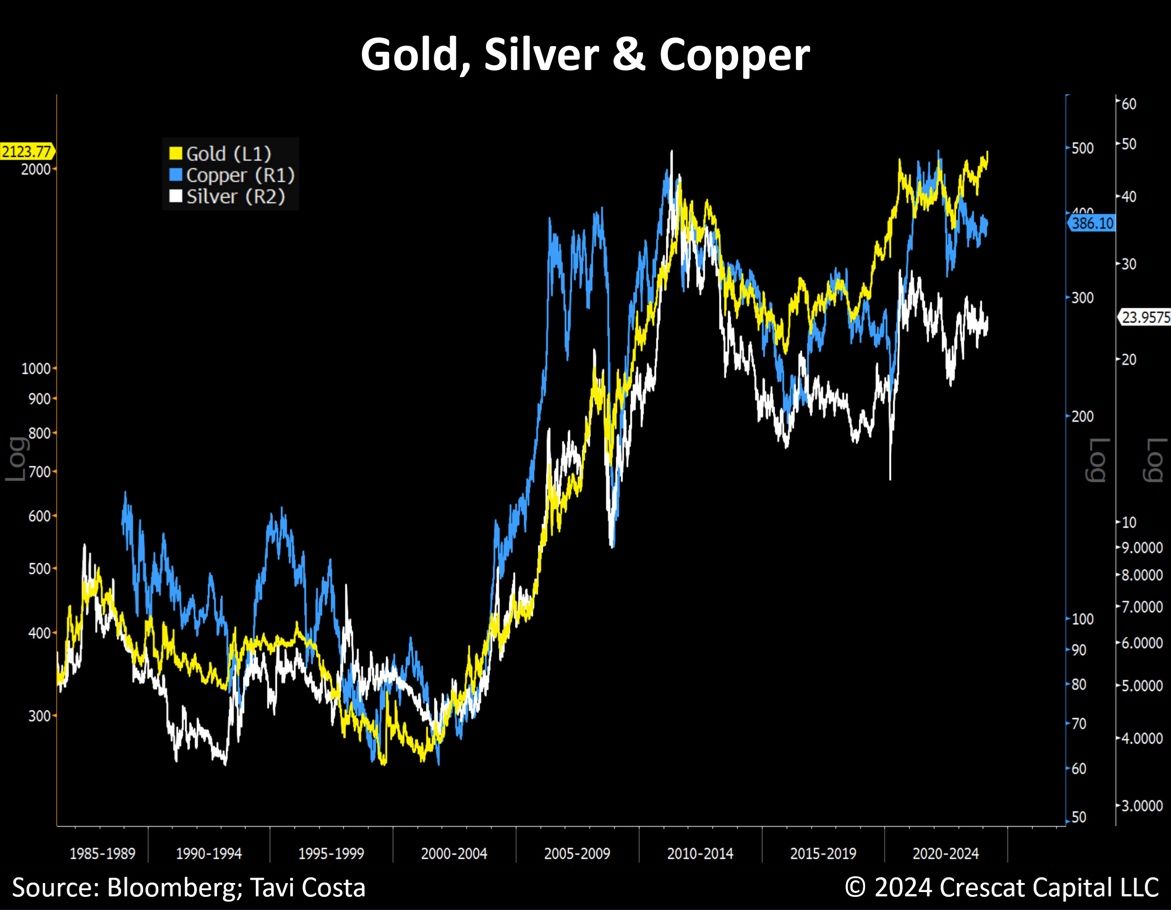
When gold enters a cycle, it lifts all boats among other metals.
Metal imports and exports in China are fairly robust, a sign that industrial demand is improving. Metal prices are reacting positively. Chinese are also buying a great amount of precious metals.
CRYPTOS : Renaissance
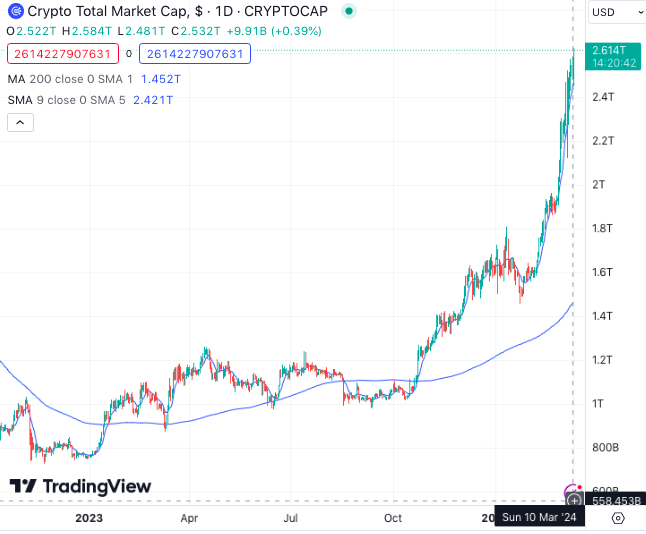
Bitcoin continues to soar this week, and even had the luxury of breaking through its all-time high. This performance was largely due to the constant influx of capital into Bitcoin Spot ETFs. BlackRock’s Bitcoin ETF now has over $12 billion in assets under management.
It took just 7 weeks for the iShares Bitcoin ETF to cross above $10 billion in assets, the fastest for an ETF ever. The prior record was held by the first Gold ETF which took over 2 years to hit that mark after launching in Nov 2004. I
If regulators feel obliged to allow crypto to be a part of the banking system as well as the securities markets, the chances are that Bitcoin’s renaissance can continue
Fed Causes Bubbles & Fed Pops Bubbles
Reminder : beware the next interest rates drop. As you can see on this chart, once a top has been set on the Fed funds, a recession was coming and the market declined after the Fed pivot.
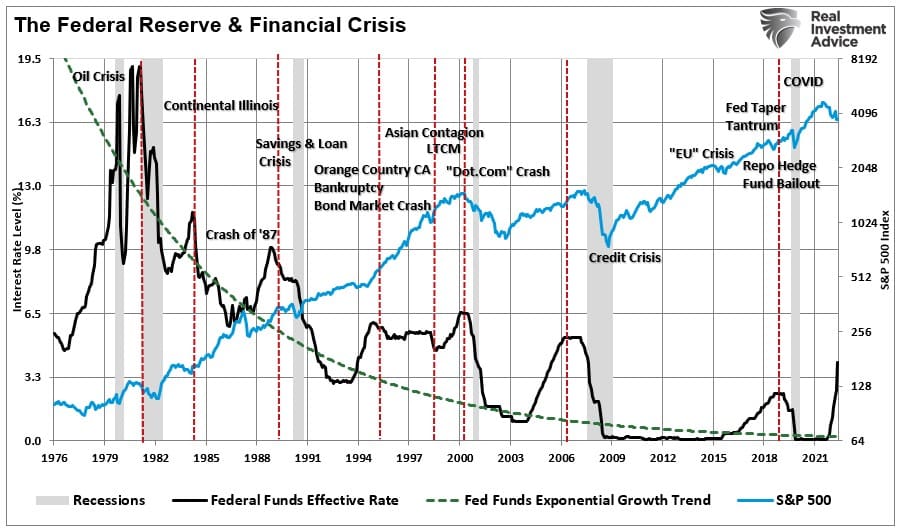
(courtesy of Lance Robert from RIA)
The Federal Reserve’s rate cut decisions are influential, with the stock market witnessing a “ferocious” 25% gain in just 25% months. This has happened just 10 times since 1930s, normally such surges occur from recession lows or start of bubbles.
So, what’s coming next?
The FOMC will meet next on March 21. First, they’ll revisit their current narrative or “outlook.” Next, they will get updated with the intermeeting economic data and other developments. They will discuss the intermeeting data and then they will have to update their Summary of Economic Projections assumptions, which includes the projected policy path.
Implications
The Fed’s narrative is dangerously backward looking, and thus, it’s useless in predicting the imminent turning points. Based on the recent data, it appears that inflation is accelerating. Thus, the FOMC will have to turn more hawkish.
The bond market is still predicting cuts, even as early as June. The stock market is in a speculative mania, triggered by the premature Fed’s dovish turn in December.
The Fed’s hawkish turn, which seems likely based on the recent data, could cause the bust in the more speculative assets, such as Bitcoin, the AI-themed bubbles stocks like Nvidia, and generally overpriced big tech, which could cause a major correction in the broad index such as the S&P500.
However, the major bear market will start with the next recession, which could be around the corner. Therefore a sell signal for the market.
Happy trades
BONUS
Make up your mind….


