

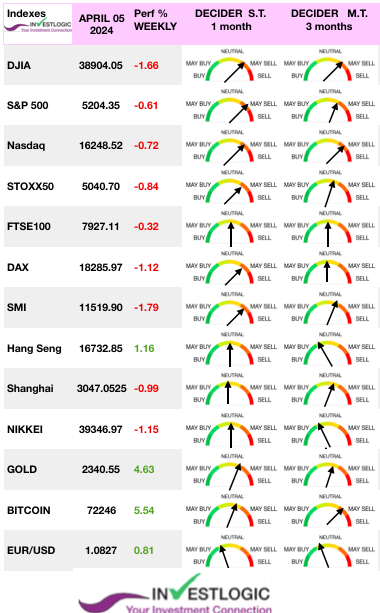
MARKETSCOPE : April’s Fool
April, 08 2024
“If every fool wore a crown, we should all be kings.” — Welsh Proverb
The financial markets ended the first quarter of the year on a high, with traders still betting on the scenario of a rate cut in the US as early as June.
April started between rising oil prices due to heightened tensions in the Middle East and uncertainty over the first rate cut, the world’s stock markets are having a hard time keeping their heads above water past week.
The S&P 500 recorded its worst week since the start of the year, and only its fourth overall negative week of 2024. The US large-cap indexes pulled back from record highs, and growth stocks faring better than value shares.
The decline was primarily driven by strong economic data which increased bets that the Federal Reserve would be in no hurry to cut interest rates. Stocks moved lower following February core PCE confirming that inflationary pressures are building.
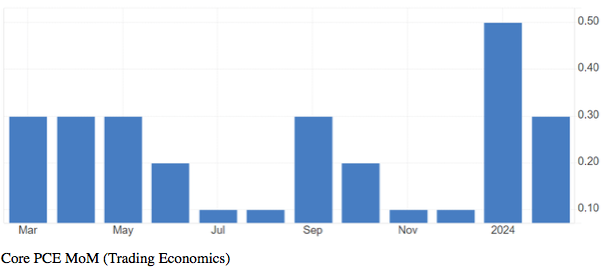
PCE inflation data confirmed that the inflationary pressures are building and that the January inflation spike is even more serious. Durable goods prices have been rising now for two months, and this trend is likely to continue. The service prices are also likely to stay elevated due to the strong labor market.
Also the release of the March ISM manufacturing at 50.3 percent in March, up 2.5 percentage points from the 47.8 percent recorded in February, well above expectations and indicated expansion—if barely—for the first time in 16 months. .
Friday’s nonfarm payrolls report blew past expectations, with the economy adding 303K jobs, the unemployment rate ticking down.
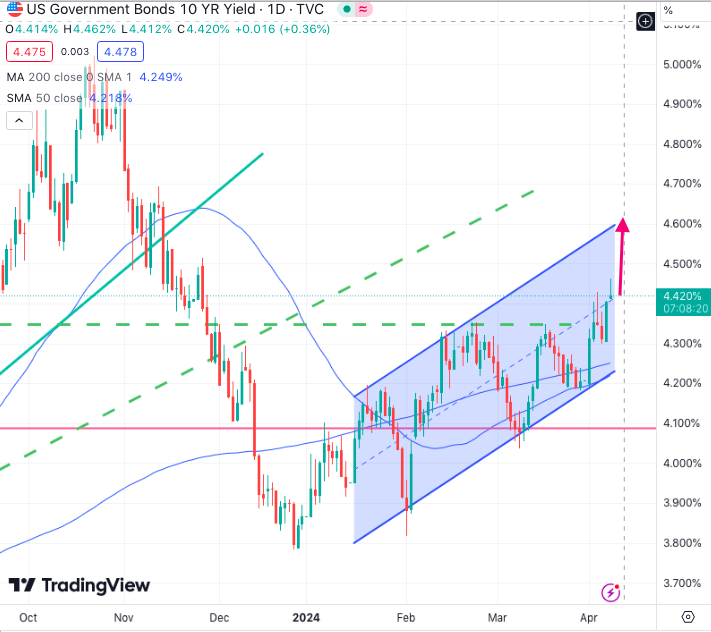
The 10Y yield hit 4.4% while the 2Y pushed up to 2024 YTD highs and closed at its highest yield since November.
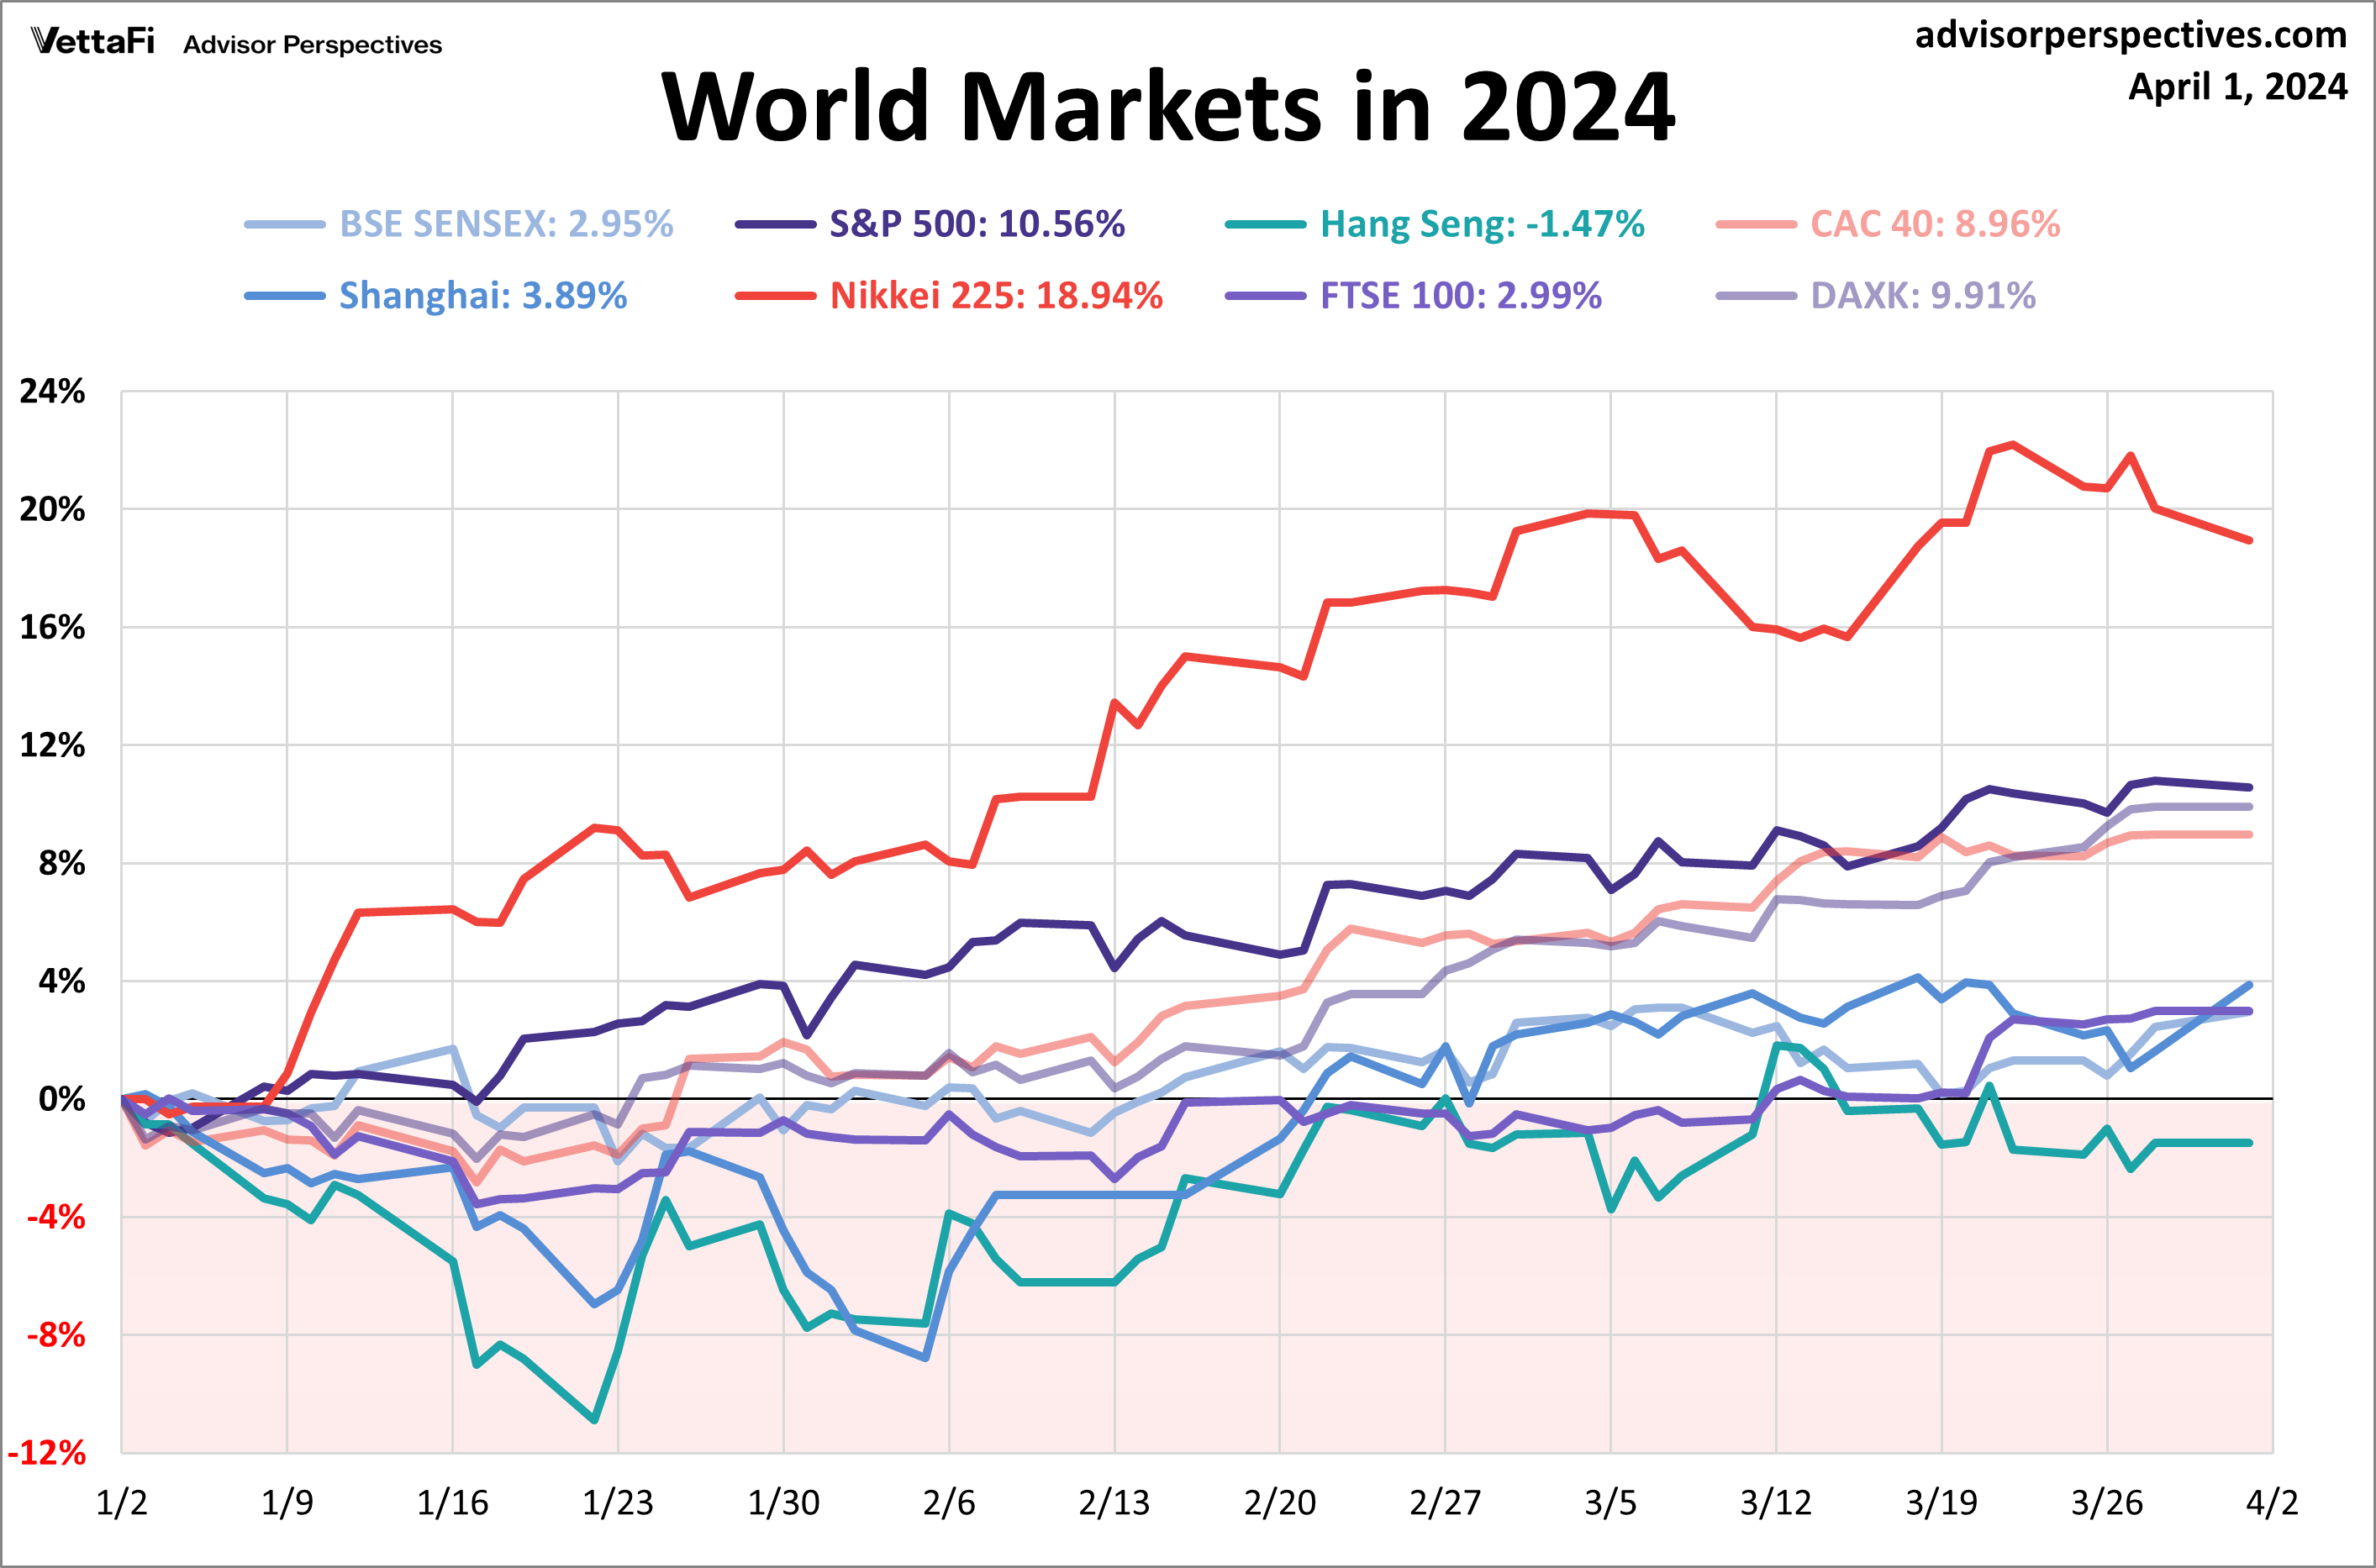
Most European stock markets also declined (-0.85 % for the STOXX Europe 50 Index). Japan’s stock markets fell as investors focused on the sharply depreciating yen, which hovered near JPY 152 against the U.S. Dollar.
Chinese stocks declined for the week as concerns about the continuing property sector downturn weighed on investor confidence.
Gold hit a new all-time-high, record high above $2330.
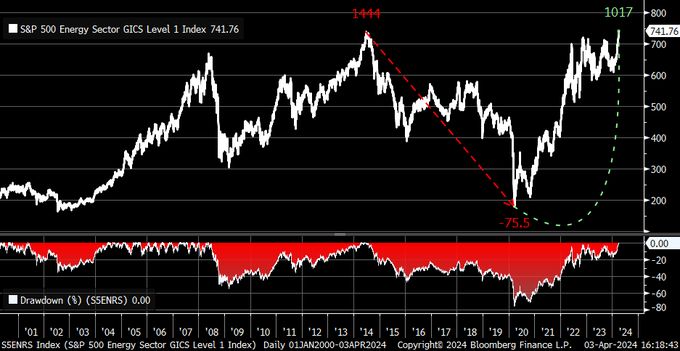
Oil gained nearly 3% over the week and is now up nearly 16% year-to date. The S&P 500 Energy sector finally took out its 2014 high april 5.
This week it’s earnings season again!
All eyes this week will be on Wednesday’s consumer price index report for March. Additionally, investors will be looking out for the minutes of the Federal Reserve’s March minutes, also scheduled for Wednesday, and the ECB’s rate decision (Thursday).
The start of the first quarter earnings season as well. Investors have already circled in red Friday April 12, with figures from JPMorgan, Wells Fargo, BlackRock and Citigroup. And it’s not just financial institutions that will be taking a beating: Delta Air Lines, Tesco, Constellation Brands, Givaudan and Publicis will also publish their results during the week.
MARKETS: Heads I Win, Tails I Win
For the first time during its six-month rally that began in October, the S&P 500 closed more than 2% below its previous closing high, set at the end of last week. This isn’t, or at least shouldn’t be, such a big deal.
The rule of thumb is that a market hasn’t undergone a correction until it’s dropped 10% from peak to trough. Pullbacks on this week’s scale happen all the time.
Another way to look at it, which seems popular, is to treat this as a scary development as the balance turns toward risk-off once again. Here are some first thoughts on how seriously to take this.
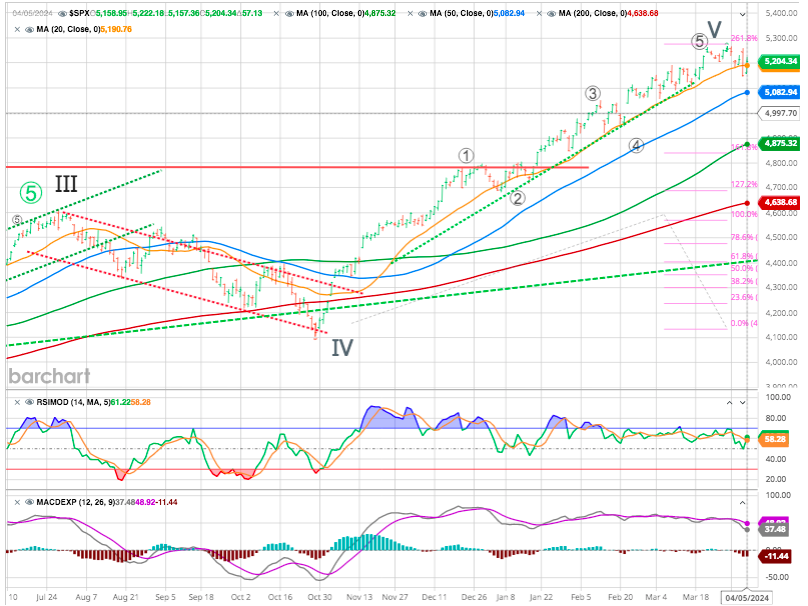
Previously we have suggested there was little to worry about until the market violates the 20-DMA. That “crack” to this “unstoppable” bullish rally happened Thursday.
However just because the market breaks the 20-DMA does not mean we must take immediate action. What we need to see is a confirmation of that break with either a failed retest of previous support or a further decline.
The 50-DMA will quickly become the next significant support level. While the market may remain range-bound between recent highs and the 50-DMA over the next month, we expect a deeper correction (~10%) before the election.
Such a correction would likely test the 200-DMA and reverse much of the recent bullish market exuberance, as shown by both retail and professional investors.
How seriously you should take the market pullback ?
Initial reactions blamed hawkish comments from Neel Kashkari, president of Federal Reserve Bank of Minneapolis, who said that it may not make sense to cut rates at all this year.
On Friday, the stronger-than-expected employment report sent stocks higher as “good news is good news” as more robust economic growth should support earnings. However, “bad news also remains good news,” as it would mean Fed rate cuts.
In other words, we continue to be in a “heads I win, tails I win” market. Thus, the next trigger for a significant correction in S&P500 will be the CPI report for March next Wednesday. If it confirms that the inflationary pressures are building and rejects the inflation bump thesis, the correction could be significant. Until then, for us the S&P500 is still a Hold.
‘Worst Months’ of the year period
On the other hand The Stock Traders Almanac, closely watched investor newsletter, has officially issued its “Best Six Months MACD Seasonal Sell” signal for both the Dow Jones Industrial Average (DJIA) and the S&P 500, indicating the start of what is traditionally seen as the “Worst Six Months” for these indexes.
The Almanac Investor said a sell signal does not mean an outright exit from the market but rather a strategic reallocation of assets. The strategy will involve either direct sales of certain assets, or the implementation of strict stop-loss orders.
However, the strategy advises continuing to hold positions in the Invesco QQQ and iShares Russell 2000, as the NASDAQ’s “Best Eight Months” period does not conclude until June.
The Almanac Investor said a sell signal does not mean an outright exit from the market but rather a strategic reallocation of assets.
They suggest to take new positions in traditionally more stable market segments, which may include (ETFs) for bonds, gold and gold mining stocks, direct short positions and other sector ETFs that have historically performed well over the ‘worst six months’,” the company explained.
Insiders are selling
Last but not least as markets hit record highs, the ratio of corporate insider selling to insider buying is at the highest level since the first quarter of 2021, reported the FT.
Peter Thiel, Jeff Bezos and Mark Zuckerberg are leading a parade of corporate insiders who have sold hundreds of millions of dollars of their companies’ shares this quarter, in a signal that recent stock market exuberance could be peaking.
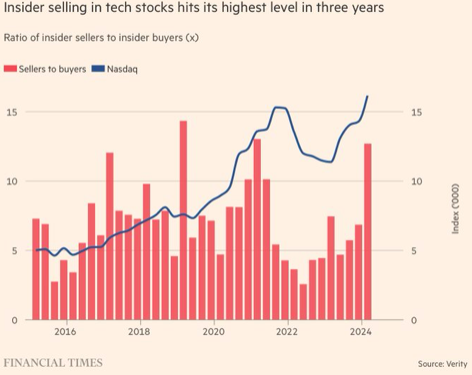
Insider sales by high-level execs of large amounts of stock are never a good sign, it’s quite simple,it means they have found a better place to deploy their assets than the businesses they’re running.
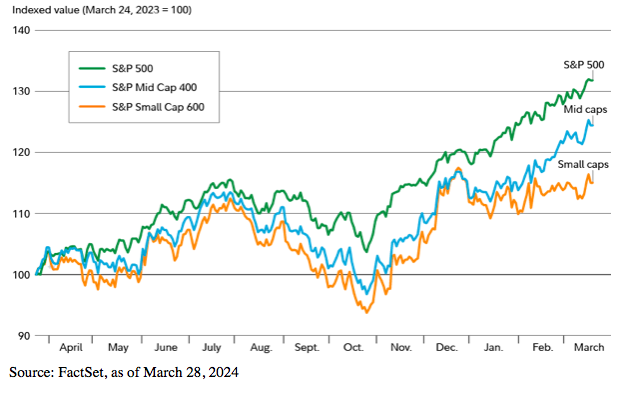
Large caps crushing small caps again
With the increase in valuations for Large-Cap stocks and the hype surrounding AI stocks, an opportunity may have developed within the small-cap segment of the market. Plagued with lower quality balance sheets and higher interest burdens, small-caps are seen as riskier and less attractive.
However, the valuations spread between smaller companies relative to large-cap companies has widened to extreme levels. Should interest rates decline as expected, within the small-cap universe, higher quality smaller companies could present an attractive asset class for the active investors.
In fact, more fund managers said it could be small caps’ year to outperform than those that said large caps would lead in a Bank of America fund manager survey earlier this year. That outperformance hasn’t happened yet in 2024, as the biggest companies (as represented in the chart below by the S&P 500) have continued to beat both small caps (represented by the S&P Small Cap 600) and mid caps (represented by the S&P Mid Cap 400).
Source Fidelity Active Investor
FED : Powell vs Yellen
It’s the liquidity, stupid!
Yellen’s stealth QE overpowering Powell’s QT. This probably helps risk assets performing well despite high interest rates and QT (Chart via SRP thru HolgerZ)
But there are mitigating factors, driven by the very market optimism that has created an easing of financial conditions by the Fed’s own measure to a level not seen since January 2022, when rates were effectively at zero and there was still a passionate debate over whether inflation was transitory:
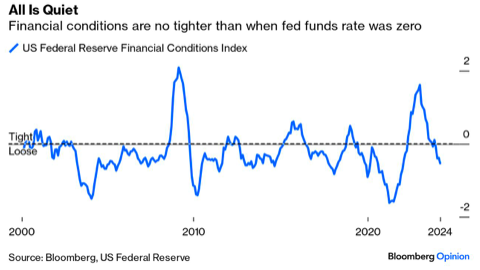
Somehow, the Fed’s most aggressive hiking cycle in decades has left us where we started — which doesn’t make much sense.
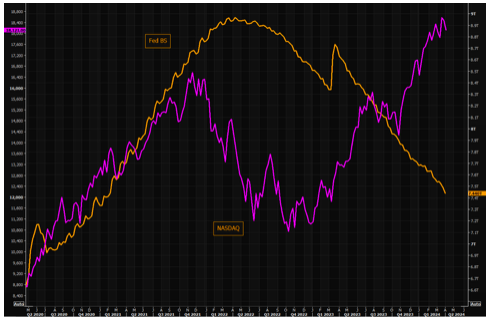
The Fed’s balance sheet is now at its lowest level since February 2021, down $1.5 trillion from its peak in April 2022. How much more QT is needed to unwind the massive QE from March 2020 – April 2022? $3.3 trillion. Chart shows the Balance Sheet vs NASDAQ, a relationship that apparently is dead…
Is this sustainable? Not for long, unless the Fed does indeed cut rates.
Historically, when real rates are high for long enough, growth eventually slows. At this point, they want to avoid a more significant slowing in the economy, especially given that the labor market imbalances aren’t as pronounced. In other words, we have the unemployment rate and job openings becoming more in alignment with what the Fed believes is a non-inflationary situation.
New rate cuts are still the most likely scenario. When they come and how many we get will be based on how the economy performs.
As Federal Reserve Governor Christopher Waller said “There is no rush to cut interest rates and recent economic data warrants delaying or reducing the number of reductions seen this year.” He added that he’d want to see “at least a couple months of better inflation data” before cutting, while also noting the strong economy and robust hiring as further reasons to wait.
There is no rush to cut interest rates and recent economic data warrants delaying or reducing the number of reductions seen this year, Federal Reserve Governor Christopher Waller said. He added that he’d want to see “at least a couple months of better inflation data” before cutting, while also noting the strong economy and robust hiring as further reasons to wait.
Notwithstanding the dovish tone Powell struck, Fed officials signaling higher-for-longer interest rates are backstopping dollar strength. The knock-on effect has pressured currencies around the world,
Happy trades
BONUS
Coming full circle now to our April Fool’s title of today’s Marketscope, here is probably the best April Fool’s prank ever:
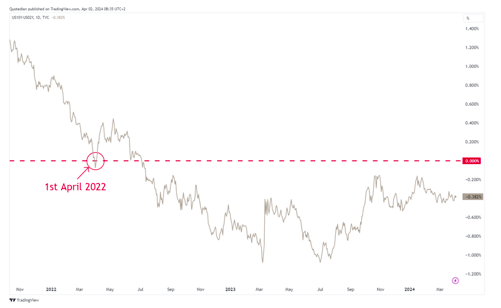
The US yield curve (10s-2s) inverted on April 1st 2022. Two years later no recession, no stock market crash (rather huge gains) and still no recession in sight.
Golden or Death Cross?
The solar eclipse sets for April 8, 2024, will be visible across much of North America.
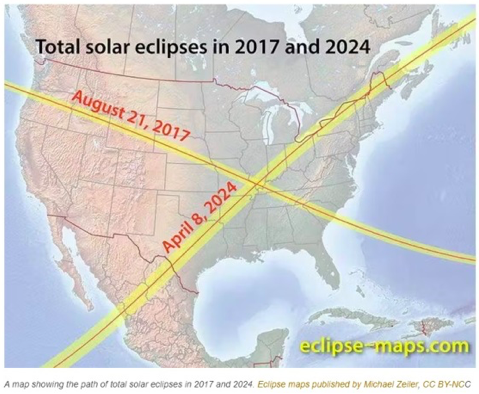
One image driving these predictions shows southern Illinois as the point where the paths of the upcoming eclipse and the 2017 North American solar eclipse intersect. Their intersecting paths form a cross. This notion sounds a bit like financial market technical analysis, doesn’t it?
The human quest to predict the future by observing the stars is an age-old practice. This includes stock market astrologers who use celestial patterns to forecast market trends.