MARKETSCOPE : What is Obvious is Obviously Wrong !
June, 26 2023Central banks are like trains: one can always hide another, if not several.
On the Wrong Track
The economy continues to weaken without any significant fall in core inflation rates. The markets are still ignoring the risk of recession, which could leave them facing a correction over the summer.
Stocks fell on last week to wrap up their worst week since the collapse of the Silicon Valley Bank in March, indicating the market’s three-month rally may have come to an end. Investors were spooked by aggressive central bank tightening overseas.
No one cared about inflation last month, but now it’s (back) upsetting the markets. Central banks continued to raise rates. As first the Swiss National Bank (SNB) announced a 25 basis point “as expected” hike. Shortly after Norway’s Norge Bank announced a surprise hike of 50bp (versus 25bp) expected. And then at lunchtime, the Bank of England surprised markets with a 0.50% hike versus 0.25% !
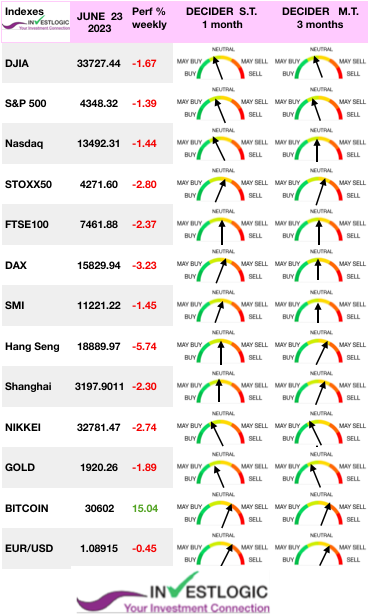 Combined with the Fed’s comments that more rate hikes are likely coming, continued weak economic data and persistent inflationary pressures weighed on the markets this week.
All this undermines investors’ assumption that all will be well if punitive monetary policy doesn’t last too long, or at least not long enough to cause lasting damage to economic growth.
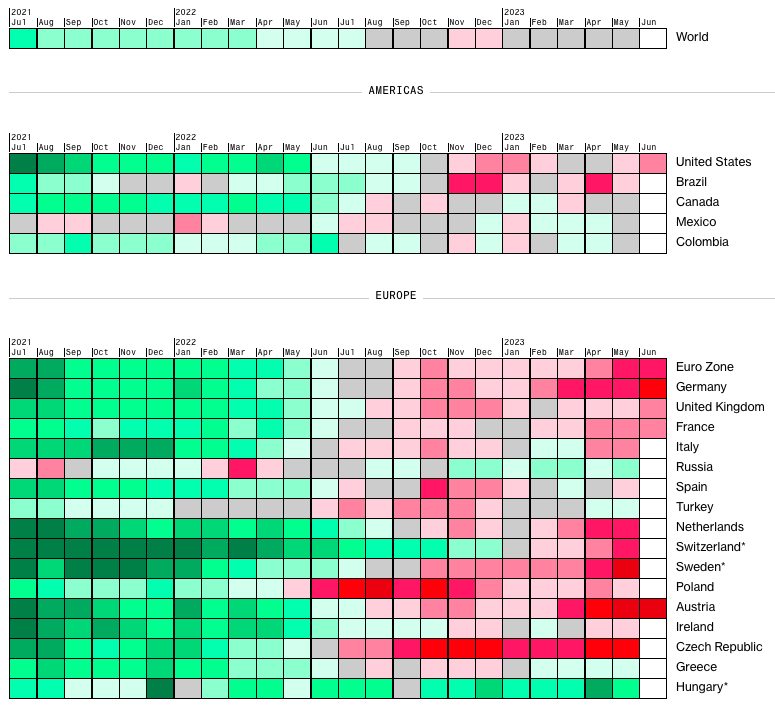
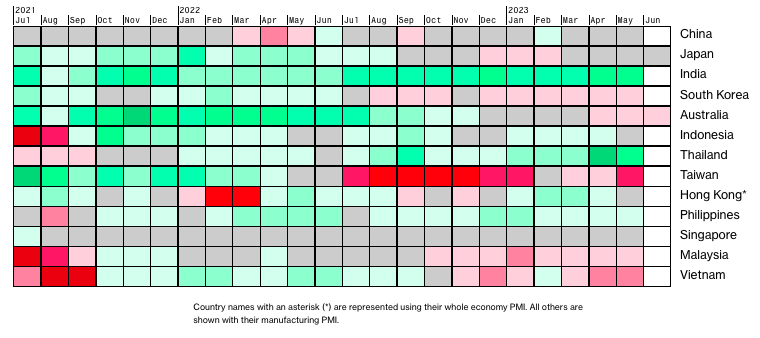
There are signs that central bank action is finally cooling the economy, as business activity in Europe slowed sharply in June, while business activity also slowed in the U.S. but less dramatically than in other parts of the world. The problem is that high rates are starting to bite. European PMI indicators for June were all below expectations, with a marked contraction in industry. So the old spectres of recession or, worse still, stagflation are being trotted out.
The common denominator: the fight against inflation. In the UK, CPI Core inflation rose to 7.1% y-o-y, compared with an estimated 6.8%, while in Turkey, price rises approached 40%. At the other end of the spectrum, inflation in Switzerland, although limited to 1.9%, is still at a 20-year high.
As the phenomenon is global, the reaction is naturally just as global (with the notable exceptions of China and Japan, which are swimming against the tide), and monetary tightening is proceeding apace. The odds of a Fed rate hike in July exceed 75%. In fact, the US 2-year yield remains well above 4.23%, with record highs in prospect.
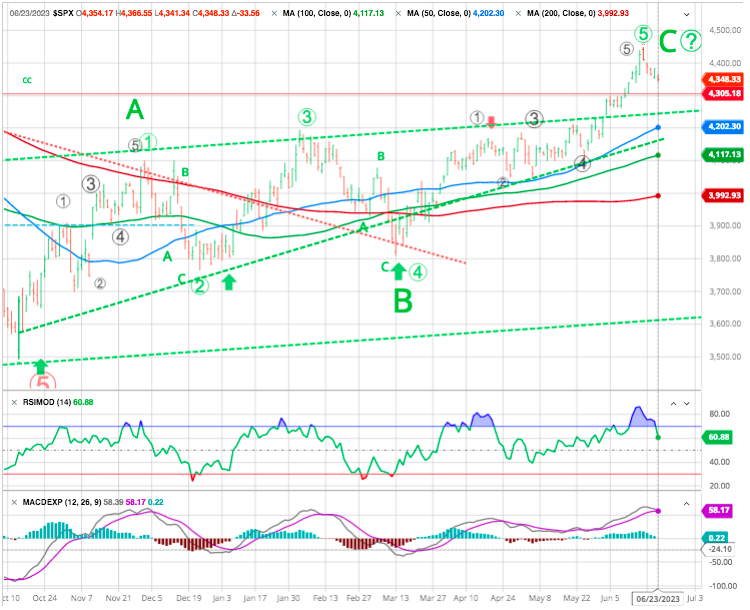
Some of the pullback for the week was also technical in nature, with the S&P 500 hitting resistance levels. All three major market averages broke multi-week winning streaks.
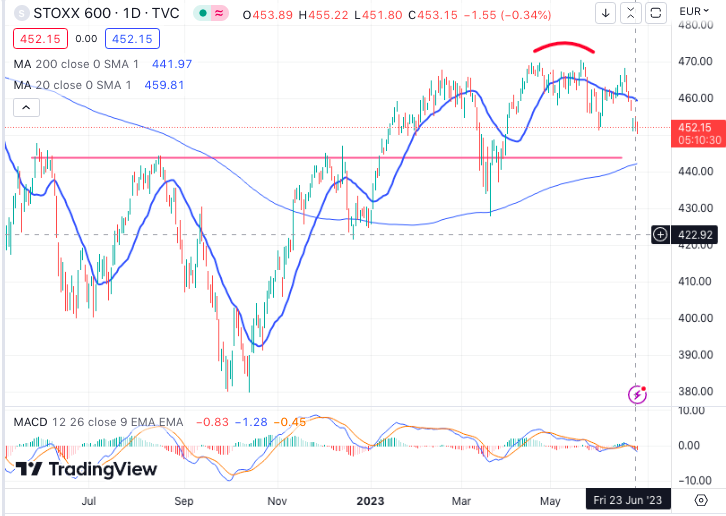
European and Japanese equity markets lost an average of 2.5% over the week. In Europe, the STOXX Europe 600 Index fell 2.93% on worries that further interest rate increases might cause a recession in Britain and the eurozone.
China fell by 5% for lack of any signs of recovery.
MARKETS :
This week’s correction has pushed our buy signals close to confirmed sell signals. Notably, should these sell signals trigger, such will occur from fairly elevated levels suggesting a more protracted correction or consolidation ahead.
Weekly technical view: Some short-term overbought signals have emerged, and profit-taking occured. If so, technology stocks would be the obvious candidates (given the weakness across the rest of the market).
With bullish sentiment pushing into “extreme greed” territory, this past week’s correction did little to resolve the bullish, overbought, and deviated conditions. With the end of the quarter approaching, we could see additional selling pressure this coming week as managers rebalance portfolios for second-quarter reporting.
A pullback may also be considered a healthy move, and on this basis, a retest of the old resistance at 4,200 might be considered a more-attractive level at which to to play this market leg.
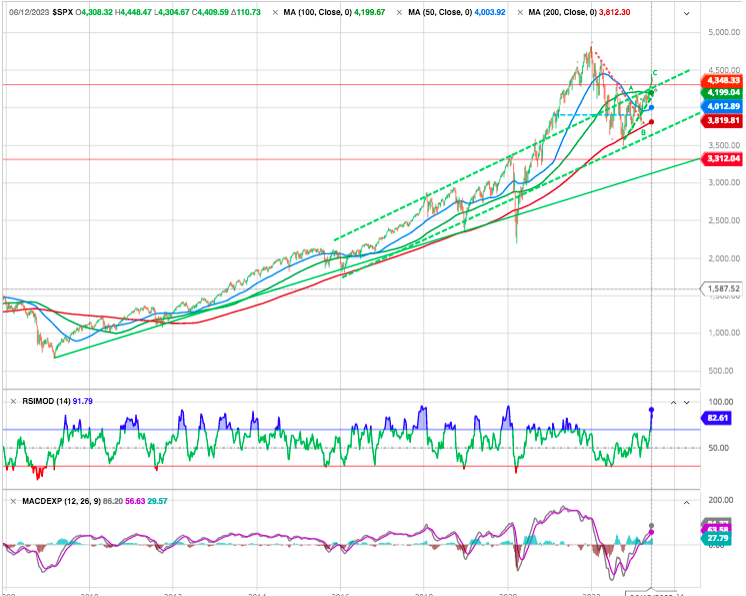
There are two critical points to note. Firstly, “bear markets” occur when the stock market violates the 200-WMA (Red), which tends to act as a bullish trend. Secondly, bear markets were previously confirmed by the 50-WMA (Blue) crossing below the 200-WMA(Red).
Notably, bullish markets were confirmed by stocks trading above the 50-WMA (Blue) and the 50-WMA above the 200-WMA (Red). While there are many reasons to be concerned about the current economic environment, the market has remained in a “technical bull market” since 2009. With the market now trading above the 50-WMA and those moving averages trending higher, the bullish market dynamics suggest that the bear market risk is lover for now.
Bullish Markets And The End Of Bears
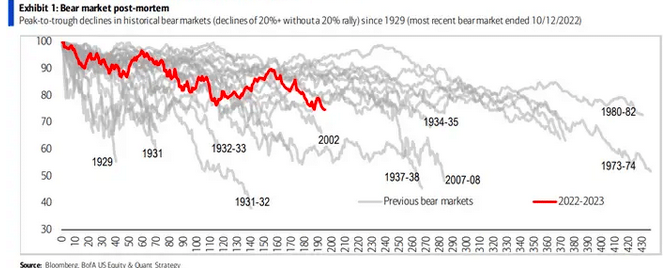
While it may seem that a bear market won’t end in the short term, they do. Below is a table and chart of bear markets back to 1900.
Throughout 2022 there were many comparisons to the 2000-02 and 2007-09 bear markets, with the implication being that there was still more downside ahead.
While that was certainly one possibility, it wasn’t the only possibility, and what we’ve seen over the last eight months is a path very much unlike those other two bears.
The 27% rally from the October lows has brought the S&P 500 to within 10% of its prior high, and is now being called a “new bull market.”
EURO STOXX 600
After a negative divergence on the RSI (reflecting the fatigue that followed the strong rebound of recent months), the European benchmark suffered a sharp fall. Past resistances at 420 and 430 have become supports.
Swiss Market Index
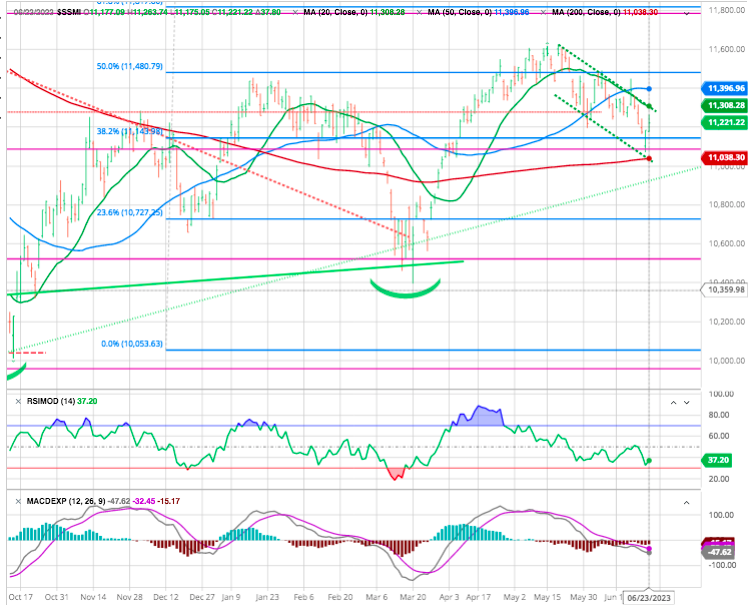
After several unsuccessful attempts, the index finally closed above 11,500 in May. However, the positive momentum failed to take hold and a consolidation phase materialised. In the short term, the price may have formed a local low above its 200-day moving average, (Red) which currently stands at 11,036. A daily close above the 20-day SMA (Green) at 11296 would be an initial bullish signal indicating that the consolidation phase is over, and that a new bullish sequence has begun.
NIKKEI
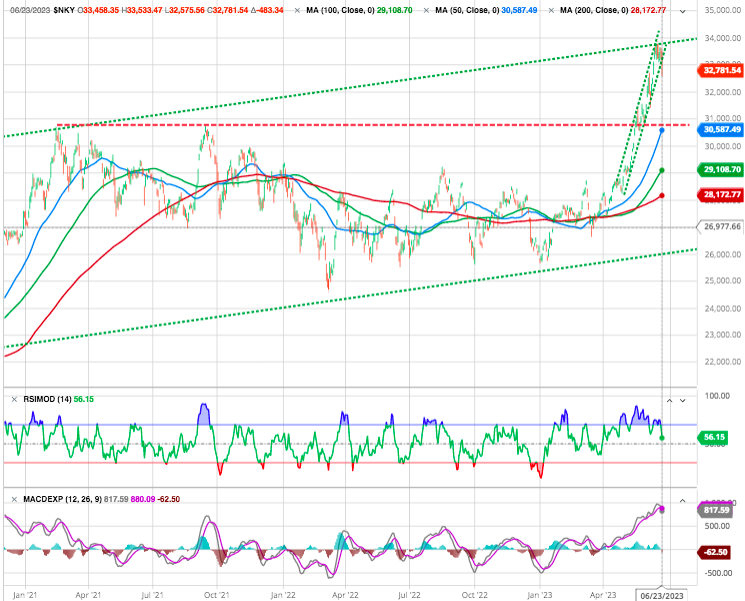
Short-term, the RSI is forming a bearish divergence, suggesting that a pullback towards 30’570 may occur. This would offer a better entry level, in our view.
CRYPTO
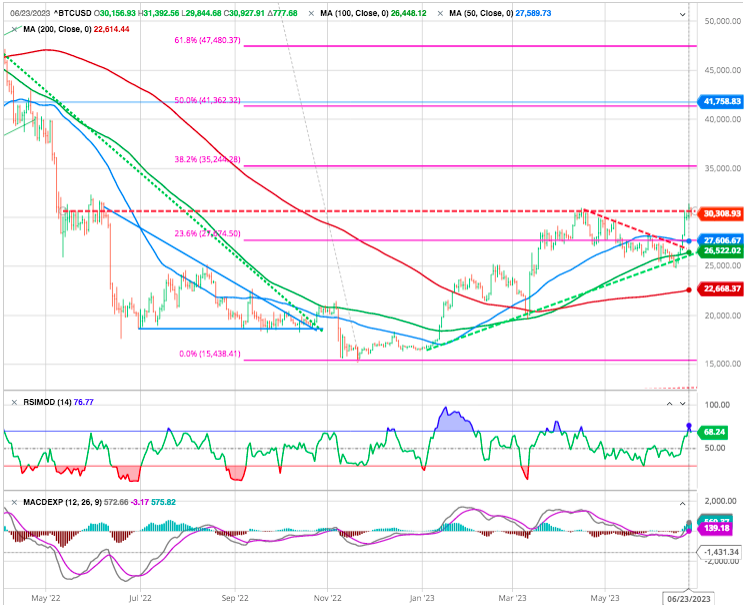
Bitcoin is up over 14%, back above the $30,000 mark, close to its annual highs. The crypto is now facing a major resistance level. Meanwhile, ether is also regaining ground, but to a lesser extent, climbing 9% since Monday to close in on the $1,900 mark.
The institutional infatuation with bitcoin in recent days, spearheaded by asset management giant BlackRock, could well give crypto-assets another boost if ETF applications are accepted by the US regulator.
Fundamentals Will Matter
Fundamentals often lag markets and market sentiment. Analyzing fundamentals and market sentiment are tools, and just like any tool, you need to know when they are most useful.
Today, things are nearly as rosy as they appear right now. If you look a little closer underneath the market hood, there are numerous disconcerting developments which are cause for increasing concern in the markets and economy. In other words, bearish indicators.
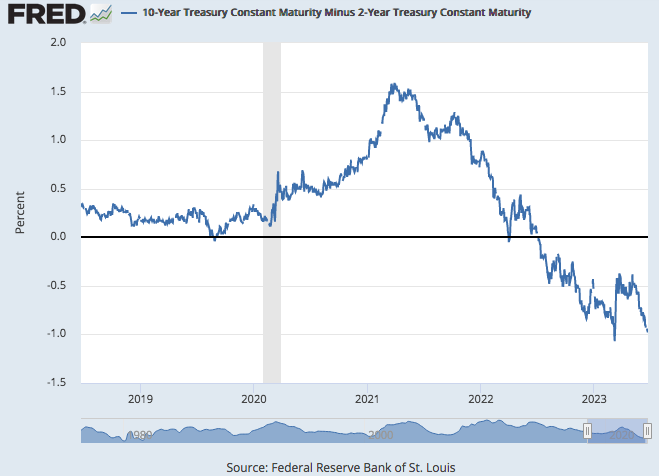
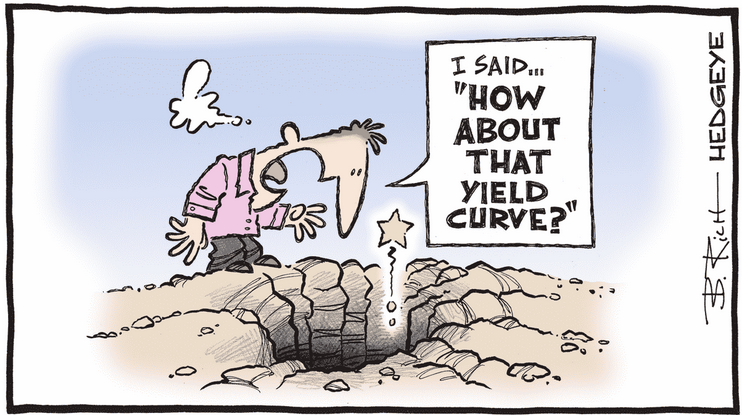
Let’s take a look at the yield curve. The 2s/10s yield spread drops < -100bps.
One of bond market’s most reliable gauges of impending US recessions is back in solidly triple-digit negative territory as investors absorbed disappointing US manufacturing-sector data & a spate of European central bank interest-rate hikes.
To be clear, yield curves around the world are inverting the most in decades. That’s not exactly a harbinger of bullish things to come and they have always announce a recesssion within the next 18 months.
Meanwhile… Global PMIs have officially crashed to new Cycle Lows.
An inverted 2s/10s curve has preceded every recession in the past 40 years, as relatively high short-term borrowing costs choke growth, tighten financial conditions.
The yield curve, a historically reliable indicator, has been signaling a recession ahead for nearly a year—but there’s no telling how far away it might be, if it comes at all.
Is there evidences it may do so again this time ?
Yes, fundamentals win out in the long term whereas technicals win out in the short term. This perspective is based upon the fact that there are times when a stock is not trading based upon its fundamentals, for when it is well beyond its mean or valuation it is viewed as being driven by “the madness of crowds” and not by reasonable investment principles.
The recession is now likely imminent in Q3 2023, or possibly already is underway.
The recession indicators
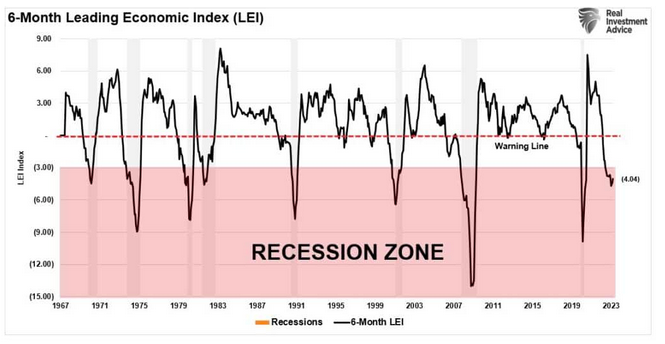
The 6-month rate of change (ROC) in the Conference Boards Leading Economic Index (LEI) further supports that recession warning from the ISM composite index. Since 1967, a recession has occurred when the 6-month ROC fell below -3%. This indicator has the most infallible record of all the recession indicators we track.”
The recession has been delayed mostly due to a very resilient labor market. The unemployment rate has actually been decreasing, reaching the historically low level of 3.4% in April, which supported the growth in U.S/ consumption. However, the leading indicators of the labor market strength have been pointing to weaker conditions associated with a recession.
Initial claims for unemployment spiked above the key 250K level, and remained elevated, which suggests a further weakening in the labor market.
More importantly, the retail sales are approaching the 0% growth level over the last year, which suggests that the growth is likely to drop to below 0% soon, pointing to a weakness in consumer spending associated with a recession.
Goldman said it perfectly : Investors should consider hedging the rally in the S&P 500 for recession-related risks…Bullish option positions look crowded, the rally has been narrow, valuations remain high, overly optimistic growth expectations are being priced in and overall investor posture isn’t light anymore.
It seems like growth is stalling, while the core inflation still remains sticky at a very high level. For the Federal Reserve, their primary concern remains a resurgence of inflation, as was seen in the 1970s. Repeated bouts of inflationary pressures spurred repeated market events and recessions.
If the Fed eases monetary conditions too soon, they run the risk of another inflation surge in the economy. Thus, the Fed could be forced to hike while the economy is entering a recession. This supports the hard-landing scenario, and if that prospect become more likely, the S&P 500 could decline to 3,400.
Happy trades
BONUS
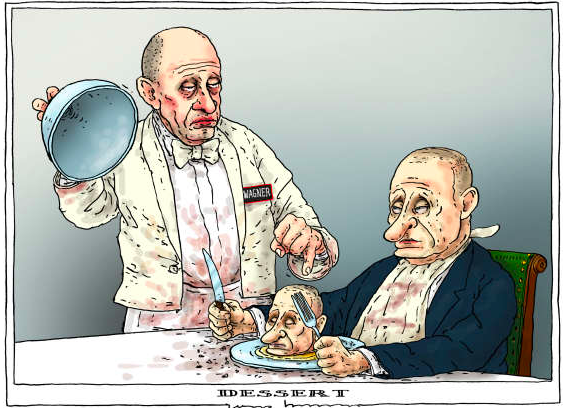
Yevgeny Prigozhin : hot dog vendor turned warlord


