

MARKETSCOPE: Think Positive, Stay Negative
January, 10 2022
We are back after a short break.
After another challenging 2021, and on the start of this New Year we would like to take this opportunity to thank our faithful readers, subscribers, customers for following, reading and sharing our thoughts on the markets and the economy. We appreciate your confidence and trust and most importantly we wish you all the best for 2022.

Reassured by the reportedly milder Omicron variant, financial markets set new all-time highs at the beginning of the year, before suffering profit taking. In particular, the Federal Reserve’s comments rattled markets, as it considered reducing its balance sheet and raising rates earlier than expected, due to a tight labor market and persistent inflationary pressures. With the earnings season approaching, volatility is likely to remain high.
For the year, the S&P 500 Index was up about 27% to outpace the Dow and the Nasdaq by a wide margin. The S&P 500 Index set 70 all-time highs during the year, which is the most in a single year since the 77 that was carved out in 1954. Over the past week, in the US, however, the picture is different. The Dow Jones lost 0.2% over the last five days, the S&P500 1.7% while the Nasdaq100 fell by 4.2%.
Nas… duck!
The Nasdaq composite meanwhile has cleanly broken down through its 50dma and 100 dam. It is currently toying with the 14980 level (again) , also on the l.t. uptrend line and minor support . This is *not* a sign of strength, and certainly warrants closer attention to risk management.

According to SentimenTrader, nearly 40% of the Nasdaq index have lost 50% of their value from respective 52-week highs. To wit:
“Valuations are at historical highs, companies are raising billions based on fairy dust, and the Fed is signaling a tightening cycle. All of these are scaring investors that we’re on the cusp of a repeat of 1999-2000.”
After Wednesday’s post-FOMC selloff, more than 38% of stocks trading on the Nasdaq are now down 50% from their 52-week highs. Only 13% of days since 1999 have seen more stocks cut in half.
In Asia, indexes finally ended in a scattered order. The Shanghai Composite lost 1.65%, the Nikkei 1.1% while the Hang Seng gained 0.4%.
In Europe, although erasing part of the gains accumulated over the first few days, the red dominates. The STOXX 50 declined -0.3%, the Dax by 0.4%, Swiss SMI by – 1.2 %.
World markets as of 27/12/2021

Gold , on the other hand, has declined over the past five days. Despite rising risk aversion, the precious metal is failing to gain favor with investors. As a result, gold has once again fallen below the USD 1,800 mark. The refrain is similar for silver, which is losing ground at USD 22.1
Oil prices are starting the year on the right foot. Supported by production disruptions in North America, due to difficult weather conditions, but also in Kazakhstan, where a state of emergency has been declared throughout the country, prices have risen five consecutive sessions. The US benchmark, WTI, momentarily broke the USD 80 mark while Brent is trading around USD 82.
Cryptocurencies’ market is looking grim in recent days. The $69,000 peak in the price of bitcoin in early November seems a long way off after dropping almost 40% in just two months.
Bitcoin is now hovering around $41,000 at the time of writing. The total market capitalization of the cryptocurrency market has followed suit, shedding more than $1 trillion over the same period, dropping from $3 trillion to less than $2 trillion. The next few weeks are shaping up to be eventful for digital assets. Have we entered a bear market cycle? Only time will tell.

Then again, everything about money feels a little strange at the moment. Between NFTs, crypto, and GameStop, AMC, and other meme stocks, money has rarely felt more fake. Or, at the very least, value has rarely felt so disconnected from reality.
Fed Minutes Spook Markets Into Selloff
Of course the main event last week was the publication of the FOMC minutes -confirming what was communicated after the meeting- shaking the investor confidence.
2022 has received one last kick from 2021, and traders in the stock market don’t seem to like it. The Federal Open Market Committee last met to consider monetary policy on Dec. 15.
Everyone knows what they decided. But the minutes of that meeting, with much more information on how the decision was made, didn’t come out until 2 p.m. Wednesday in New York. The effect on both bond yields and share prices was immediate, with the former surging while stocks sold off.
This commits the central bank to nothing, but the notion that there were hawks on the committee who thought that the Fed should reduce the size of its balance sheet (in other words, start to sell off its huge bond holdings in a move that, all else being equal, should raise yields) came as an unpleasant surprise. Those words are there for a reason. The Fed thought it a good idea to plant a reminder of hawkish intent just as markets were ramping up again after the New Year break, and it seems to have worked.
Never the less a stronger economy, and particularly a stronger labor market, is great news on many levels, but it removes any lingering justification for the central bank to be accommodative.
At last the combination of rising inflationary pressures and a still-firm economic environment will push central banks over the world to tighten monetary policy. This tightening cycle should be very moderate and not derail the economy. Prior to the recessions of 1990, 2001 and 2008, the real Fed Funds rate had been rising for several years, in the range of 3%, before the economies were adversely affected.
Powell’s put
There are some reasons to remains optimist, however. First, The Fed has been “talking tough” on inflation for several months, but it hasn’t made any significant changes to monetary policy to date.
Second, even if the Fed does begin to back up its words with action soon, it isn’t necessarily a reason to panic.
The longer-term chart below shows why.
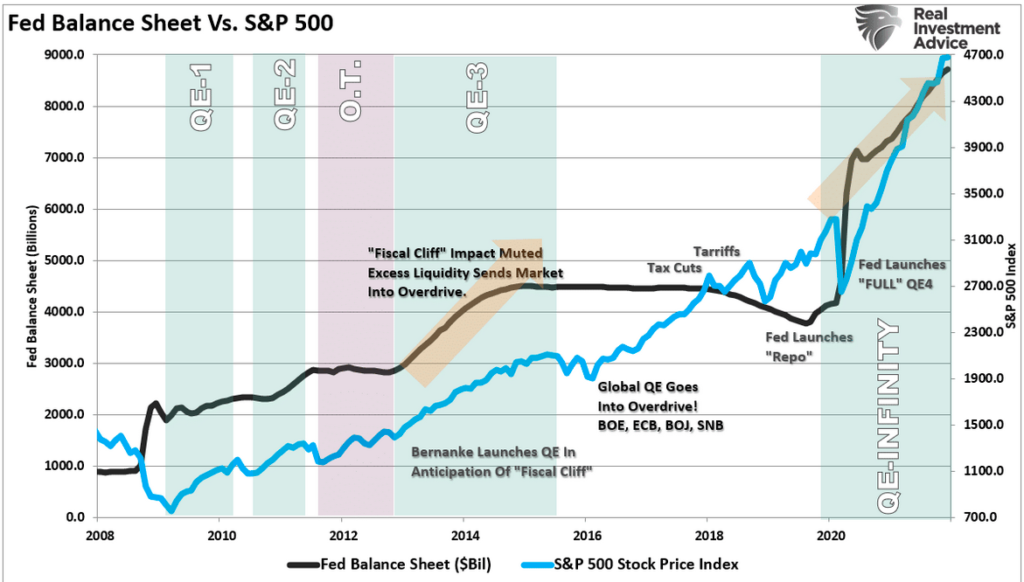
As you can see, the Fed last started tapering its bond-buying program in 2014 and then held its balance sheet relatively steady for the next few years. But it wasn’t until after the Fed started reducing the size of its balance sheet in late 2017 — following several years of interest rate hikes — that the bull market in stocks began to falter.
We’re likely still many months away from that scenario.
Last but not least, it’s important to remember how the Fed reacted when that happened.
 In short, following the roughly 15% correction in stocks that occurred in fall 2018, the Fed quickly reversed course. It immediately took further rate hikes off the table and announced it would stop reducing its balance sheet earlier than planned.
In other words, when push came to shove, the Fed stepped in to support the stock market.
That has been their response to virtually every significant correction since the 2008-2009 financial crisis, up to and including the COVID-19-related crash in early 2020. And I don’t expect that to change going forward.
If forced to choose between fighting inflation and propping up the market, history suggests they’ll choose the latter.
We do think the markets will continue to believe in Powell put.
The critical component of the “bullish thesis” has been the psychology of the “Fed put.” Regardless of valuation levels, deteriorating fundamentals, or simple logic, the excuse for continuing to take on increasing levels of risk was “Don’t fight the Fed.”
The question is at what level the Fed will abdicate ? 15 % correction or 30% ? This time the later is more probable to shake up the investors mind .
MICROSPCOPE
URANIUM
“The Commission considers there is a role for natural gas and nuclear as a means to facilitate the transition towards a predominantly renewable-based future,”
the EU executive arm said in a statement at the end of the year.
On the first day of the year, when uranium companies surged higher, extending on one of the best trades in the past year (the Uranium URA ETF is double since we first recommended the space in early Dec 2020), after the European Union said it is planning to allow some nuclear energy projects to be classified as sustainable investments, a proposal that sparked immediate criticism from the Greens who would rather freeze to death and spend all their money to keep warm during the winter than allow a few nuclear power plants to restart.
Meanwhile, the inclusion of some nuclear energy projects would help attract private finance in nations from France to the Czech Republic, which plan to rely on atomic power in their transition to net-zero emissions.
The Commission is also planning to ensure a high degree of transparency to investors concerning gas and nuclear energy, introducing specific disclosure requirements for non-financial and financial undertakings.

Uranium Energy up 7.5%
Uranium Royalty up 8.2%
Energy Fuels up 7.9%
Denison Mines up 7.3%
NexGen Energy up 5.9%
Cameco up 4.0%
Global X Uranium ETF (URA) gains 5.00%
As January goes, so goes the full year
The January Barometer is a market-forecasting indicator developed by Yale Hirsch, creator of the “Stock Trader’s Almanac,” in 1972.
Why might up Januaries be better predictors than down ones? One reason may be the historical proclivity of stocks to rise. US stocks have finished higher in all but 17 out of 75 years since 1945. So, the fact that stocks finish higher for the year so often after both a positive and negative January may simply be the result of this directional bias.
Indeed, there is a strong correlation between positive January S&P 500 performance and positive market performance for the entire year. During only 2 years since 1945 have stocks dropped sharply (a price decline of more than 10% for the full calendar year) after a positive January, with both instances occurring at the end of powerful multiyear market advances (1966 and 2001).
Moreover, a down January may not be a reliable predictor of a weak year overall. Going back to 1950, in 13 out of 27 years when January finished in the red, the stock market actually ended higher, and often by a very substantial amount. That was the case in 2021. So we shall look carefully at the end of the month and make up our mind !
First 5 days
In addition to the January barometer, some market watchers place particular emphasis on the first 5 trading days of January as an indicator of where the market is headed for the full year. The first 5 trading days of this year saw US stocks lost 1.7%, pointing toward a potentially negative year for the market, according to this indicator. But you need only look to a couple of years ago to see the cracks in this theory. During 2018, stocks gained 2.8% during the first 5 days before finishing the year in the red.
The January Effect is simply the tendency for stocks to consistently move higher in the first month of the year. It’s believed to be driven by the very same investors — pro and retail alike — who engage in year-end tax-loss selling. They often want to put that money right back to work at the beginning of the new year.
And the generally large money flows into the stock market from individual as well as institutional investors at the beginning of each month. Those money flows can be magnified during the first month of the year.
HAPPY TRADES