

MARKETSCOPE : Don’t Spit In the Wind
September, 27 2022
Fed Hikes 75bps, No Pivot & A Hard Landing

Bond yields shot up, and equities sank to new lows for the year (outside the US), bringing the economy into territory that few people much under 60 can even remember, at least during their working lives.
Did everyone get it right this time? The U.S. central bank has reiterated that the fight against inflation will be tough, complicated and long. Other countries have also raised rates, including Norway, Switzerland and the UK. The impact of these restrictive monetary policies can already be seen on activity indices, but not yet on prices… hence some distress among investors.
 While central banks keep raising key rates, markets continue plunging after a week of decline. With bond yields soaring and aggressive tightening by various central banks, financial markets have just experienced a second consecutive week of sharp declines, weighed down by geopolitical tensions and fears of recession. Panic is now apparent across markets.
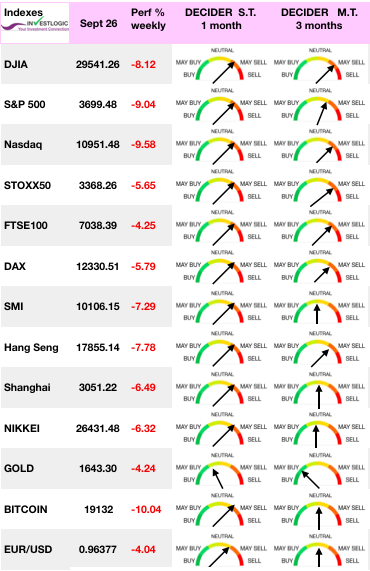
The Dow Jones Industrial Average fell to new intraday lows since late 2020, while the S&P 500 Index and Nasdaq Composite managed to stay slightly above their bottoms in mid-June 2022. The VIX index, so-called fear gauge, rose sharply at the end of the week. The two-year U.S. Treasury note yield rose above 4.10%—its highest level since October 2007—and the 10-year U.S. Treasury note yield jumped briefly to 3.77%—its highest mark since November 2008.
The STOXX Europe 600 Index ended the week down 4.37%, dropping to the lowest levels in more than a year. Yields on German 10-year government bonds rose to fresh decade highs while UK gilt yields jumped sharply on the prospect of escalating public debt and a sharp increase in interest rates after the government slashed taxes by the most since 1972 to support the economy. The UK pound fell to USD 1.09—a 37-year low.
Volatility has clearly intensified, and is expected to continue in the coming weeks, as Q3 earnings season approaches. Soaring bond yields and a strong U.S. dollar have reset valuations and earnings expectations on nearly every sector.
MARKETS : We Are Not There Yet
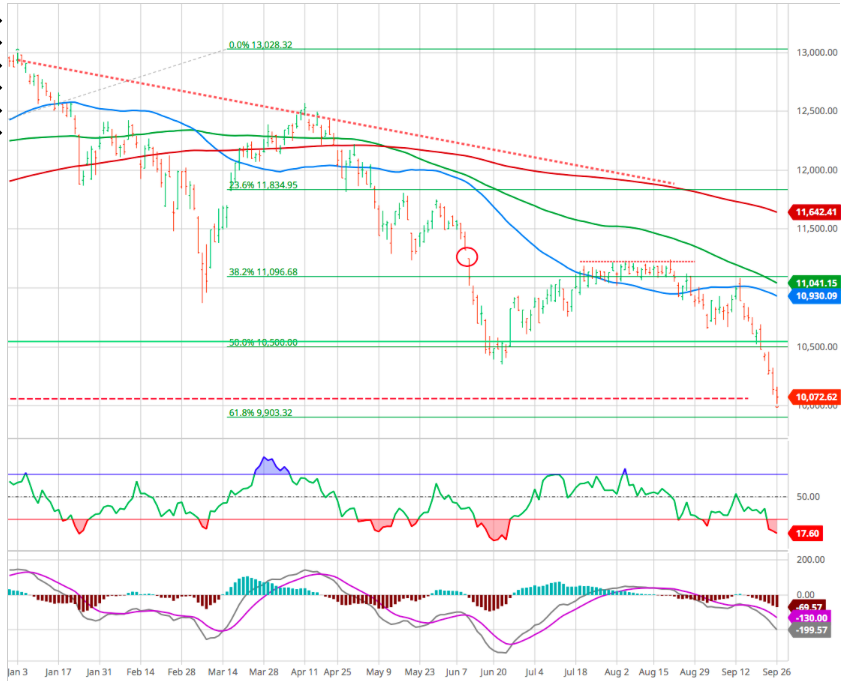
52 Week Low 3,636.87 Friday’s Low 3,647.47 June’s Low held. Perhaps that level is broken this week.
The telltale sign of looming danger came from the VIX (and rising volatility across other asset classes more broadly). When you’re entering the F#@k bucket for volatility (i.e. VIX rising above 30) that is not a buy signal, that is a crash signal. On the good side of the equation is that we are getting closer to a sell capitulation.
The average stock in the Russell 3,000 was down 41.7% from its 52-week high as of the close yesterday. That means the average stock would need to rally 71.5% from here to get back to its high. It’s much worse in some sectors, though. As shown below, four sectors have average prices roughly 50% below their 52-week highs. Communication Services is at -51.8%, Consumer Discretionary is at -49.8%, Tech is at -49.4%, and Health Care is at -48.4%. Even Energy stocks are 36.9% below their 52-week highs.
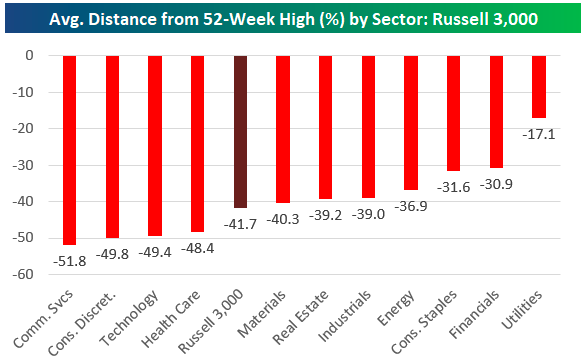
courtesy of Bespoke Investment Group
The combination of the S&P 500’s bearish trend and poor seasonals suggests trading conditions are likely to get worse before they get better, we caution that extreme pessimism can linger over the near term. For the S&P 500, we see near-term downside risk to 3,200 which would mark a 61.8 % bull market retracement. in the meantime it will correspond to a fifth wave in an Elliott major downtrend.
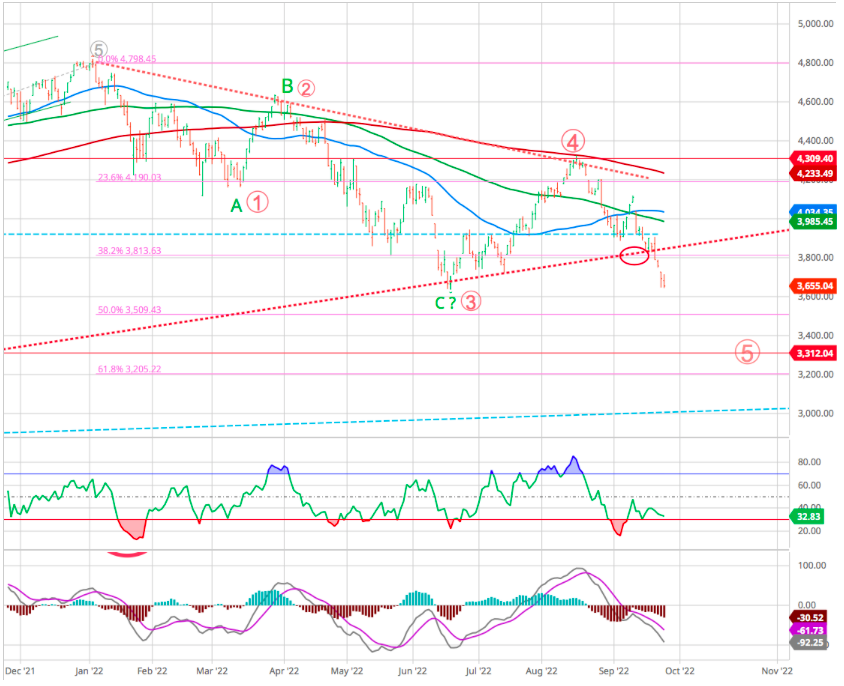
Yes more economic pain means worse that the +0.5 % GDP estimate for Q3. It means likely recession which includes rise in unemployment. That is not being served up at this moment but will likely take top billing in the months ahead. And with it the bear market should press lower. Add it all up and it increases the odds of more downside for the market.
So, let’s talk about key price areas on the way down for the S&P 500 :
- 3,855 = 20% down from the all time highs. Meaning the point that separates bull from bear territory. That has been the last point of support.
- 3,636 = the June lows. Rarely will you see any correction or bear market that ends without retesting the lows. So that is likely the next point of support as we explore the true depths of this bear market.
- It may be hard for stocks to head below this without seeing some of that pain on display that the Fed talked about. Like the employment market finally showing some weakness. So if we rush down there and pain is not on the menu yet, then this will be ample support perhaps with another juicy bounce to follow. Not an 18% insanity bounce like we say in July/August. Perhaps more like +5-10% awaiting the next economic signals.
If and when the economic pain train is on the way, then stocks will keep heading lower.
- 3,312 = 30% down from the all time highs. Likely there will be some folks starting to bottom fish around here. Or simply start to take profits on inverse ETFs…but definitely not fully long at this time given the points noted below.
- 3,205 61.8 % retracement from the last bull trend which is in line with the average decline of a bear market. Another spot to take profits on inverse ETFs and bottom fish for the eventual return of the next bull market.
- 3,000 = Very interesting psychological level of support. It may be hard to go lower than that unless it truly feels like a much worse than normal recession. And yes, we may never make it down here as there will be a lot of buying activity between 3,180 and 3,312. But if we did get this low, then will put more money to work in the market for return of the next bull. Maybe even back to fully invested.
We are highlighting this all out for 2 reasons.
- First, to understand the likely downside potential and why the hedge is in place to mop up gains on the way down.
- Second, to show where we may want to start taking profits on the hedge and prepare for the next bull market. We will be very tempted to maybe get back to 30-40% long in that area around 3,373.
There is little to get excited about until the Fed stops hiking rates aggressively and reducing its balance sheet. We recommend to cut further equity exposure levels on the next rally and raise cash levels further. Keep a watch on the MACD signal, as it will provide the best guidance for a sellable rally near term. There is a lot of congestion at the 3900-4000 level, which will provide sufficient resistance to cap a reflexive rally. Those levels provide a reasonable “sell” target for now.
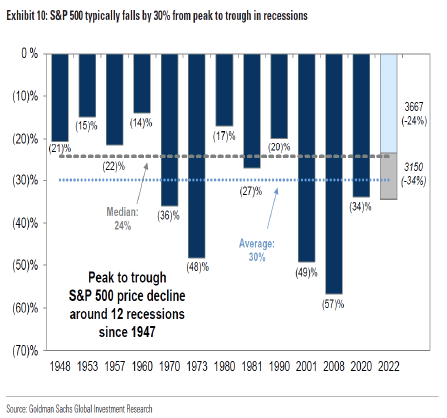
Last Friday, Goldman Sachs slashed their year-end price targets for the S&P 500 index. The “hard landing” scenario was most important.
In a recession, we forecast earnings will fall and the yield gap will widen, pushing the index to a trough of 3150. Our economists assign a 35% probability of recession in the next 12 months and note that any recession would likely be mild given the lack of major financial imbalances in the economy. As we previously outlined, in the event of a moderate recession, our top-down model indicates EPS would fall by 11% to $200.
For context, a 34% peak-to-trough decline in the S&P 500 index during a recession would only be slightly worse than the historical average of 30%. We see two risks that would create a more dramatic sell-off in equities during a recession. First, if inflation concerns were to limit the degree of monetary or fiscal policy support and interest rates did not fall, it could lead to even lower valuations or even larger economic and earnings growth declines than we model. Second, concentrated sector weakness, such as Information Technology in 2001 and Financials in 2008, could lead to an even sharper earnings and price decline.
Remember NOBODY rings a bell at the top or bottom. It will not be easy. And will be hard to do in the moment because we will be buying when everything looks terrible (economy…price action etc). But indeed, with the stock market it is always “darkest before the dawn”.
The Swiss Stock Market Index finally gave up following the Swiss National Bank rates increase and finished close to our target of 10’000.
Watch out earnings downward revision
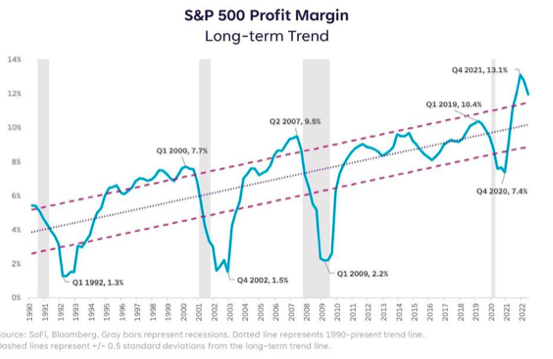
Earnings will likely revert to below $200/share just to reach the median long-term growth trend.
More importantly, despite the recent downward revisions, the current estimates still exceed the historical 6% exponential growth trend, which contained earnings growth since 1950, by one of the most significant deviations ever.
Q3 earnings estimates have been cut most of sectors over the past several weeks, with the biggest declines coming in Consumer Discretionary, Consumer Staples, Technology and Retail. Given the U.S.’s status as a service and consumption-based economy, these are key sectors where we generally don’t want to see earnings coming down. It’s also worth noting that nearly half of S&P 500 companies mentioned ‘recession’ on their post-earnings conference calls in Q2, which is far more than we see in a typical quarter.
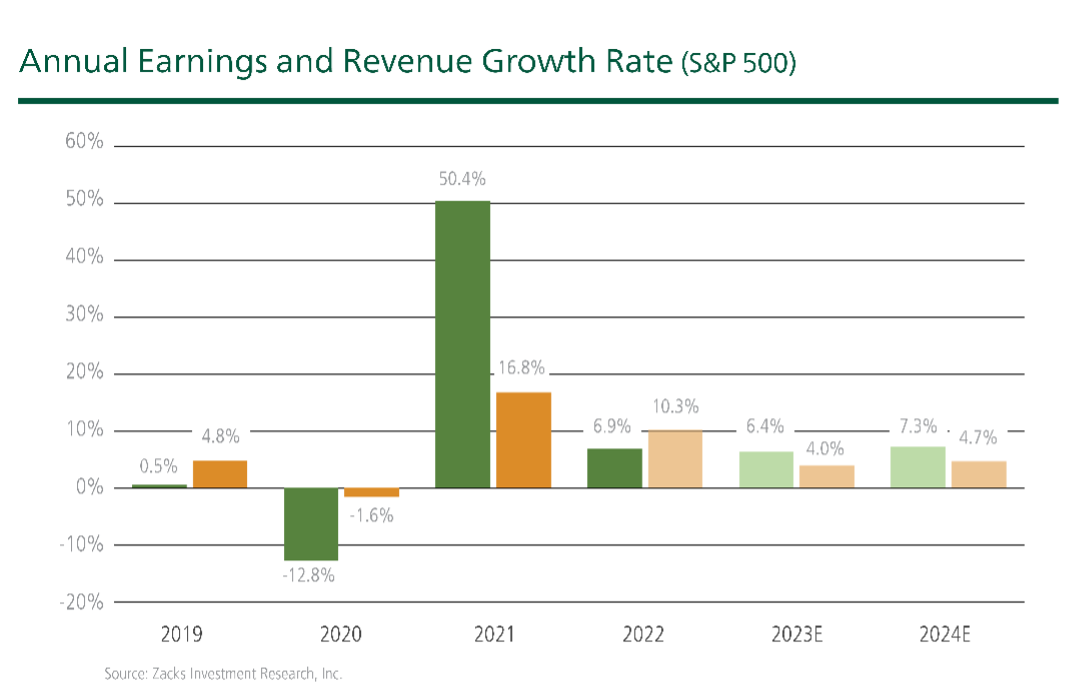
Earnings weakness is expected to persist in Q4 and into 2023, with estimates in decline for these periods as well. As you can see on the chart below, there is still a consensus that we’ll see earnings growth this year and next – it’s just much slower growth than was anticipated at the beginning of the year.
The trend in margin growth now appears to have reversed. Interest rates are being aggressively increased by central banks, which will increase the cost of debt. The developing recession and the presence of inflation will make it more difficult for companies to pass on cost increases. Finally, the trend towards globalization appears at an end due to the fraught geopolitical scene. All these factors argue for reduced profit margins, which, in turn, will result in lower corporate earnings. The implications for equity markets are clear.
The factors will continue presenting challenges for markets. More importantly, they will also shape the investment opportunities that will appear at the conclusion of the current bear market. New bull markets have historically had different leaders than their predecessors, with tomorrow’s market leaders being influenced by the macro and geopolitical factors that so dominate the investment environment.
The Most Important Price In the World
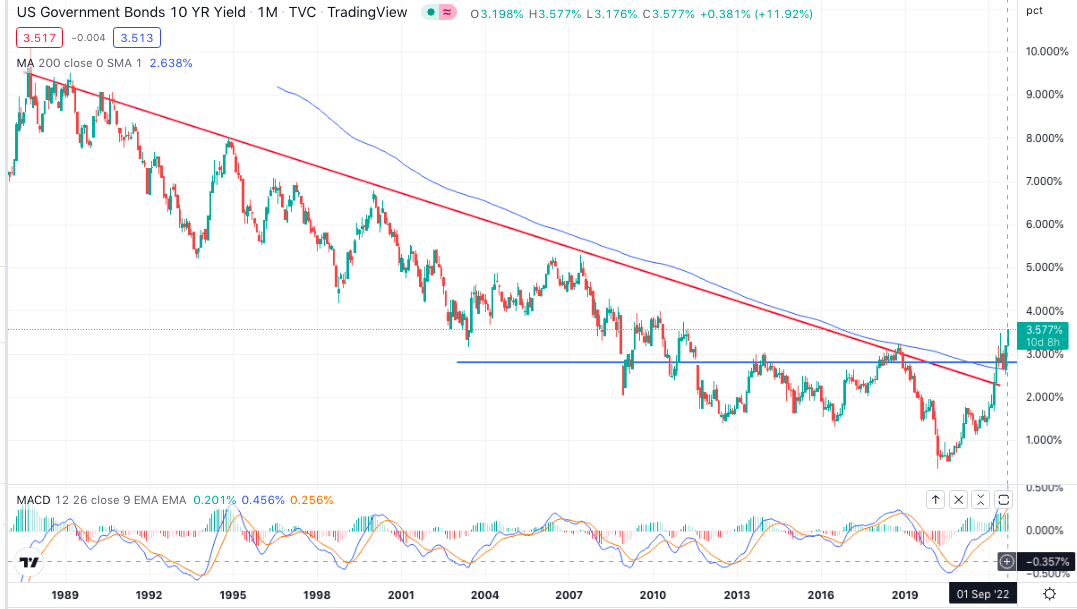
Don’t be fooled; the 10-year yield is the chart and market indicator to monitor.
First, through the economic effect of higher borrowing costs, and second, through the valuation effect as a higher interest rate to discount profits lowers stock valuations.
The 10-year Treasury yield crossed 3.5% last Monday for the first time since 2011, while the rate on the 2-year Treasury rose overnight to a 15-year high of 3.97%. The deep inversion and bearish run in the bond market is spooking investors ahead of another monster rate hike by the Fed. As long as inflation continues to surprise to the upside, the volatility will likely remain, with the central bank now clearly willing to bring down the price pressures at all costs and recession fears are cropping up again.
The 10-year Treasury yield has been climbing in recent days, pushing past 3.5%, its highest level since 2011, while the 2-year Treasury yield hit its highest level since 2007, briefly topping 4.0%.
The Fed delivered a ‘tough love’ message that interest rates will be higher, and for longer, than expected, the Fed will continue to hike rates until it actually restrains the economy and intends to keep rates at those restrictive levels until inflation is unmistakably on its way to 2%.
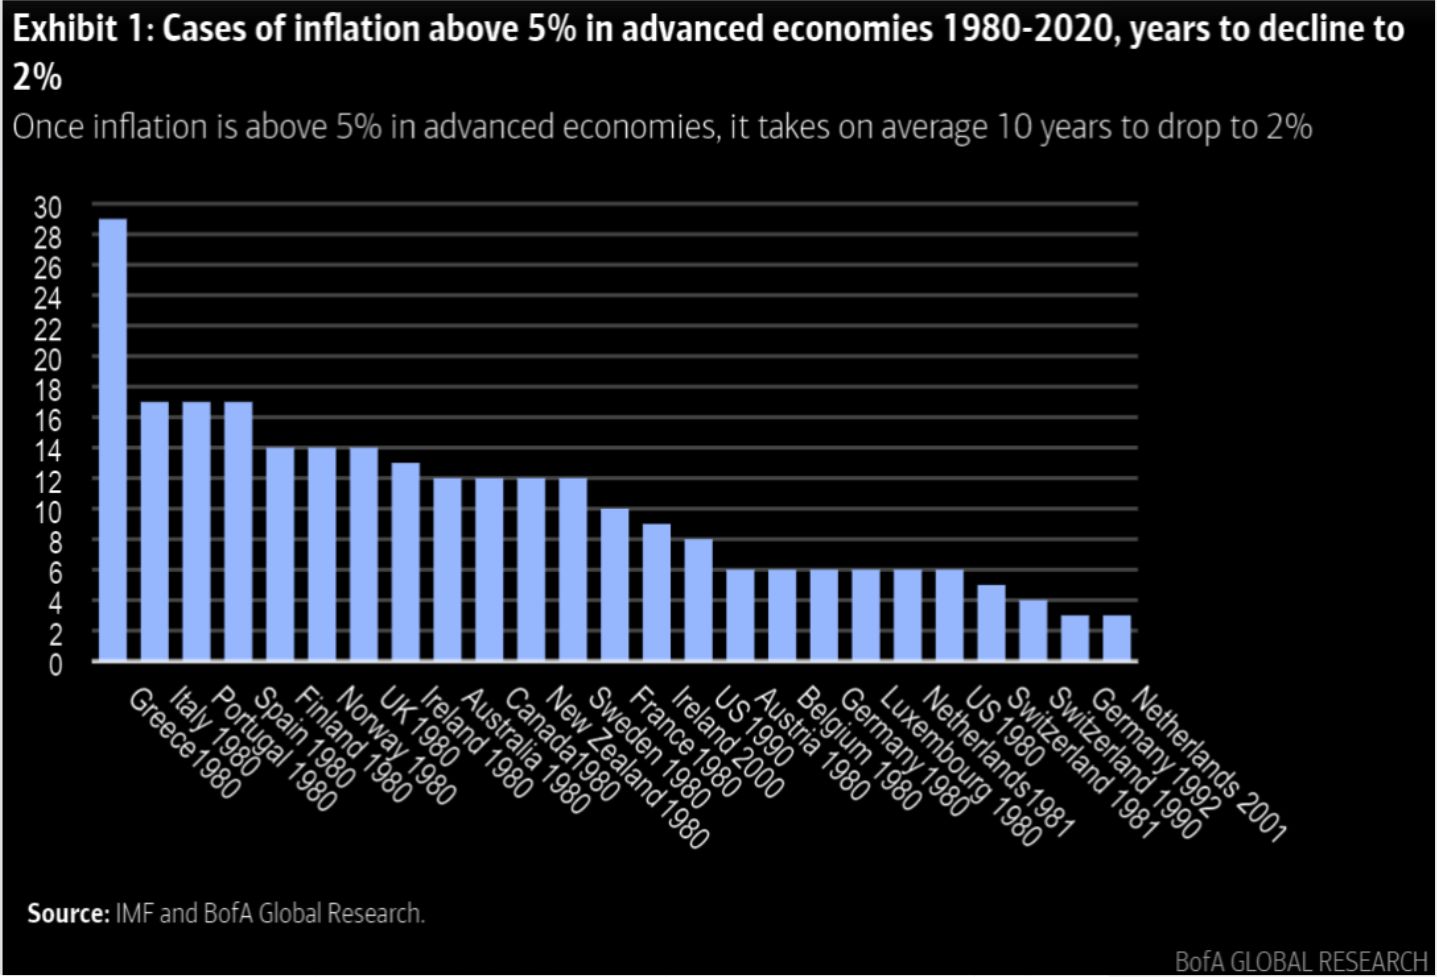
Note : Once inflation is above 5% in advanced economies, it takes on average 10 years to drop to 2%
A quantitative tightening program is also in the works to reduce the Fed’s whopping $9T balance sheet, leading to more upward pressure on yields.
And Albert Edwards, Societe Generale’s chief investment strategist to conclude “The Great Melt will not only melt the ‘Ice’ in ‘Ice Age,’ but investor returns are set to melt away too.”
How Hard of A Hard Landing
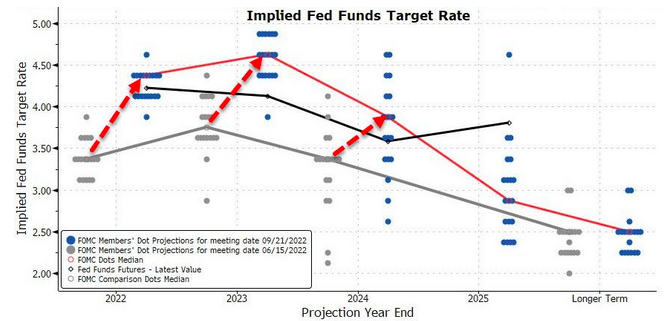
Chart courtesy of Zerohege
The Fed’s “Dot Plot,” showing no “pivot” in policy anytime soon, sent markets lower. There was a 10-9 majority in favor of hiking above 4.25% this year, suggesting a fourth 75 basis-point increase in November is possible. Things couldn’t have been more hawkish with the Fed’s “dot plot” showing a benchmark interest rate of 4.4% by the end of this year, as well as a terminal rate of 4.6% in 2023.
The question, now, appears to be how hard of a hard landing will there be.
Ned Davis Research has published an analysis of past Federal Reserve tightening cycles dating back to 1955 to determine the time horizon between the beginning of an easing cycle and the end of a bear market. (Tightening cycles are defined as three or more hikes without an intervening cut, whereas as easing cycles are two or more cuts without an intervening hike. Full cycles include both tightenings and subsequent easings.)
On this basis, NDR found that the market and the Fed lined up perfectly only about half the time. The table below shows the start and end dates of tightening cycles compiled by the firm.
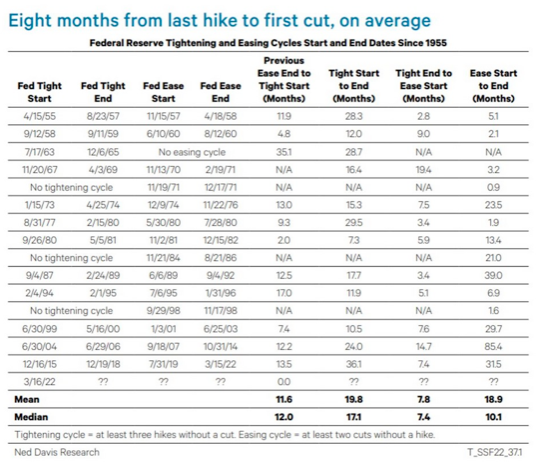
The main takeaway for stocks: Bear markets roughly end about the same time as easing cycles — the timing just widely varies, sometimes differing in years.
The main takeaway for those hoping for an imminent pivot by the Fed is that (again with much variation), rates tend to stay at the top for eight months before cuts start:
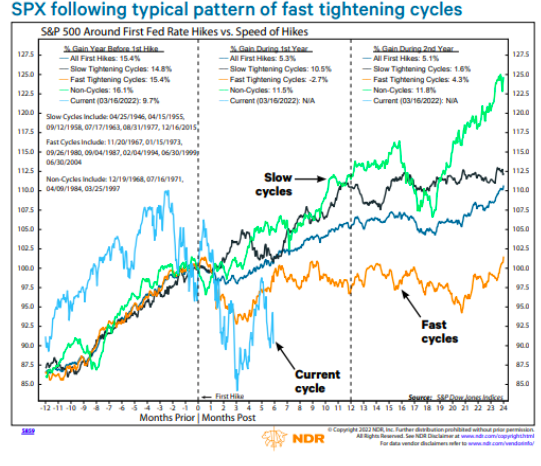
Equities, they also noted, have seen downturns sooner during fast tightening cycles (Fed raising rates at most meetings) compared to slow ones. They also take longer to recover:
This is, of course, a fast cycle so far. Probably best not to bet too much on an imminent Fed pivot.
see John Authers : As Binary As It Gets: Bulls, Bears and the Pivot
Stay cautious
BONUS
Jeremy Siegel, Professor of Finance at Wharton Business School, rips Fed chair Jerome Powell for his disastrous monetary policy.