MARKETSCOPE : Don’t Fight the Trend
February, 12 2024
“The most contrarian thing of all is not to oppose the crowd but to think for yourself.” — Peter Thiel
One record after another

It’s a five-month high, but it came off a five-month low. There’s so much noise, but there’s still consistency and discipline in the process.
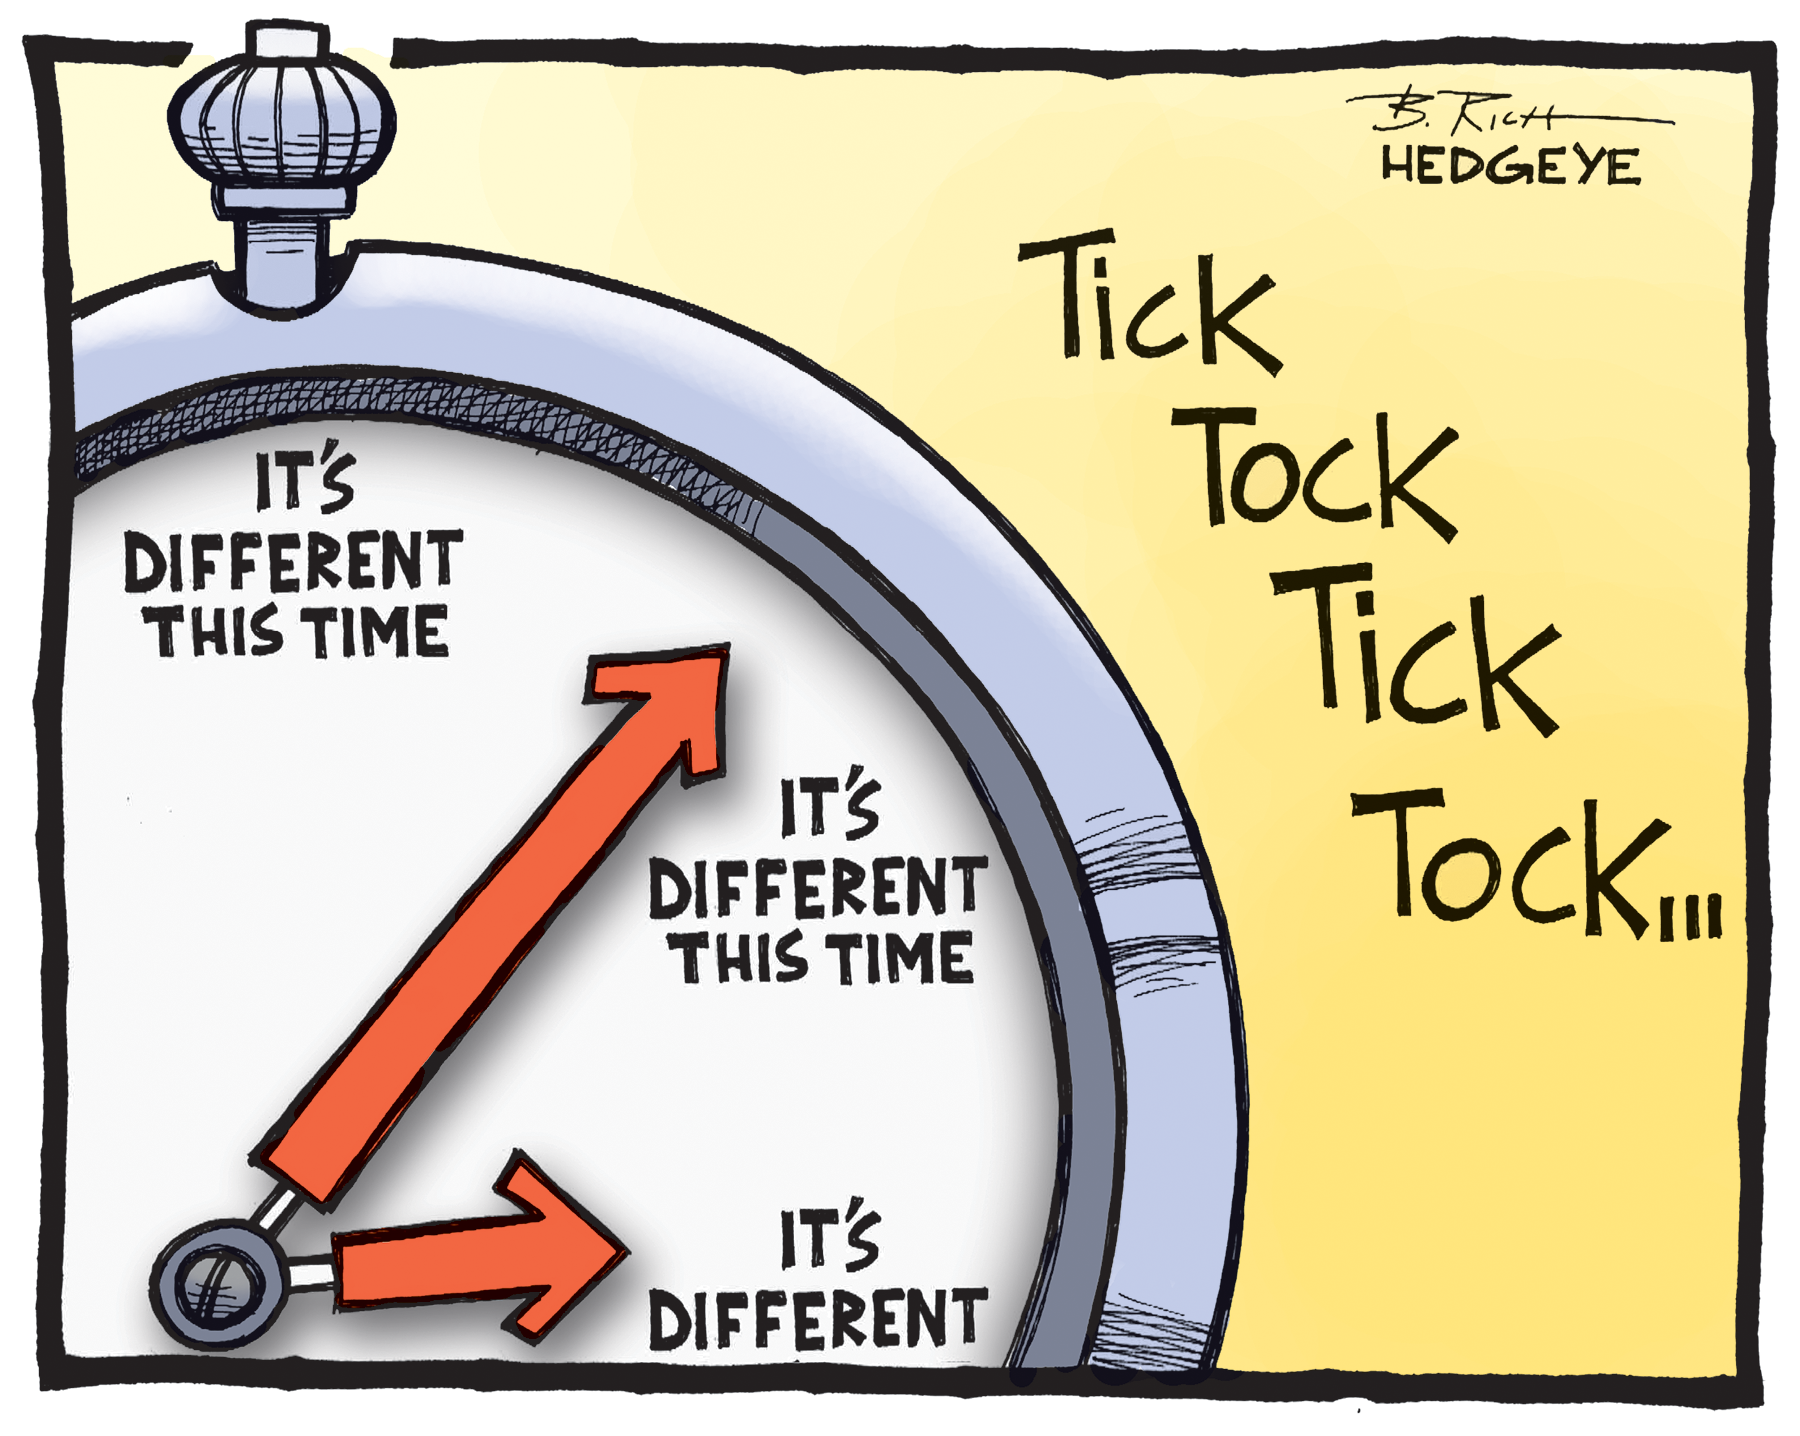
With all of these suddenly rosy outlooks, tweets may soon be yielding “this time iit s different “ and a surge in one U.S. economic data point doesn’t change the fact that major problems are brewing.
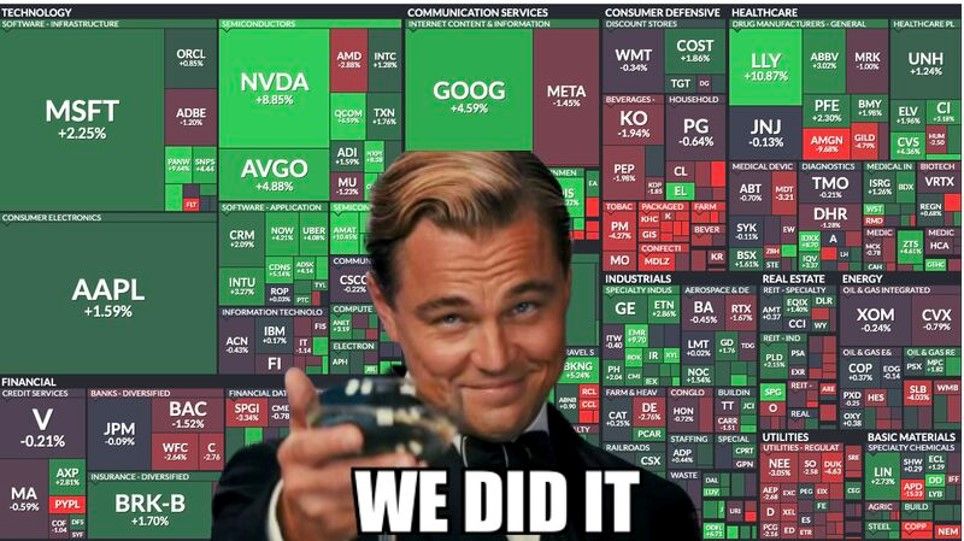
Most of the major US equity indexes moved higher over the week, with the S&P 500 Index reaching new highs and breaching the 5,000 threshold for the first time. The advance remained relatively narrow, however, with an equally weighted version of the index significantly trailing the standard market-weighted version for the fourth time in five weeks…
A surge in megacap tech stocks helped lift the S&P 500 and Nasdaq, with the S&P holding above the 5,000 level and extending its record high, after December’s revised inflation reading came in lower than first reported.
 Nvidia jumped 3.6% and hit an intraday record high, while tech-focused market heavyweights such as Microsoft, Amazon and Alphabet also scored gains. Meta was the biggest winner of the week, up 20% on Friday.
Corporate profits and upbeat guidance are showing healthy spending patterns among consumers and businesses alike, while AI momentum appears to justify the massive valuations seen in the tech sector.
Easing inflation data, a resilient economy and a solid earnings season so far have sparked this year’s market rally. The annual revisions to the consumer price index (CPI). The report showed that core consumer prices rose at a 3.3% annualized rate in the fourth quarter of 2023, unchanged from the previous reading.
We’ll just dwell on the US activity indices, the S&P Global US Services PMI and the ISM services index, which came out above the 50 contraction zone. In other words, all is well, and the narrative of a soft landing.
The US 10-year yield remained relatively stable within a horizontal consolidation channel of 3.85% and 4.23/25%.
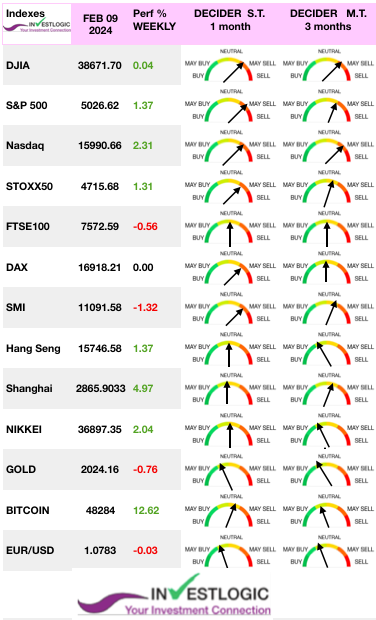
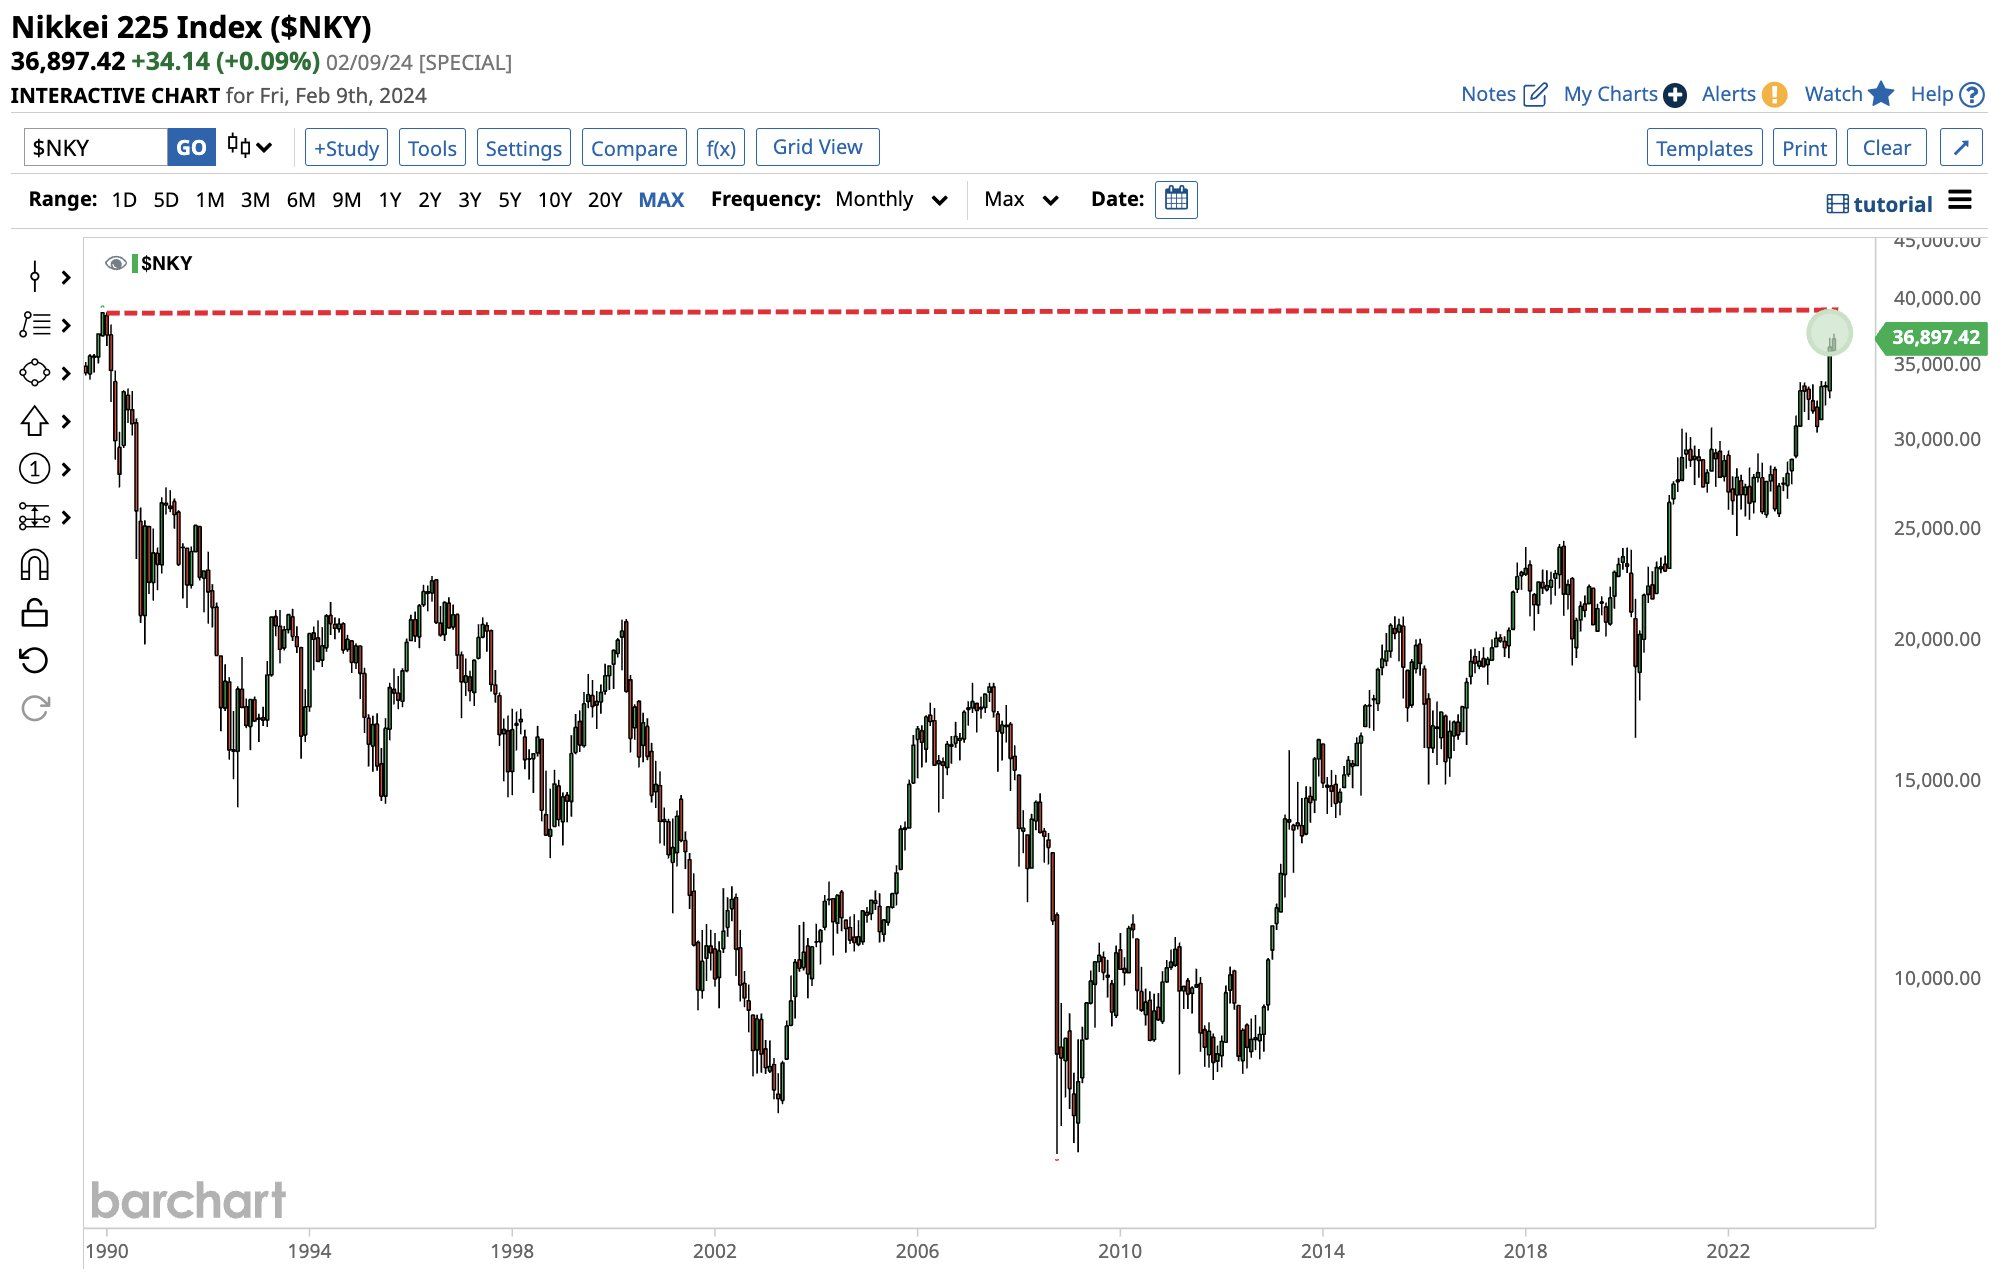
Elsewhere in the world, STOXX Europe 600 Index ended the week roughly flat. Japan’s stock markets rose over the week, with the Nikkei 225 Index gaining 1.1% a 34 year-old high. For the first time in 34 years, the Nikkei jumped above 37,000. The index is now about 5% away from taking out the all-time high set all the way back in December 1989.
China retreated as downbeat economic data and property sector headlines fueled investors’ pessimism about the growth outlook. Chinese consumer prices fell by 0.8% in January, a sign that the world’s second-largest economy is still convalescing. So far, initiatives by local authorities to kick-start the economy have proved futile or limited.
Ahead investors will turn their attention back to interest rates next week, inflation and producer prices in the US and various confidence indices (Empire State, Philly Fed, University of Michigan). In Asia, the Lunar New Year will disrupt the trading calendar. Shanghai will not reopen until February 19, and Taiwan on February 15. Hong Kong takes a break for two sessions, then resumes on February 14.
Next week’s earnings calendar includes a number of high-profile names, such as Coca-Cola, Shopify, Michelin, Heineken, Airbus, Capgemini, Schneider, Deere, Essilor Luxottica, ENI, Safran and Stellantis.
MARKETS : Investor’s Sentiment Is So Bullish It’s Getting Bearish
Bullish sentiment has surged as the “Fear Of Missing Out,” or FOMO, kicked in in recent weeks.
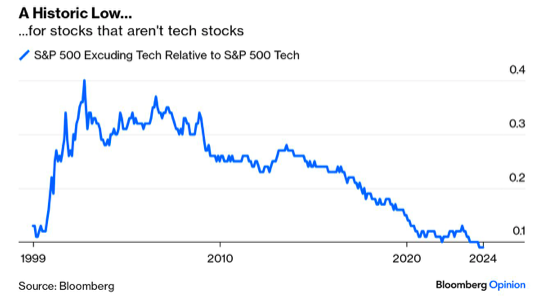
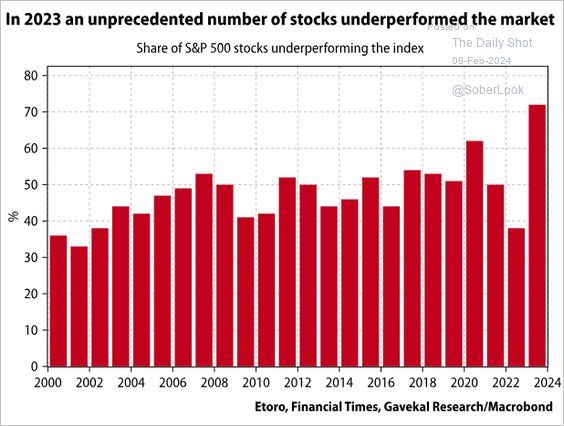
Within the S&P 500, fewer and fewer stocks have been participating in its most recent gains. More than 70% of stocks in the index underperformed. That is a record for this century.
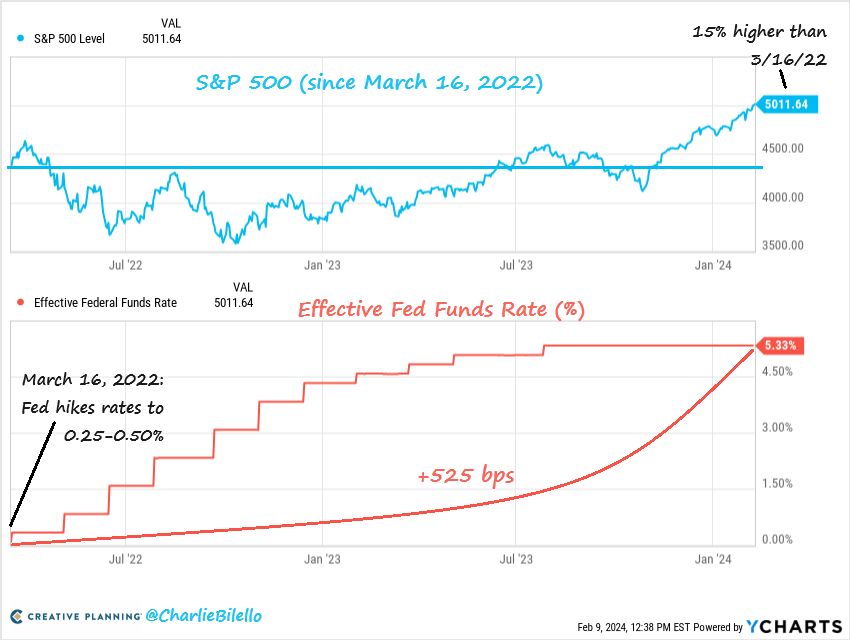
The chart from Charlie Bilello shows S&P 500 is now 15% higher than where it was when the Fed started hiking rates in March 2022.
Currently, market trends are bullish with “buy signals” in place, suggesting that allocations should remain equity-biased for now.
Looking at the S&P500 chart
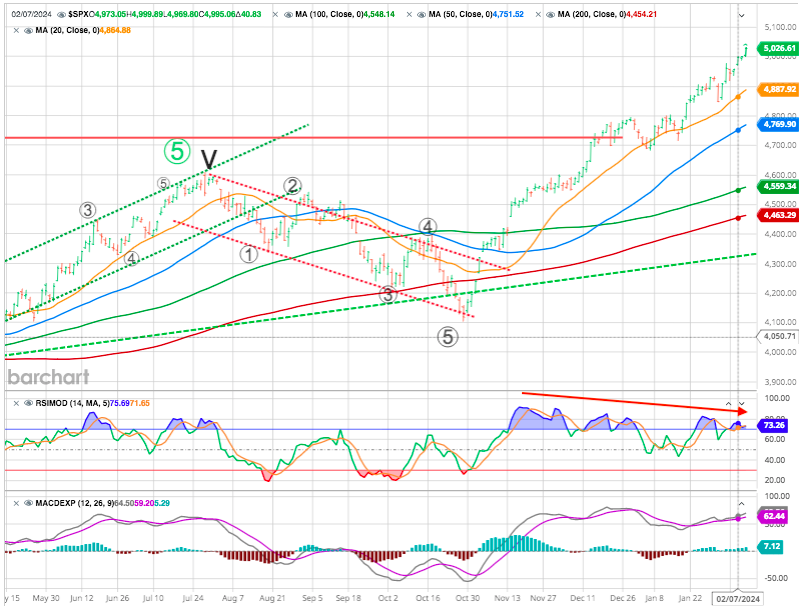
We can see that our RSI for the latest uptrend is continously making lower highs suggesting some erosion in the market trend. But the MACD remains positive. Critically, when both indicators trigger a sell signal, such aligns with short- and intermediate-term corrective market actions.
If we take the longer term with our favorite weekly chart
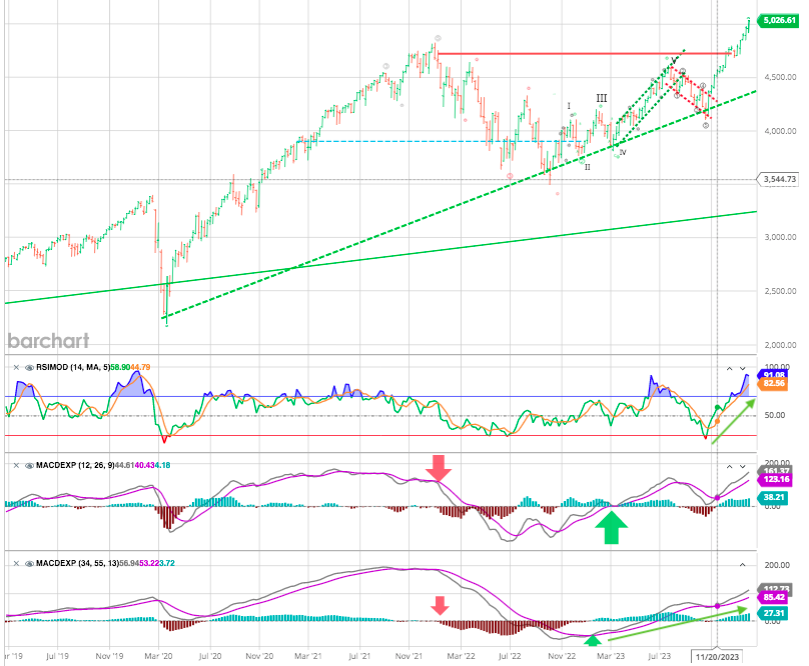
The two lower panes are Moving Average Convergence Divergence (MACD) indicators. The top pane is a short-term average series, and the bottom is intermediate-term. The two indicators are because the longer-term series confirms the shorter-term to reduce false signals.
The lower MACD points to a continuing uptrend established first in February 2023 with a buy sighnal for the shorter term in March 2023. Red arrows showed the previous sell signals, When it will occcur again it will suggest that the eventual reversion will likely be more significant than just normal pullback when it occurs. Stay tuned .
Crypto:
Bitcoin soared by more than 11% this week and is now in contact with 47,500 at the time of writing. Ether is following the same trend, up almost 10% since Monday, and back above the $2,500 mark. This rise of crypto-assets is part of a return of investors’ appetite for risk, as evidenced by the all-time highs on US stock indices.
We’ll say it again: At first risk happens slowly, then all at once !
Although various technical measures suggest the current stock market environment has become particularly fraught, one of the most challenging things to do is go “against” the prevailing bias regarding investing. Such is known as contrarian investing. One of the most famous contrarian investors is Howard Marks, who once stated:
“Resisting – and thereby achieving success as a contrarian – isn’t easy. Things combine to make it difficult; including natural herd tendencies and the pain imposed by being out of step, particularly when momentum invariably makes pro-cyclical actions look correct for a while.
Given the uncertain nature of the future, and thus the difficulty of being confident your position is the right one – especially as price moves against you – it’s challenging to be a lonely contrarian.”
Why not sell and go to cash and wait for the correction?“
It is a valid question. Timing is always the issue. Therefore, when the bulls are running, it is not wise to stand before the stampede. Remember :
“Markets can remain irrational longer than you can remain solvent.”
Wall Street analysts, who remain focused on the “old way of doing things,” like to pigeonhole people into being universally “bullish” or “bearish.” It’s a shortcut and lazy conclusion for people who don’t do the real work.
What permabulls and permabears don’t understand is that the risk management process is about following the facts using fundamental economic research and some our common sense.
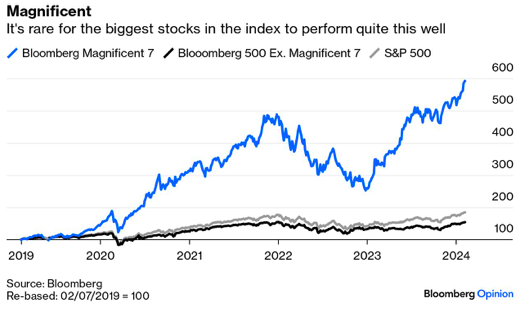
The question for bulls is whether this market continues to be propelled upward by a handful of mega-cap tech names or the rally broadens, and the average stock leads us higher, while the Magnificent 7 tread water from here (see below).
Magnificents
That unstoppable advance, driven by the mega-capitalization stocks last week, topped the psychological 5000 level on the index. With the strong momentum carrying that particular group of stocks, the index will likely try to push higher over the next few days. However, as shown, the market is back to more extreme overbought levels, and bullish sentiment has reached “greed.” (see Cluster Woe below)
As noted by John Authers from Bloomberg : we all know that the Magnificents are strong and profitable companies with a well-embedded competitive position. But it’s still hard to chalk their dominance up to the fundamentals.
As the redoubtable Albert Edwards of Societe Generale shows in this chart, the tech sector’s earnings per share are indeed rising, but much more slowly than their forward-earning forecasts.
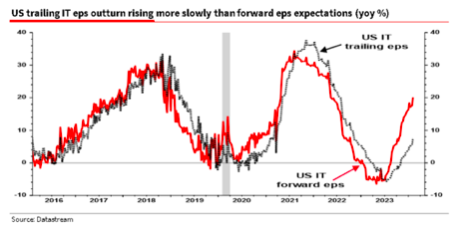
This isn’t usual, and might be explained by over-enthusiastic projections of the impact artificial intelligence will have on the profits of the Magnificents. Fund managers doing a good job of price discovery might be expected to exploit this, and bet against tech shares.
Some FOMO may also be taking place among investors who missed out on the big rally last year when the benchmark index soared more than 24%.
Top heaviness could be a concern given that the five largest stocks – Alphabet, Amazon, Apple, Microsoft and Nvidia – account for 27% of the S&P 500, but that has been going on for some time and hasn’t stopped the index from hitting the 3,000 level in 2019 and 4,000 only two years later.
The overall market is rising — so that makes it look uncomfortably as though this is a bubble.
Cluster of Woe
As stated in a Husman Fund research a “Cluster of Woe” derived from the handful of similarly extreme instances (most notably in 1972, 1987, 1998, 2000, 2018, 2020, and 2022) were typically followed by abrupt market losses of 10%-30% over the next 6-10 weeks (average -12.5%), with losses at the smaller end of that range often seeing deeper follow-through later.
These outcomes are treated as “regularities” rather than “forecasts,” and impression is that investors don’t accept those regularities anyway.
The current market conditions now “cluster” among the worst 0.1% instances in history, typically followed by abrupt market losses of 10%-30% over the next 6-10 weeks.
Recession risk is still present
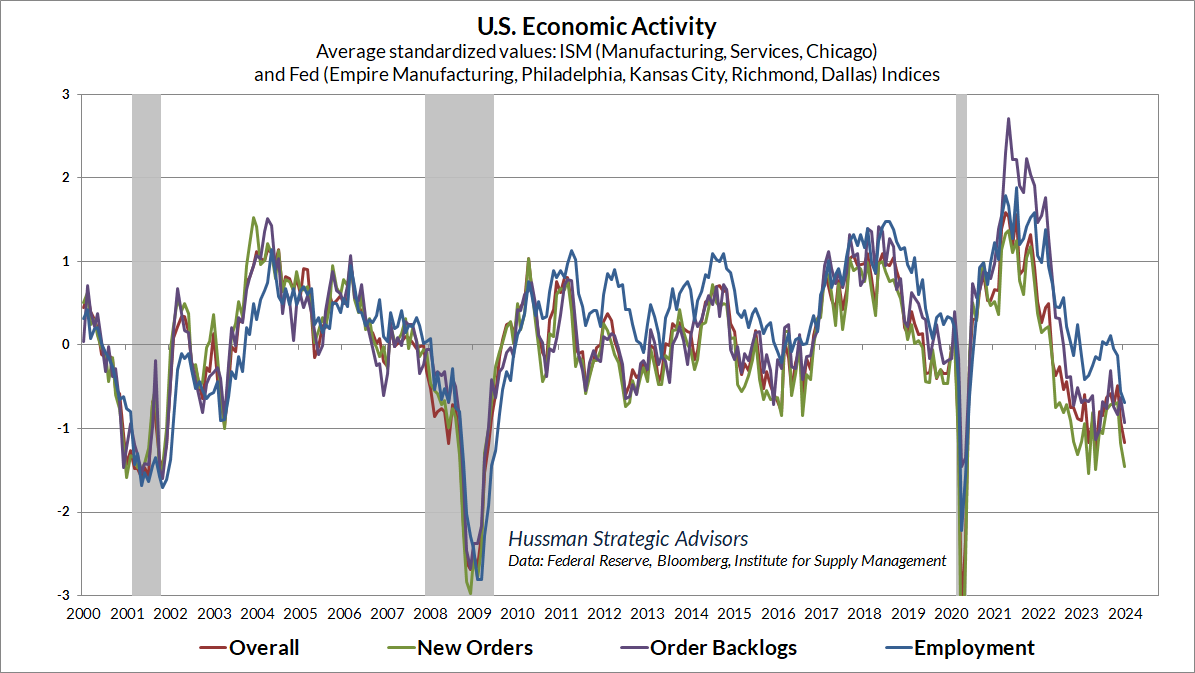
Amid the enthusiasm and now nearly unanimous consensus that recession risk is behind us, we shall reiterate our own view: the data remain consistent with a U.S. economy at the borderline of recession, but we would need more evidence to expect that outcome with confidence.
The chart below shows their Economic Activity Composite based on regional and national purchasing managers and Fed surveys. After a brief pop in the fourth quarter, this composite has again turned lower, and is already at levels that have historically been consistent with emerging recession.
Happy trades