MARKETSCOPE : BULLS STAMPEDE
March, 04 2024“Sometimes people don’t want to hear the truth because they don’t want their illusions destroyed.” – Friedrich Nietzsche
Global stock markets are coming off four consecutive months of gains. February, which statistically is not a great stock market month, didn’t live up to its reputation. Investors remain hypnotized by the potential of artificial intelligence, and are reassured by corporate earnings and the resilience of the US economy.
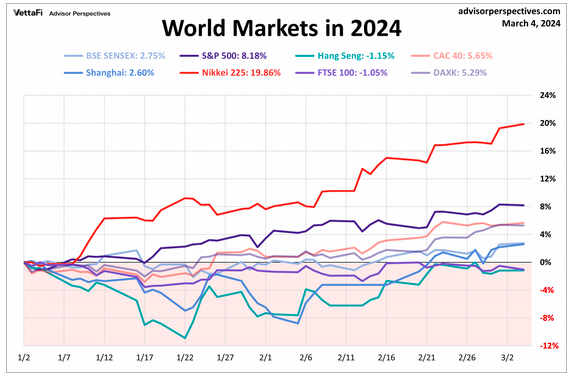
The Nasdaq Composite rose to an all-time high Friday, surpassing its 2021 record while the S&P 500 closed above 5100 for the first time. The month also closed a strong February, with the S&P 500 marking its strongest beginning two months of the year since 2019. The week’s gains were also broad-based, with an equal-weighted version of the g sp500 Index modestly outperforming its capitalization version.
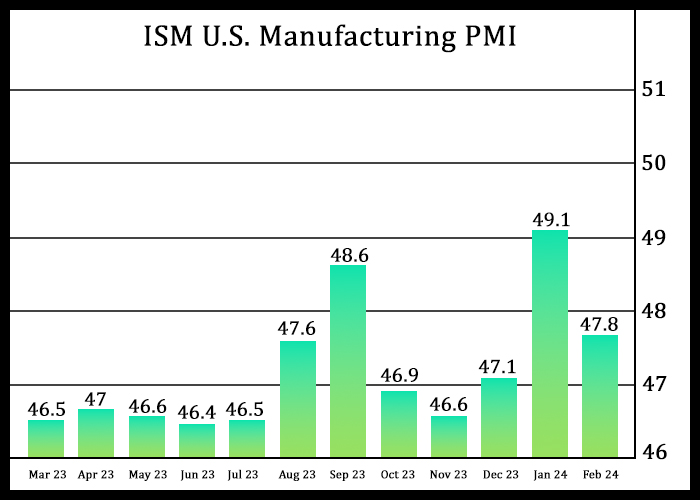
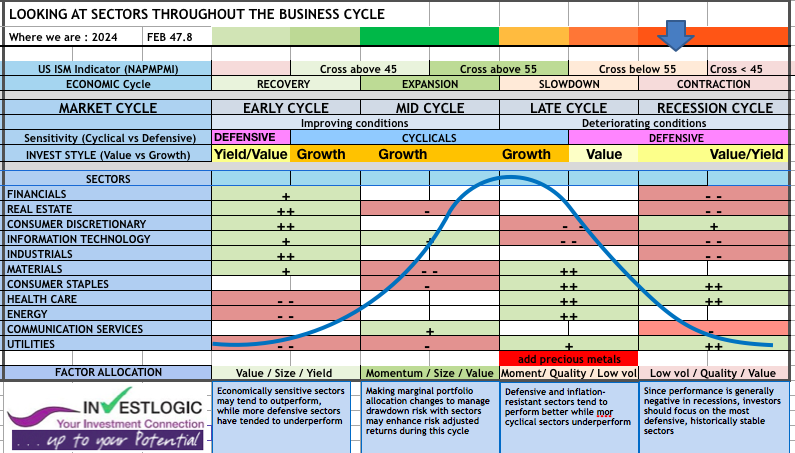
The favourite FED inflation-related indicators came out perfectly in line with expectations. On an annual basis, the seasonally-adjusted core PCE rose by +2.8%. But on Friday, a disappointing ISM Manufacturing index (back to 47.8 vs 49.1 in January) put some chill out.
Check our Proprietary ABS matrix at bottom.
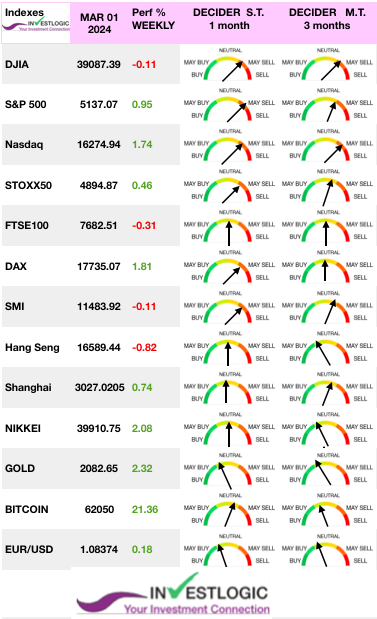 Following this data, the yield on the US 10-year bond continues to oscillate within a narrow consolidation band of between 4.35% and 4.20%. As things stand, the market is not pricing in a rate cut before the summer.
In Europe, STOXX Europe 600 Index ended little changed but remained near record highs as Eurozone inflation declined less than expected and economic sentiment worsened. This reinforced the market’s conviction that nothing will happen at the next ECB meeting.
In China, PMI indicators were weak in industry and a little better in services. Stocks in China rose on hopes that Beijing may boost monetary easing measures to stimulate growth.
Finally, let’s end in Japan, Japanese stocks had another strong week, with the Nikkei 225 gaining around 2.1%. The new governor of the central bank proved more reticent than expected about raising key interest rates. The yen flinched at this announcement, which could prolong the status quo that has prevailed in the archipelago for… 17 years.
AHEAD
Central banks are back in force this week. The ECB is expected to leave rates unchanged after its meeting on March 7. At the same time, Jerome Powell is scheduled to appear before the congressional committees of the US Congress on March 6 and 7 to provide an update on monetary policy and the economic outlook.
Also Monthly US employment data, always closely watched, will complete the picture on March 8. Pay attention to the unemployment rate! Stocks beat bonds when the unemployment rate is low and falling Bonds beat stocks when the unemployment rate is rising.
The pace of earnings releases is still slowing, but that won’t stop CrowdStrike, Costco, Oracle, Henkel, Bayer, Thales and a few others from coming under the market’s microscope.
MARKETS : YOLO, The Return Of The Animal Spirit
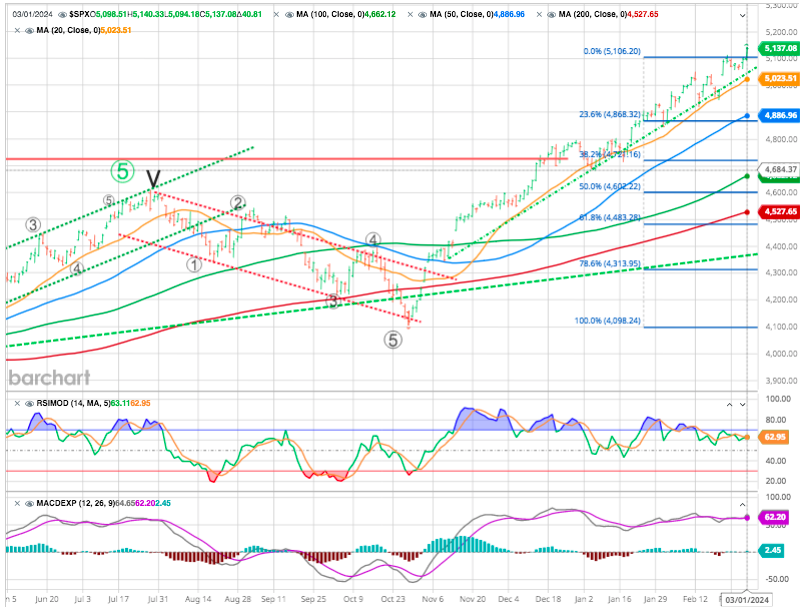
The ongoing bull rally following Nvidia’s blowout earnings report continues uninterrupted. While the overall market traded higher into the end of the week, setting new all-time highs, the bullish November trend remains intact.
The MACD “buy signal” remains elevated, and an apparent deterioration in the market’s momentum remains (RSI).
On top of that, the biggest existential risk for bull markets – a recession – continues to look off the cards for now.
While there are a few pundits out there still calling for a recession this year, the consensus is firmly in the camp of continued expansion. In fact, estimates for the rate of economic growth in 2024 have continued to improve since the beginning of this year.
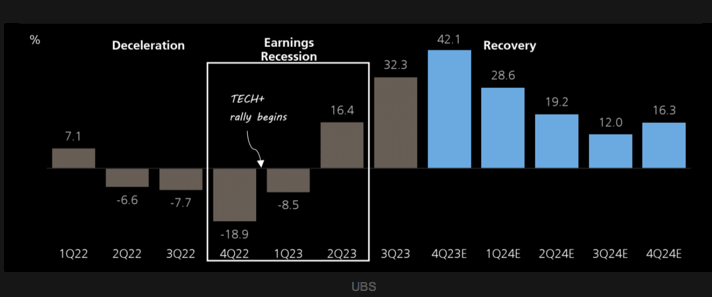
Tech earnings MoMo to get “worse”
The tech rally began in earnest when market realized that there were 3-4 upcoming quarters with massive Tech EPS momentum. Now that 2nd derivative does not look as appealing over the coming quarters.
Source zerohedge
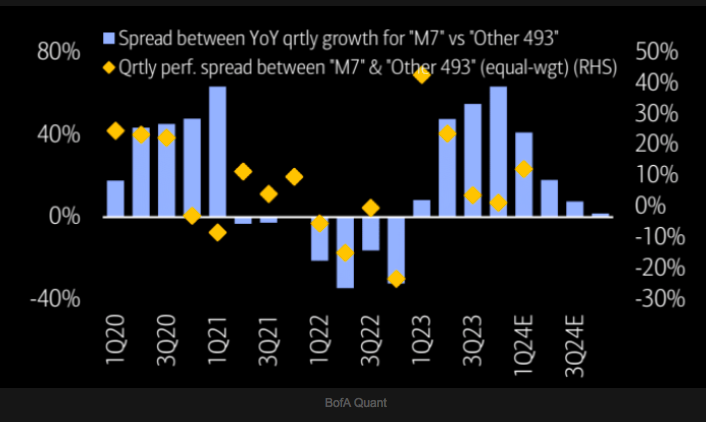
Magnificent 7 earnings growth outpaced “Other 493” in 2023, but the gap is narrowing suggesting Mag 7 outperformance may be waning.
Source zerohedge
Apple : As Apple goes so goes the market
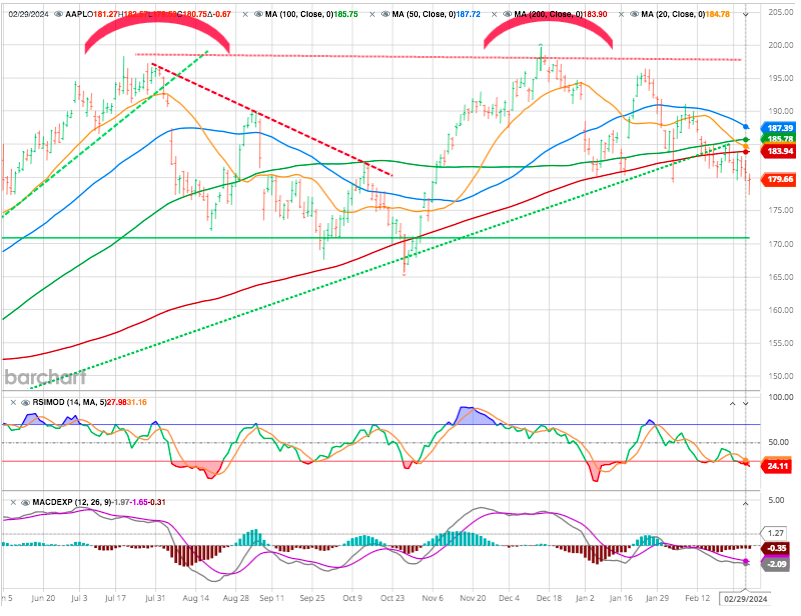
Apple had its 3rd consecutive weekly close below its 200D moving average and closed at its lowest price since early November.
Under-Performing Stock Market Small Cap Index Eyes Fibonacci Breakout
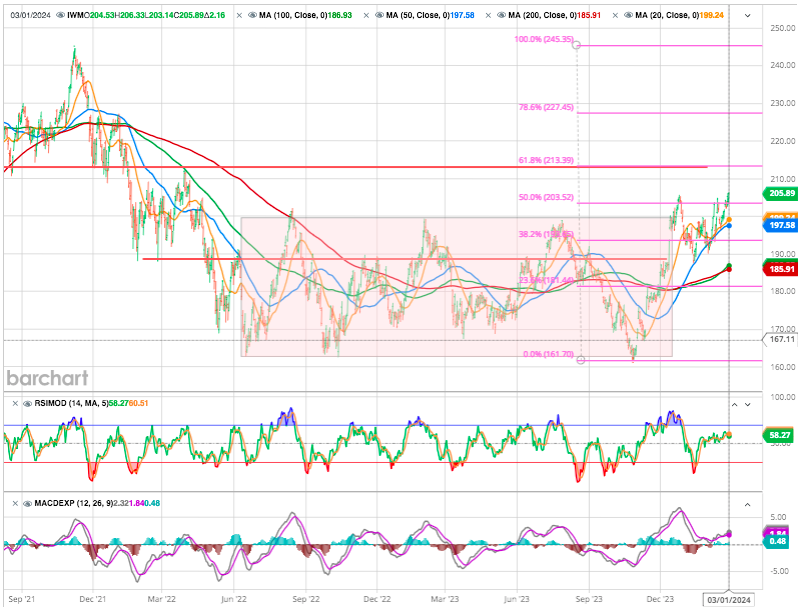
A quick look at where we stand on the Russell 2000. The IWM has broken out from a 2 year base. As tit is not dominated by mega cap technology stocks, it presents an opportunity for other sectors to take the baton and lead.
It is fair to say that the stock market has been lead higher by technology stocks and large cap stocks, in general.
But two stock market indices that historically have been key to broad market rallies have under-performed: the small cap Russell 2000 Index and the broad-based Value Line Geometric Composite.
Now both are trading at key breakout resistance levels as above chart. And both indices are testing the 50% fibonacci retracement level.
A breakout would be bullish for these indices (as well as the broader market), while continued trade below these levels would indicate lagging performance. It might be time to say goodbye to these levels, one way or the other!
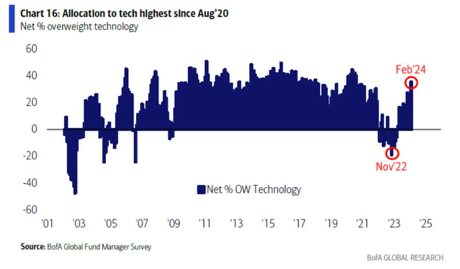
What would constitute a powerful breakout ? An ideal situation would be if capital can rotate out of overcrowded sectors into less popular ones. From the recent BofA Global Fund Manager Survey, fund managers are currently the most allocated to technology since August 2020.
Source BofA
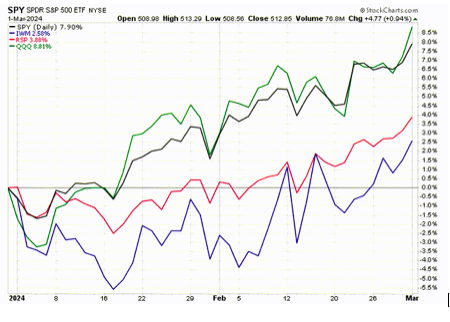
As such, the more attractive play here is to be long the broad market (Russell 2000) over the S&P 500 or Nasdaq 100 , which are heavily weighted to mega cap technology stocks.
We are not calling a top in the bubbly artificial intelligence space, but we shall not jumping on the bandwagon either, preferring to look at those segments of the market that present a greater value proposition and still decent upside potential on a risk versus reward basis.
That points to the average stock, with an emphasis on small caps. The chart below with investors last week, which shows a year-to-date performance comparison between the Nasdaq 100 and the S&P 500 , both of which are dominated by the largest technology companies, and the equally weighted S&P 500 and Russell 2000.
As the saying goes, “rotation is the lifeblood of a bull market”.
GOLD : Bullish Message … Only If It Breaks Out!
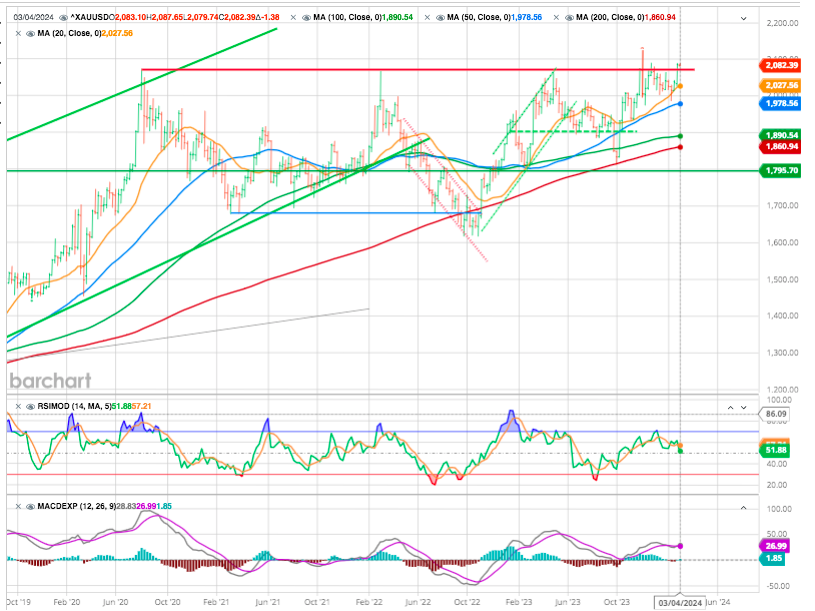
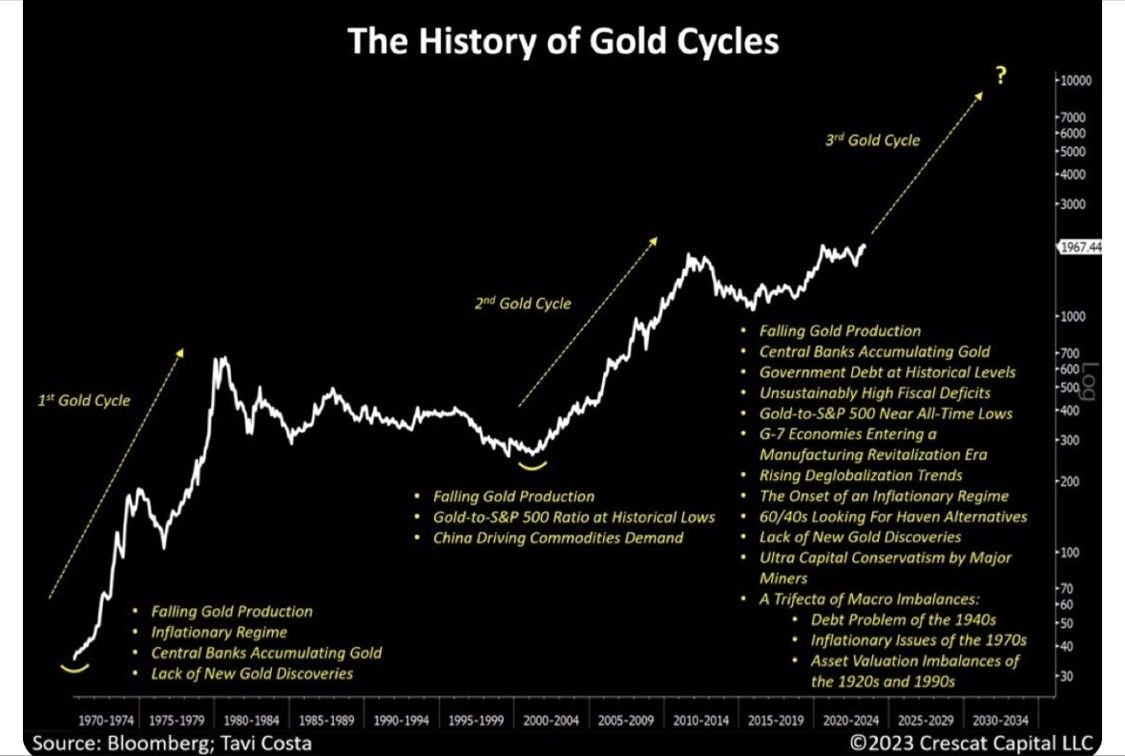
Gold prices remain elevated but have yet to record the major breakout that gold bulls are looking for. And above, you can see why.
The long-term “Weekly” chart above has revisited resistance several times, failing to produce a decisive breakout. It first hit resistance 3.5 year ago ! And it’s back again for the 4th time.
The key ingredient for a sustained rally would be clarity that interest rates are heading down. Gold is regarded as a hedge against central bank fecklessness. Its earlier flirtations with $2,100 came at points when rate cuts appeared to be in the offing. As recent data have shown mixed signals on inflation, that conviction has dwindled.
via Philippe Gijsels BNP Paribas Fortis
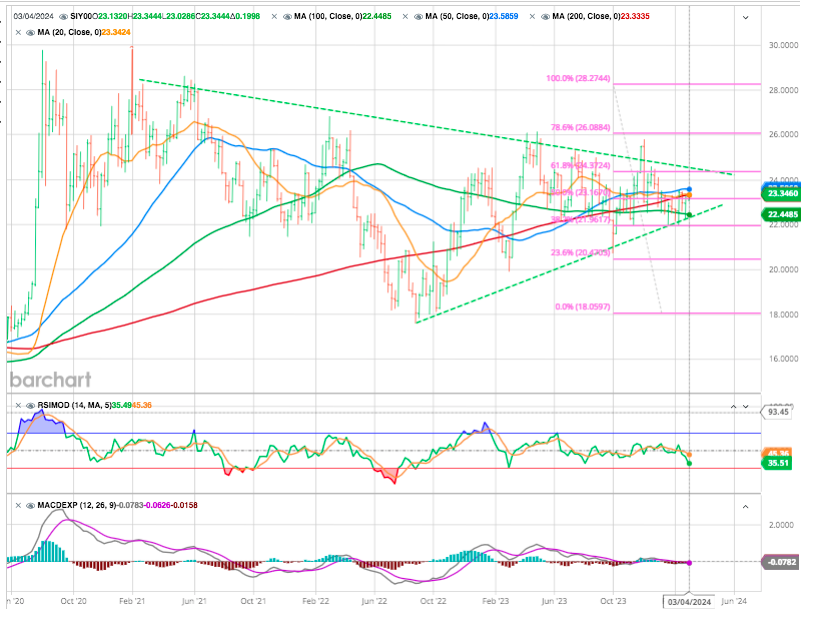
In such a case SILVER might be attractive as shown on the weekly chart
All of this price action ended up forming a large pennant pattern. And if Silver breaks off the triangle above the 61.8%% level. it would point to a stronger economy and the metal uptrend. However a trade below its 50 % Fibo retracement level would send a contraction message in regards of the economy.
Cryptos
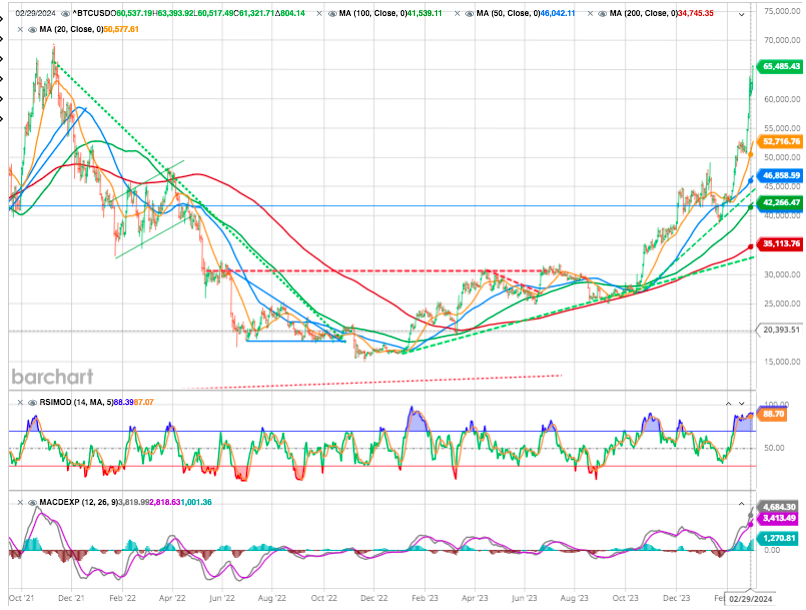
Bitcoin ended February with a stratospheric gain: +43%. You wouldd have to go back to December 2020 to find such performances for the digital currency.
Last week was marked by a new record for inflows into Bitcoin Spot ETFs, particularly on Wednesday, with $673 million trickling into these exchange-traded products on a single day, helping the asset to rise by almost 20% since Monday. Bitcoin is now flirting with the $65,000 mark. This wave of optimism on BTC also took the major cryptocurrencies with it.
Happy trades
BONUS


