

MARKETSCOPE : Breaking Bad
October, 09 2023

DO STATISTICS LIE ?
The only statistics you can trust are those you falsified yourself — Sir Winston Churchill
As usual, in our early month observations we are reviewing the previous month statistics and performances as well as some of our usual l.t. charts. But first a quick summary of the week which recorded some unexpected events.
 In the US the major stock indexes flipped early losses into an afternoon rally Friday after the U.S. jobs report showed a stronger than expected labor market alongside slowing wage gains. Prices of stocks and bonds initially fell sharply on the news, but both markets rebounded.
U.S. Treasury yields dropped from session highs but still ended higher for the week, with the benchmark 10-year note jumping 20 basis points to 4.78% and the 30-year yield climbing 24 basis points to 4.94%, the highest level since September 2007.
STOXX Europe 600 Index ended 1.2% lower while the Nikkei 225 Index down 2.7%.
Investors will have plenty on their plate in the week ahead, as high interest rates and chaos in Congress continue to weigh on investor sentiment. The consumer price index report could be the key event next Thursday.
The Q3 earnings season will begin to ramp up, with LVMH and PepsiCo set to headline on Tuesday, October 10. From Wednesday to Friday, Delta Air Lines, UnitedHealth, Wells Fargo, JPMorgan and BlackRock will also be in the spotlight.
Needless to say, in these more uncertain times, the outlook provided by listed companies for the end of the year will carry considerable weight. Ahead of the earnings flood, analysts have pushed on revenue and EPS estimates higher on 10 of the 11 main groups in the S&P 500 Index to add just a little bit more drama to the mix.
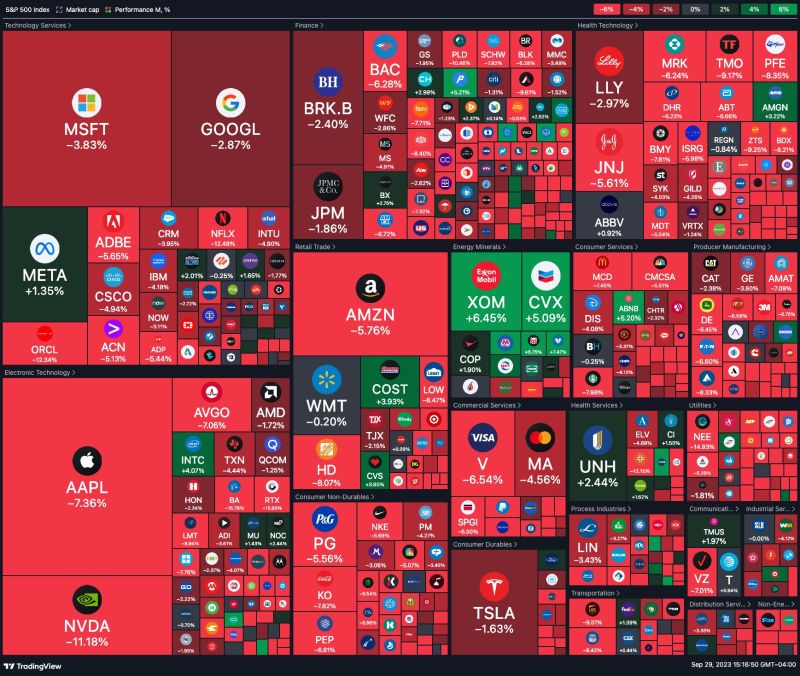
Time to have a look back to he worst month for S&P & Nasdaq since Dec 2022. The heat map for the month is significative:
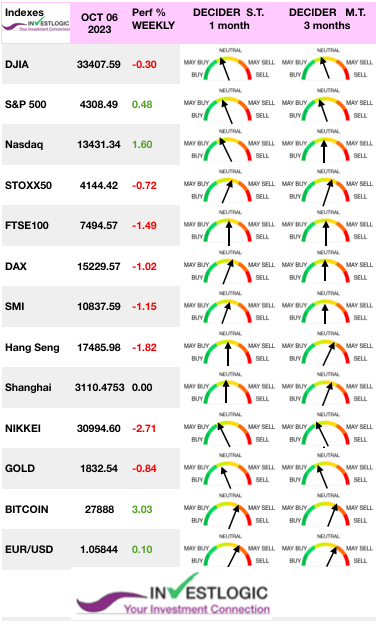
Let’s review some of the most widely observed global benchmarks, we note that September lived up to its seasonal reputation as most markets corrected meaningfully:
Here are some of the key highlights :
- September was the 4th year in a row that the S&P 500 (-4.8%) and the STOXX 600 (-2.0%) were down for September, as well as the 7th year in a row that Bloomberg’s global bond aggregate was down for the month.
- US 30yr Treasury yields saw their biggest quarterly climb (+83.9bps) since Q1 2009.
- 10yr JGBs nearly doubled (+36.5bps) to 0.76% in Q3, to the highest level since 2013.
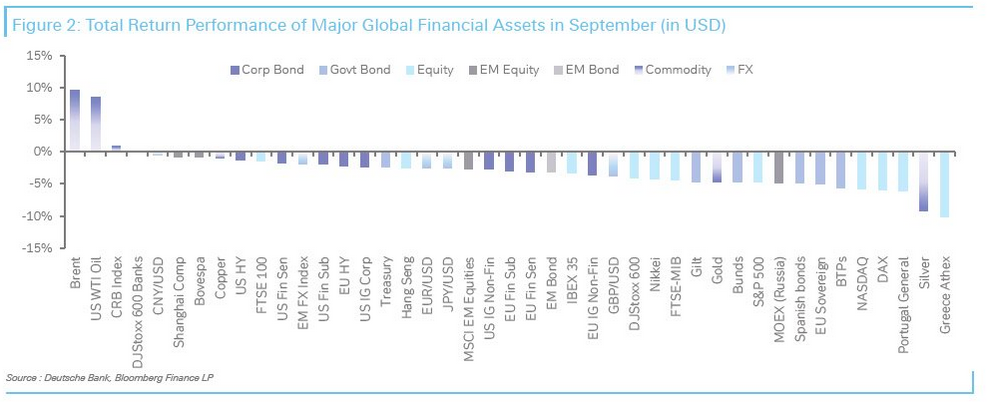
- Brent Crude oil prices were up +27.2% in Q3 to $95.31/bbl, which is their biggest quarterly rise since Q1 2022 when Russia’s invasion of Ukraine began.
- The dollar index strengthened by +3.2% in Q3, aided by a sharp rise in US real yields. Conversely, other major currencies weakened against the dollar, including the Euro (-3.1%), the Japanese Yen (-3.4%) and the British Pound (-4.0%).
- On a YTD basis, the NASDAQ still leads the way (+27.1%) with the S&P (+13.1%) strong even with the September/Q3 sell-off. However, the equal-weight S&P 500 is “only” +1.8% in 2023, which highlights the narrowness of the rally.
- On a YTD basis, the Nikkei (+9.1%) and Stoxx 600 (+7.9%) remain buoyant even with a -6.6% and -5.0% correction in Q3 respectively. However the Hang Seng is -7.2% YTD following a -4.1% decline in Q3.
- Higher oil prices, higher yield and the increasing likelihood of a U.S. government shutdown continue to weigh on investors’ sentiment.
Asset class and style returns by JP Morgan. As bonds and stocks fell simultaneously, commodities were the notable outperformer in Q3, returning 4.7% and echoing the market dynamics of 2022.
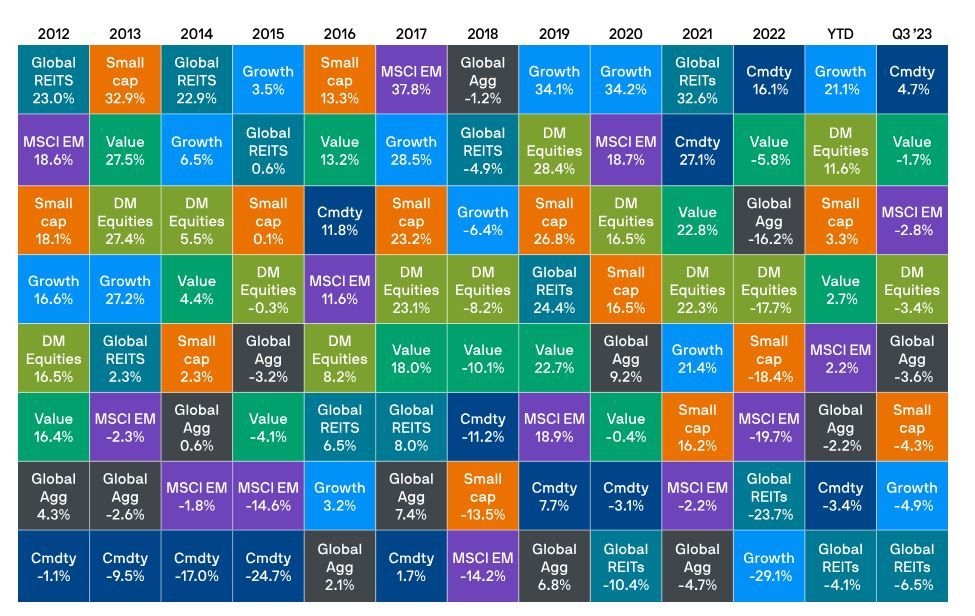
Source- JP Morgan
On the macro side, the core personal consumption expenditures (PCE) index increased 3.9% from year-ago levels. August durable goods orders surprised to upside. Durable goods orders and shipments increased month over month in August.
The overall economy expanded weakly after nine months of contraction following a 30-month period of expansion. Economic activity in the manufacturing sector contracted again in September for the 11th consecutive month following a 28-month period of growth but at a lower pace. The Manufacturing PMI registered 49 percent in September, 1.4 percentage points higher than the 47.6 percent recorded in August.
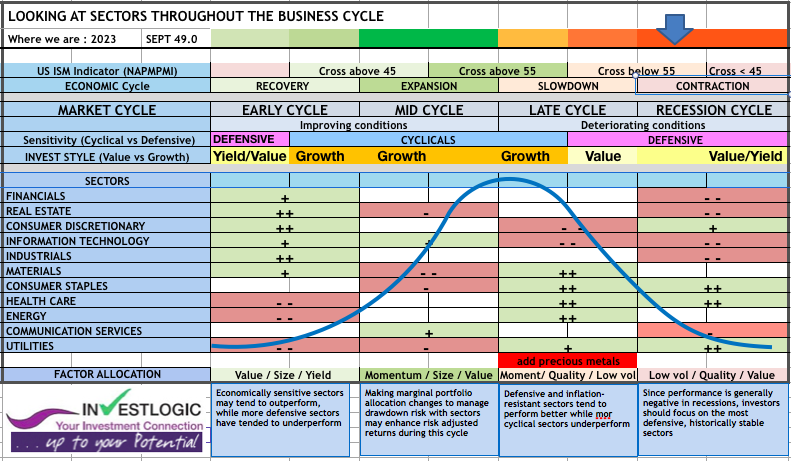
Our proprietary ABS Matrix
MARKETS
“October. This is one of the peculiarly dangerous months to speculate in stocks. The others are July, January, September, April, November, May, March, June, December, August, and February.”
— Samuel Langhorne Clemens
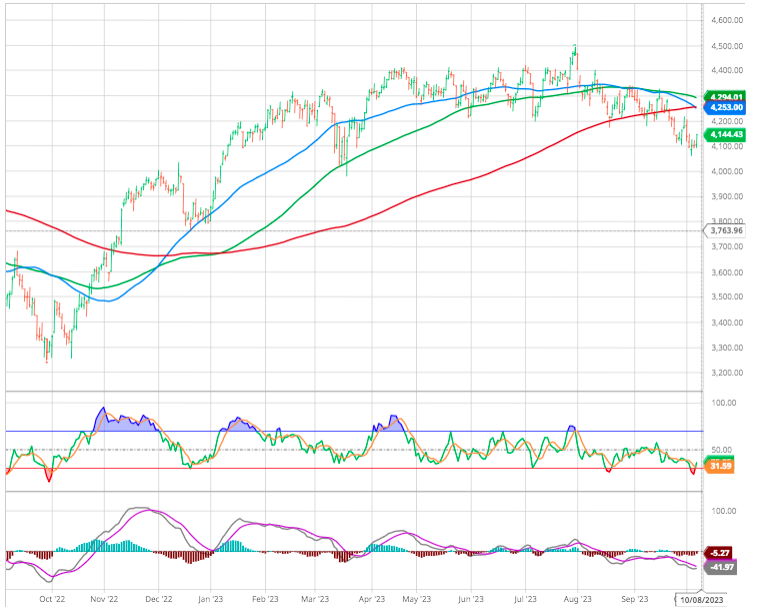
October started with a continuation of the August/September sell-off. While media headlines are flush with concerns about higher interest rates, the selloff remains orderly within the new middle east instability.
The market failed to hold the initial support level and quickly tested the 200-DMA as expected. Despite the market bounced sharply off support levels on Friday, reducing the MACD sell signal, we expect the correction process would require a decline to the 50% Fibo retracement around 4’150, marking also the previous resistance level.

While 2023 has largely defied the market’s pessimism and turned out to be a good year for equities so far, vulnerabilities to a violent downturn remain close.
The combination of Fed hawkishness, political motives, weakening economic fundamentals and a potential earnings recession could risk sending new shock waves to the broader markets, putting the case for a soft landing further out of reach, while the market’s vulnerabilities to a correction remain close.
Let’s conclude this part with a more positive outlook. The number of stocks trading above the 50-day moving average dropped below 10%. In recent past, this meant a tradeable bottom was not far away.
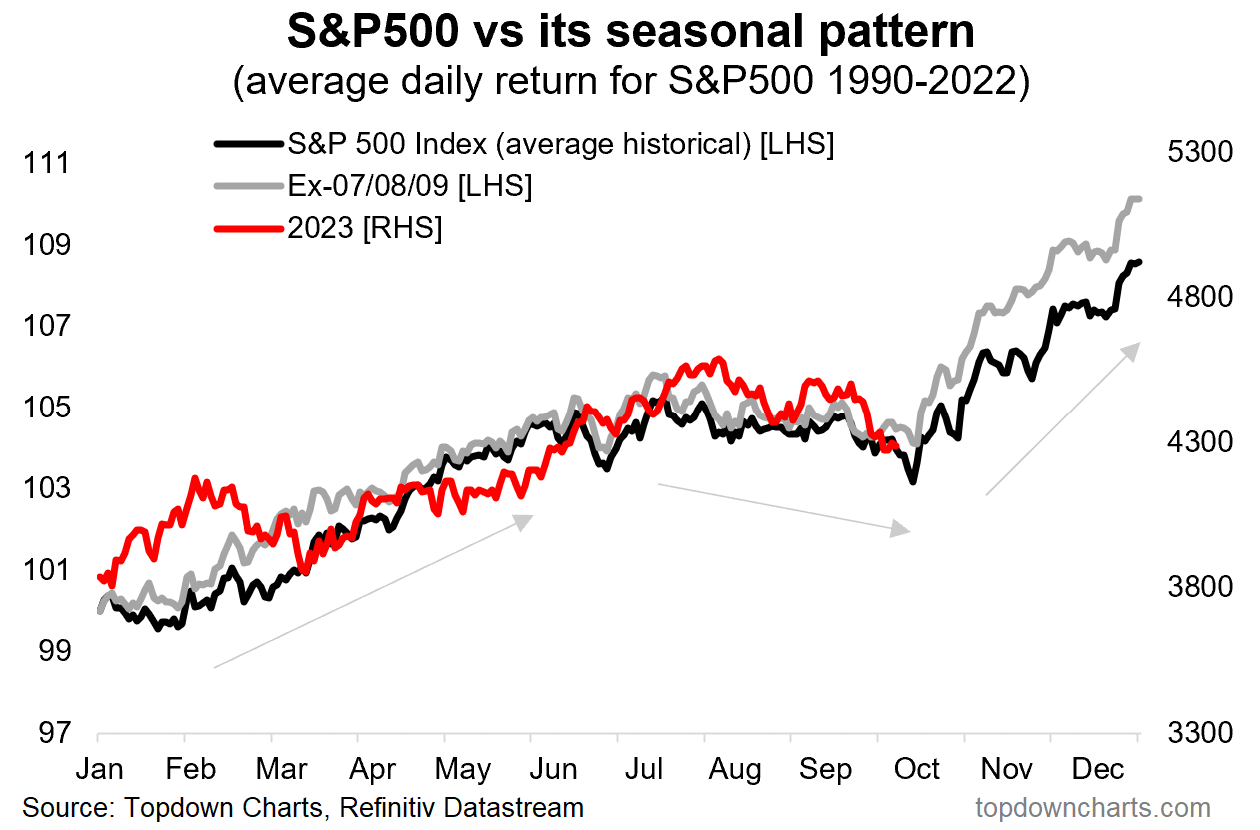
and seasonally it should go higher …
Europe
Quick check then how bad things are breaking in Europe. Here’s the narrow Euro STOXX 50 index:
200-day moving average broken … whichever way we slice and dice it, not much support available until 3,980 and even that seems delicate.
Same is true for the Swiss Market index
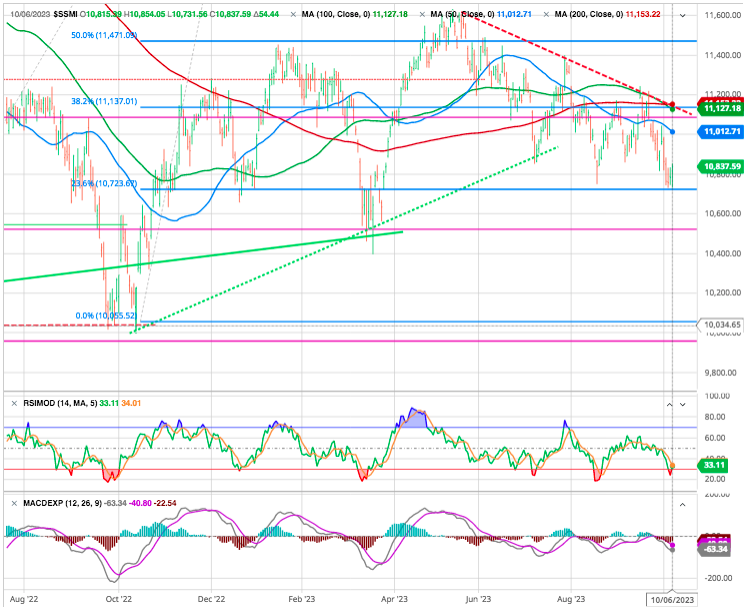
We reached our first downside target (50 % FIBO) but we can still go further down to test the March low.$
Asia
A quick glance at Asian markets, where Japan continues to be regional leader, despite a small correction in September.
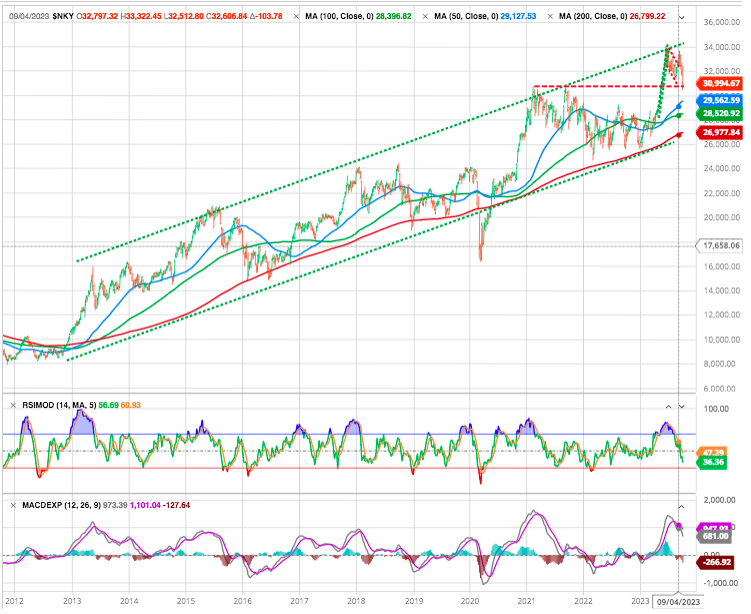
Looking at the Nikkei and taking the long, long, long view we note the index is nearly back to its bubble-highs – some 35 years later!
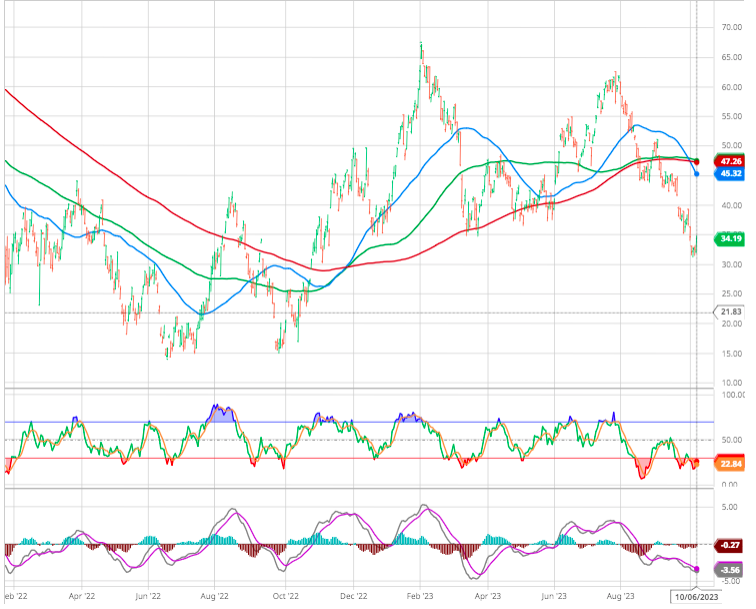
Gold
As for precious metals, the refrain remains unchanged. Gold is being crushed by rising bond yields. It’s hard to cope with positive real yields when, by definition, an ounce of gold delivers no return.
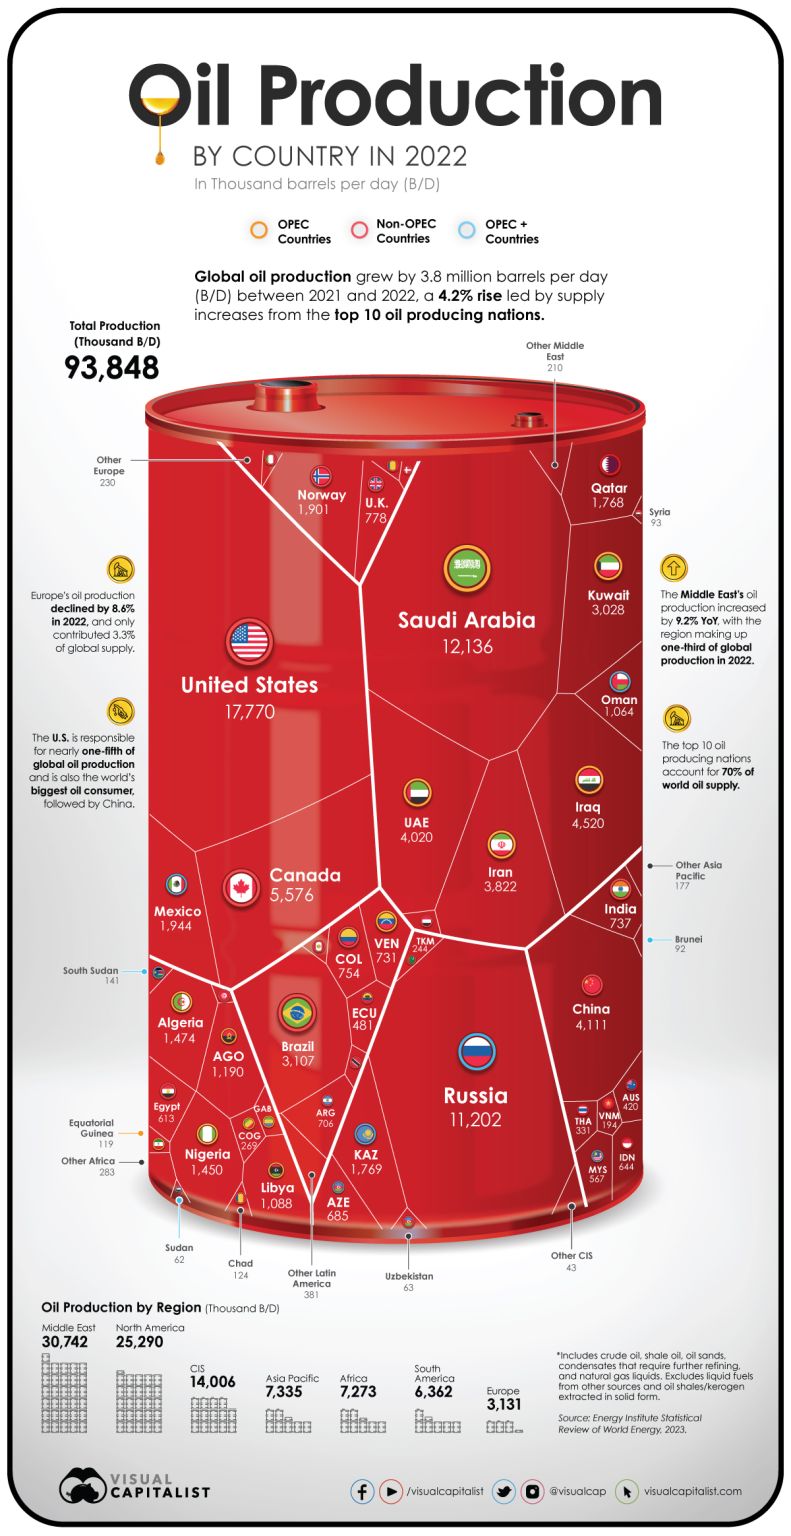
Oil
Whoever Controls the Flow of Oil Controls the World. Or So They Used to Say ….
These Are the World’s Biggest Oil Producers
CRYPTO
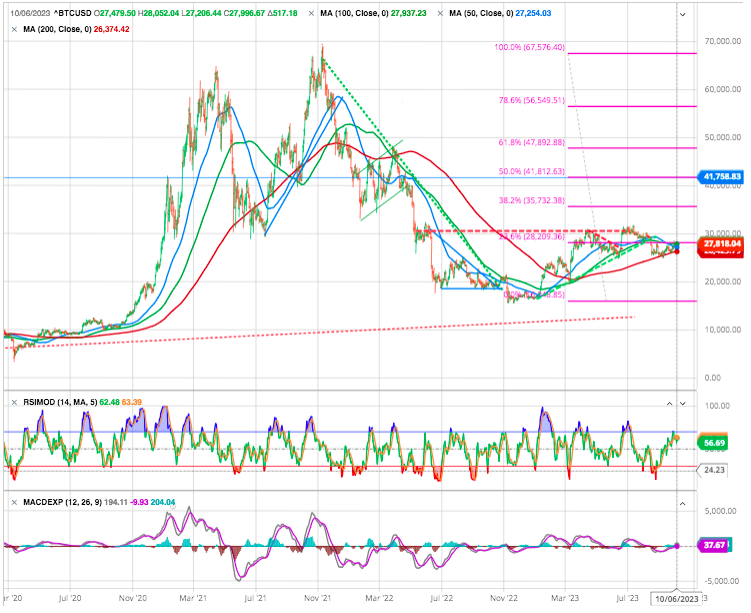
For seven months now, more precisely since mid-March this year, bitcoin has been hovering between $25,000 and $30,000, with no clear direction for market players.
For most cryptocurrencies, 2023 has thawed some of 2022’s crypto winter losses. Bitcoin, for example, has gained 63% year to date after losing 64% in 2022. Crypto’s steep pullback last year was due to several factors—notably a chilling correction after 2021’s surge as well as several high-profile scandals. Crypto prices have been helped this year by investors broadly gravitating toward relatively riskier investments compared to last.
Still mired in opaque regulatory compliance in the US, crypto-asset industry operators, and even a good number of observers, are waiting for a little more clarity to project themselves onto bitcoin and consort.
Back to Fundamentals
BUT, to come back to our title, are these economic figures reliable to predict the future ?
As for the economic activity figures published over the weeks in Europe and the United States, it has to be said that most of them came in above expectations. It’s hard to talk of a boom, but the underlying trend is holding up well. Much to the chagrin of investors, who are praying that the context is sufficiently worrying for central banks to abandon high interest rates.
It is also unsurprising that the risks imposed on a heavily indebted economy by higher rates always precede an economic, financial, or recessionary event.
Future data won’t ressemble September sweet spot !
- The strong job number on Friday briefly sent the 10 year yield above 5%.
- Then some took notice of a subdued rise in average hourly earnings of 0.2% a relatively modest 4.1% increase from a year ago. This helped the market recover earlier losses
- The FED put is gone: the FED is now focused on restraining demand to curb inflation a huge departure from the last 25 years when the FED was trying to support the economy with low rates which means the FED won’t come to the rescue of bonds and stocks when they correct….the Greenspan FED put has expired.
- The recent increase in strike activism is pushing for higher pay, now is the perfect time for workers to push for higher pay, the FED should be worried.
- Meanwhile september’s CPI comes out on Thursday this week. Economists expect +0.3% which would bring the yoy number to +3.6%. This will be a key data to watch.
- The FED will be watching future wage and price trends more than in the past.
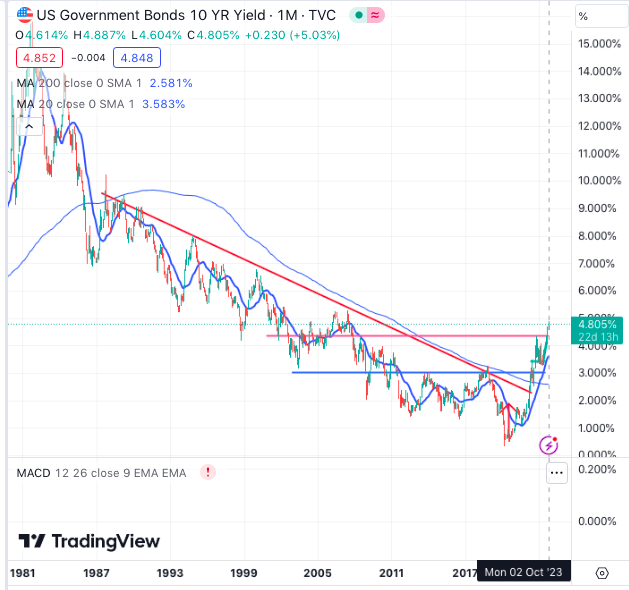
What is somewhat worrisome is that yields are rising as the economy is seemingly slowing down. This is ominous and dangerous, as it could be a sign that the US Treasury Department cannot find buyers for the papers they issue. The Federal Reserve Bank then becomes the “forced” buyer and yield curve control could indeed become a ‘thing’ in the US.
Let’s look at the Us 10 Years once more, zooming out even further for perspective:
To illustrate just how quickly yields reversed on Oct. 19 when the stock market tanked 20%, and how similar it looks to 2023, here’s an overlay chart of the percentage increase in the 10-year yield from the start of each year:
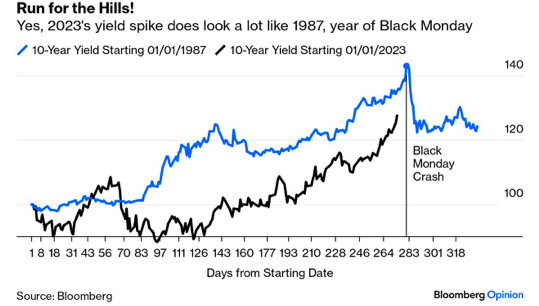
No One Wants to Remember 1987. Then There’s 1916
We recommend John Authers’ editorials (excellent as usual) in Bloomberg opinion The Yield Curve Moves to a Fatal Dis-Inversion in which he argues
“The spike in bond yields over the last few weeks, however, has been accompanied by a swift dis-inversion. The curve was inverted by 107.5 basis points (meaning that two-year exceeded 10-year yields by this much), as recently as July. Now that number has dropped to 31.7 basis points, the least inverted curve in almost 12 months.
And this is a shame, because the yield curve tends to dis-invert when the recession is about to start. (The intuition behind why this might be is that when a downturn is clearly imminent, central banks begin to cut rates, bringing down shorter-dated bonds.) ”
The following chart from Joe Lavorgna of SMBC Nikko confirms both that the curve inverts before each recession and also that the inversion is usually over by the time the recession, as officially defined by the National Bureau of Economic Research, begins:
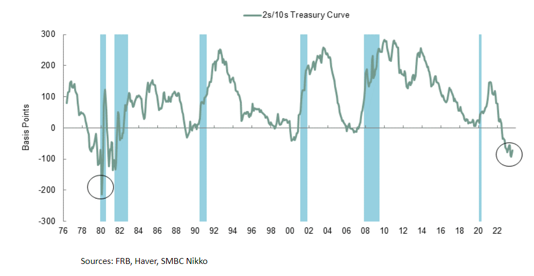
It’s possible, even, that it’s now become a false indicator. Now that the significance of an inverted curve is well known, it can change behaviors — and thus dampen the risk of a recession.
 source investing.com
Also see Goldman Sachs Why the yield curve isn’t signalling recession
Happy trades
BONUS
STRATEGY : Time is your friend when you invest in stocks
This is one of the simplest, yet most powerful charts you will come across as an investor.
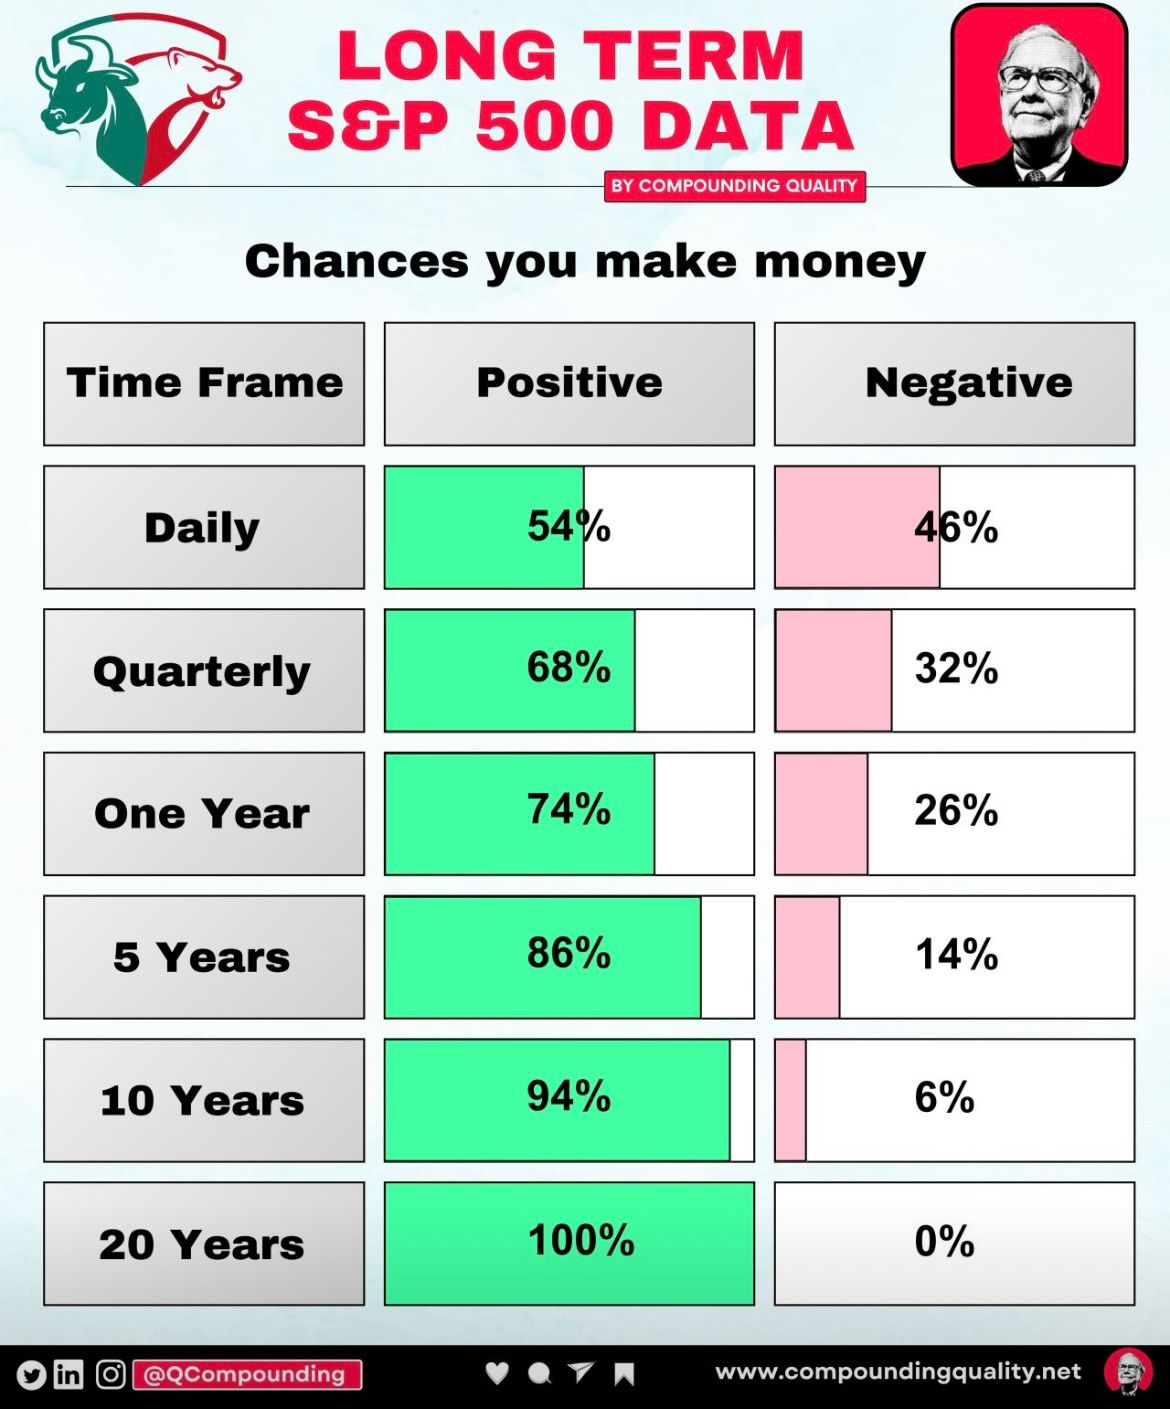
It shows you that being invested in the broad equities market (in this example: the S&P 500 index) will tilt the odds in your favour as time goes on.
With a 20 year holding period you would not have lost any money historically but generated positive returns with a 100 % probability. Even the shorter term odds look nicely skewed in favour of those investors being long equities.
The flip side is that being a short-seller is a tough game as the odds are stacked firmly against you…unless you are a genius in market timing (which very few are) or a highly gifted fundamental stock analyst who manages to uncover aspects (of wrongdoing or future problems) about a company that the market has missed.
For the majority of investors the message remains as always (no harm repeating it here):
Time in the market beats timing the market!
And, yes, for the cynical amongst us, the following is also a true statement: In the long run, we’ll all be dead…
