

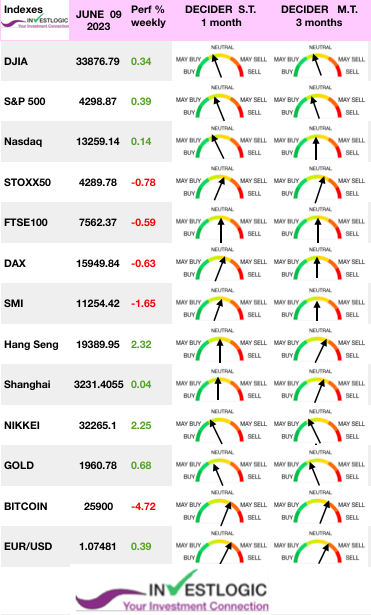
MARKETSCOPE : All Eyes on the Fed
June, 12 2023

One of the most expressive and tragic artistic paintings is by Polish artist Thomasz Kopera.
It depicts the amount of pain and suffering an individual must undergo when trying to break free from the “Herd Culture” that the majority of society believes in.
Freeing oneself from the “intellectual shallows” of society requires courage and abnegation.
The Market is Climbing a Wall of Worries
Wall Street held up well, thanks to tech stocks and expectations of a pause in interest rate hikes from the Fed next week.With the debt ceiling suspended, bank failure fears subsiding, the Fed expected to pause, and recession forecasts pushed out, the wall of worry that has persisted for over a year has finally been torn down.
 Stocks closed the week modestly higher as the S&P 500 Index moved into bull market territory, or up more than 20% off its mid- October lows. The Nasdaq eked out a 0.1% advance, which was good enough for its seventh straight winning week, its longest streak since 2019. Market advance is broadening, with small-caps as the Russell 2000 rose 1.9% this week, outperforming large-caps, and value shares outperforming growth stocks. Last Thursday, the US Labor Department reported that weekly jobless claims had jumped to 261,000,
The pan-European STOXX Europe 600 Index ended the week slightly lower while Japan’s stock markets rose over the week, reaching fresh 33-year highs.
The Nikkei 225 Index gaining 2.4% and the broader TOPIX Index up 1.9%. Chinese equities were mixed after the latest inflation data increased concerns about the country’s faltering post-pandemic recovery. Data out of China could bolster stimulus expectations. we believe that markets are now overstating the case for economic weakness.
The Australian and Canadian central banks took the market by surprise by resuming their rate hikes. This negative signal briefly weighed on investors’ sentiment, but they were reassured by the fact that US activity indicators (services momentum, employment) are weakening, which means a more accommodating Fed. We remain in the “bad economic news is good financial news” configuration, as long as the bad economic news isn’t too bad. Meanwhile, the US recession is still two months away. It has actually been 2 months away for a year now…
Now the question is whether the sentiment toward the market has been taken too far, and there’s a very good argument that’s so. Ahead of a week when investors must brace for US inflation data, and then monetary policy meetings by the Federal Reserve, the Bank of Japan and ECB.
While the ECB will most likely raise its key rates by 25 basis points, and is likely to announce further tightening in the future (meeting on June 16). Futures markets are pricing in a 71% that the Federal Reserve pause.
Tomorrow CPI report will be closely watched with the shadow of inflation hanging over the market. Economists forecast a 0.4% increase in core CPI for May to match the level from April. Core CPI is seen being 5.3% in May in a slight moderation from the 5.5% pace in April. Headline CPI, which includes food and energy prices, is seen being up 4.1% in May.
MARKETS : Bad economic news is good financial news
With the market pushing into that resistance at 4300 and the top of the rising trend channel from the October lows, a pause in the advance would be unsurprising. However, the rally has finally convinced the bears to come off the sidelines, with professional and retail investors getting substantially more “bullish” over the last two weeks.
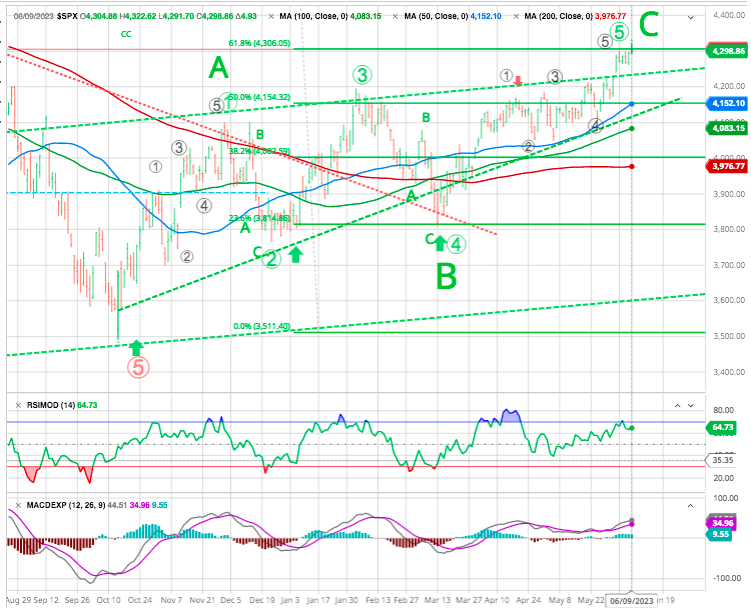
The current rally challenging the 61.8% Fibonacci retracement In December 2021, the market peaked at a Buffett Indicator of 2.6 standard deviations from the trend line, fell to 0.8, and has recovered to 1.4. Nevertheless it seems that we have completed a third correction wave (C).
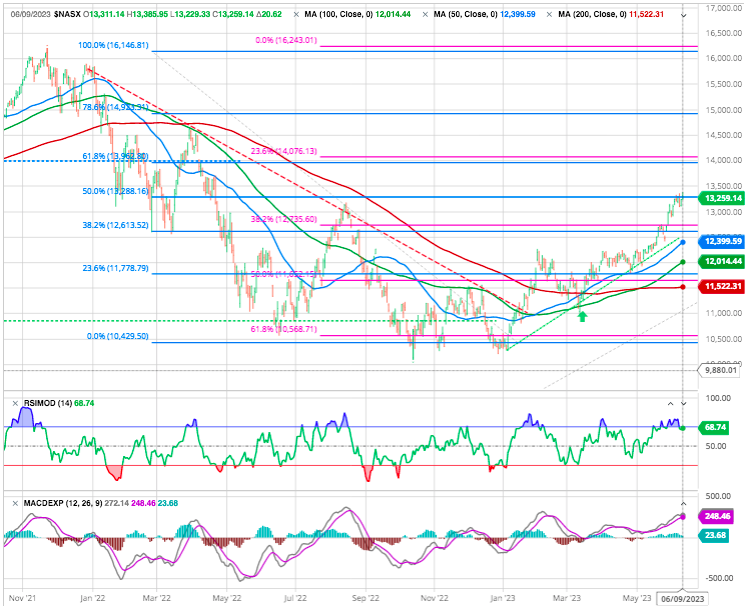
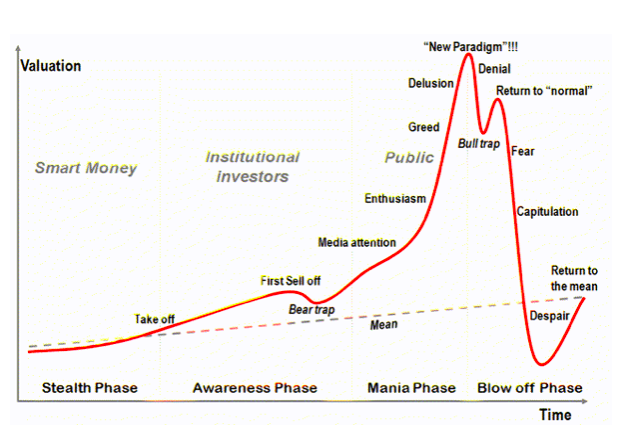
Today, the NASDAQ peaked in November 2021. It fell 37% to October 2022 and has since rallied by 32%. The bull market was characterized by a frenzy of speculation, particularly in crypto and technology related companies. People who had previously been uninvolved in the markets, aside from their retirement accounts, were piling money into cryptocurrencies and hot companies.
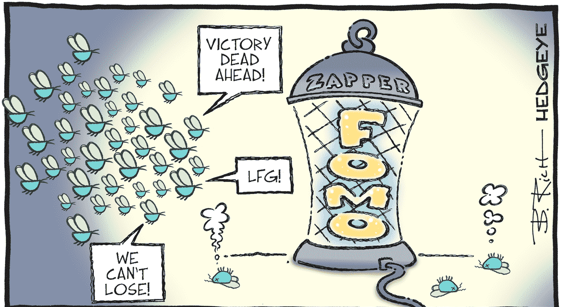
The move is unsurprising given the “Fear Of Missing Out” or F.O.M.O. evident in the chase of technology stocks higher regardless of valuations. However, these mania phases are not uncommon.
The current rally has breached the 0.5 Fibonacci retracement (BLUE lines) and is making progress toward the 0.618.
CRYPTOS
US tightens crackdown on crypto with lawsuits against Coinbase, Binance
The top U.S. securities regulator sued cryptocurrency platform Coinbase on Tuesday, the second lawsuit in two days against a major crypto exchange, in a dramatic escalation of a crackdown on the industry and one that could dramatically transform a market that has largely operated outside regulation.
Cathie Wood buys the dip in Coinbase shares amid SEC crackdown
Return to Normal ?
Broadly, people feel that we have returned to normal. Calls for a new bull market are fever pitched. AI is claimed to be the next big thing. Battle lines have been drawn between new bull market and bull trap.
Stocks crossed the threshold for a bull market, but it doesn’t change the reality on the ground. The Fed is likely to keep hiking interest rates to balance the economy, and corporate profits should continue to slowly fall.
Markets have an amazing capacity to do crazy things, but there’s only so far that things can stretch. Far from being an unstoppable surge driven by fundamentals, this year’s bull market looks increasingly driven by speculation, not by underlying corporate fundamentals. If they believe the business cycle has been legislated out of existence then investors can pile in here all they want. However, if history is any guide, they’re likely to be disappointed with their results.
Despite subtle signs of weakening, the business cycle has yet to fully turn. The Fed had been expected to start cutting interest rates now, and instead, they’re not even done hiking. That means that the robust earnings recovery in 2024 coming off the business cycle trough is likely not going to happen.
Earnings estimates have perked up in the past few weeks, but the hidden driver there is the recent weakness in the US dollar, which disproportionately helped Big Tech. Should the global economy weaken, this could catch investors offside if the dollar strengthens again, as it typically does in times of global recession.
Historically, it’s actually typical for stocks to surge as the yield curve inverts. This is because investors tend to be shortsighted and think that Fed pivots are the key to profit. However, this tends to end poorly, as yield curve inversions tend to foretell economic pain ahead. Bond investors see the pain in the economy coming 12+ months out, while stock bulls tend to react far more to changes in sentiment and current news.
Fundamentals continue to be bearish. To start, the manufacturing and services PMIs continue to degrade. Manufacturing is already in contraction and services are on the cusp. Recession coincides with the PMIs in contraction. -See last week Marketscope-
Over the course of time, however, fundamentals and valuations do matter. These are the reasons that we believe it is most likely that the market is experiencing a bull trap and “return to normal” stage at this time. In fact, we expect that a consensus view of a new bull market and recession avoided is a contrarian indicator to us.
History shows that new bull markets are most often born of rate cuts, not rate pauses. In 2000 and 2008, rate pauses merely signaled the start of the bear market in earnest.
Last but not least :
Think you missed the rally in Japanese stocks? Think twice.
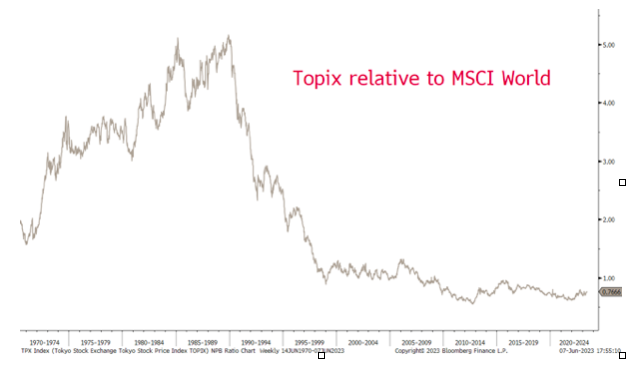
Stay tuned (and long Japan) …
Happy trades
BONUS
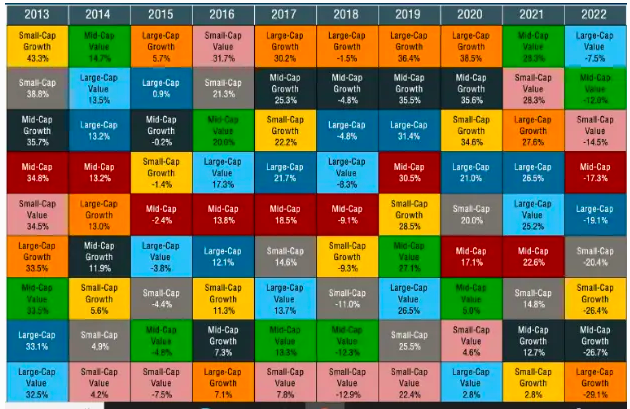
The table below is the Callan Periodic Table Of Returns through the end of 2022. If you pick any asset class, you will see that none stay in the top or bottom positions for long. Generally, a good guide has been to buy what everyone hates and sell what everyone loves.
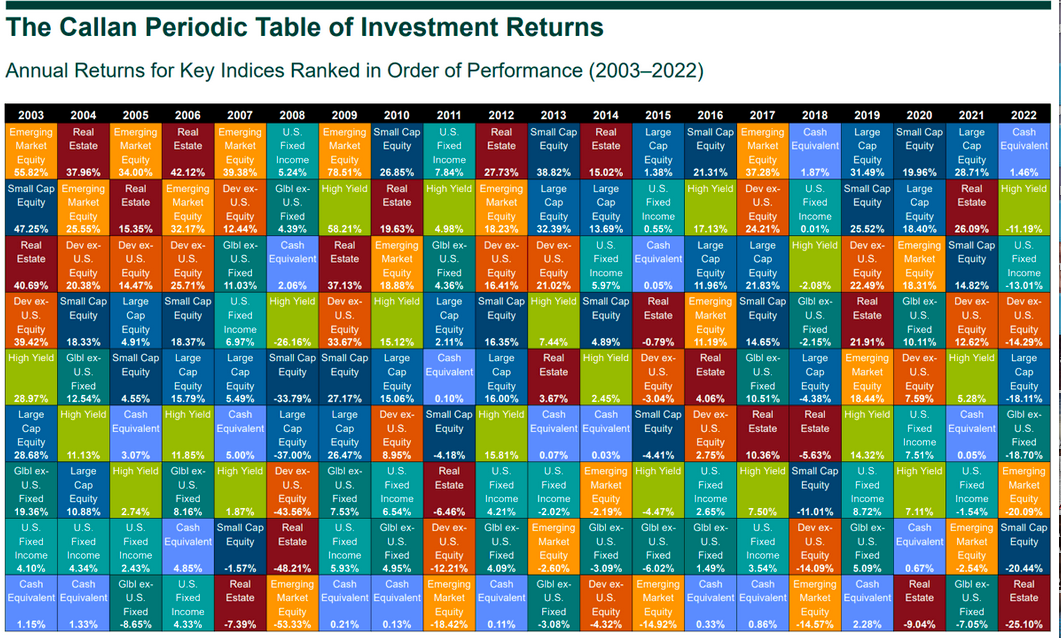
Source www.mymoneyblog.com
When looking at Callan Chart, don’t look for trends; rather, see principles.
Trends come and go; principled investing stands the test of time.