

MARKETSCOPE : A Gravity-Defying Stock Market
January, 22 2024

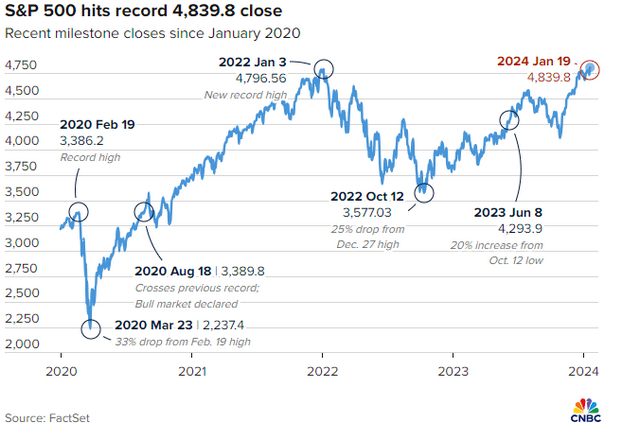
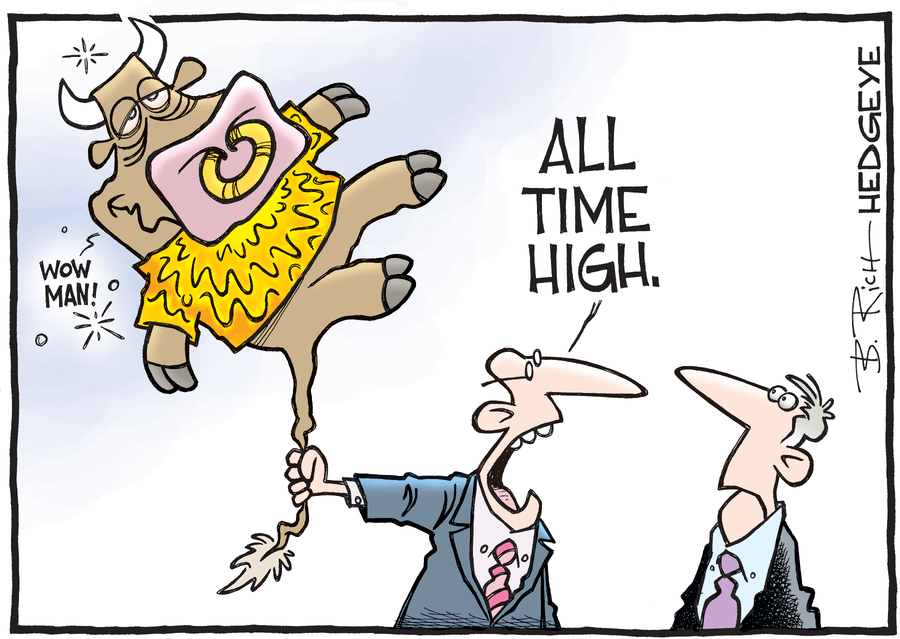
At the end of the week US stock market closed the on a strong note, with the S&P 500 finishing at a fresh record high, boosted by a rally in semiconductor stocks and other big tech names on optimism around artificial intelligence and the Nasdaq 100 set a new all-time record. It brings all three major stock market averages into positive territory for the year !
The market breaking out to set a new all-time high for the S&P 500. As is always the case, the media was quick to jump on the headline as well:
“Friday’s milestone confirms that the stock market is officially in a bull market that began in October 2022, and not just a bounce within a bear market. The S&P 500 is up more than 35% since that low.” – CNBC
Even if equity markets remain in a holding pattern, yields have surreptitiously risen again, as in the case of the US 10-year yield, which had the luxury of surpassing 4.07%. This would confirm the slowing of the easing initiated in October, which could, if the rebound becomes too strong, halt the fine upward momentum of the S&P 500 and others.
 Macroeconomic activity continued to show resilience as the University of Michigan’s survey showed consumer sentiment improved in January to its strongest level since summer 2021. However the New York Manufacturing index reached its lowest level since early in the pandemic.
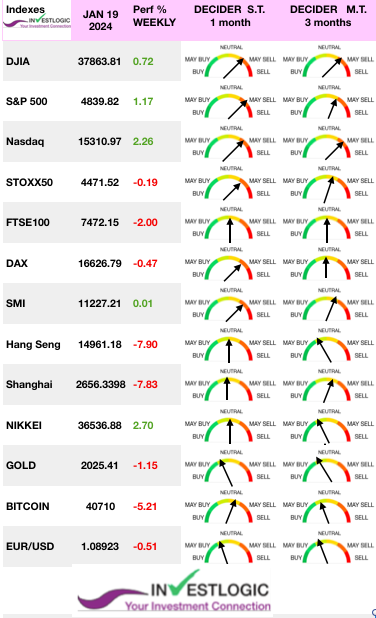
Elsewhere in the world, Europe Stoxx 600 Index ended the week 1.58% lower. The Nikkei 225 Index gained 1.1% to reach a 34-year high. The Shanghai Composite Index fell 1.72%, its 8th weekly drop in the past 9.
The Chinese economy continues to suffer, with GDP for 2023 coming in a little short of expectations and real estate news still worrying. But Beijing is still not responding to calls for stimulus measures. Hong Kong and Shanghai stock markets are depressed.
Growth indicators will be in focus this week, with key releases including the preliminary Q4 GDP reading in the U.S. and the global flash PMIs. Central banks will also be busy, with monetary policy statements and interest rate decisions expected from the Bank of Japan, European Central Bank, and Bank of Canada.
The earnings calendar is very busy, with Tesla, Netflix, Visa (V), and American Airlines Group just a few of the notable companies due to report.
Davos
The latest gathering of the world’s political and business elite, plus the usual smattering of celebrities, took place at the Swiss Alpine resort of Davos. The annual meeting comes as geopolitics become heavily intertwined with the world economy.

The world’s big money guys were gathered for the World Economic Forum in Davos and, unsurprisingly, they made hawkish speeches to counter investors’ relentless anticipation of a rate cut as early as next March.
The theme ‘Rebuilding Trust’ to provide the crucial space to step back and focus on the fundamental principles driving trust, including transparency, consistency and accountability.”
“Rebuilding Trust” won’t be easy, and many have already dismissed rich and powerful idealists who gave rise to the terms “Davos Man” and “Davos Woman.” Skepticism surrounding the conference can make the task even more challenging, especially when looking at the track record of the WEF.
Anatomy Of a All Time High
We could not say it better than the excellent John Authers’ Bloomberg Opinion so we urge you to read it ! Why the S&P’s new record may not mean a bull market. SEE BOTTOM BONUS
MARKETS : A tale of 2 Markets:
The breakout to new highs is encouraging and suggests the two-year market correction process is behind us. The action is bullish from a technical perspective.
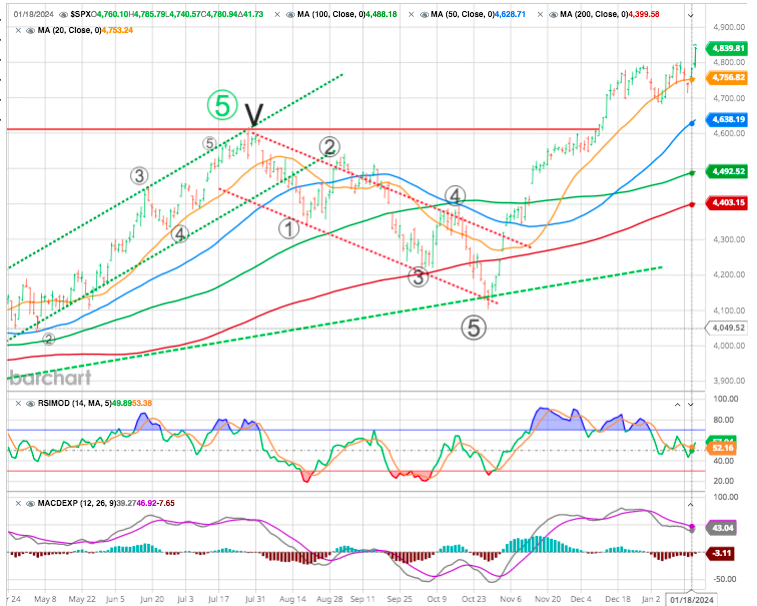
However, the more overbought conditions have failed to correct meaningfully, suggesting further upside from current levels may be somewhat limited.
<
The S&P 500 closed at an all-time high. But the Russell 2000 is still in a bear market, down more than 20% from its high. The S&P 500 just closed at record prices, yet only 1 out of 11 sectors made new highs today — Technology.
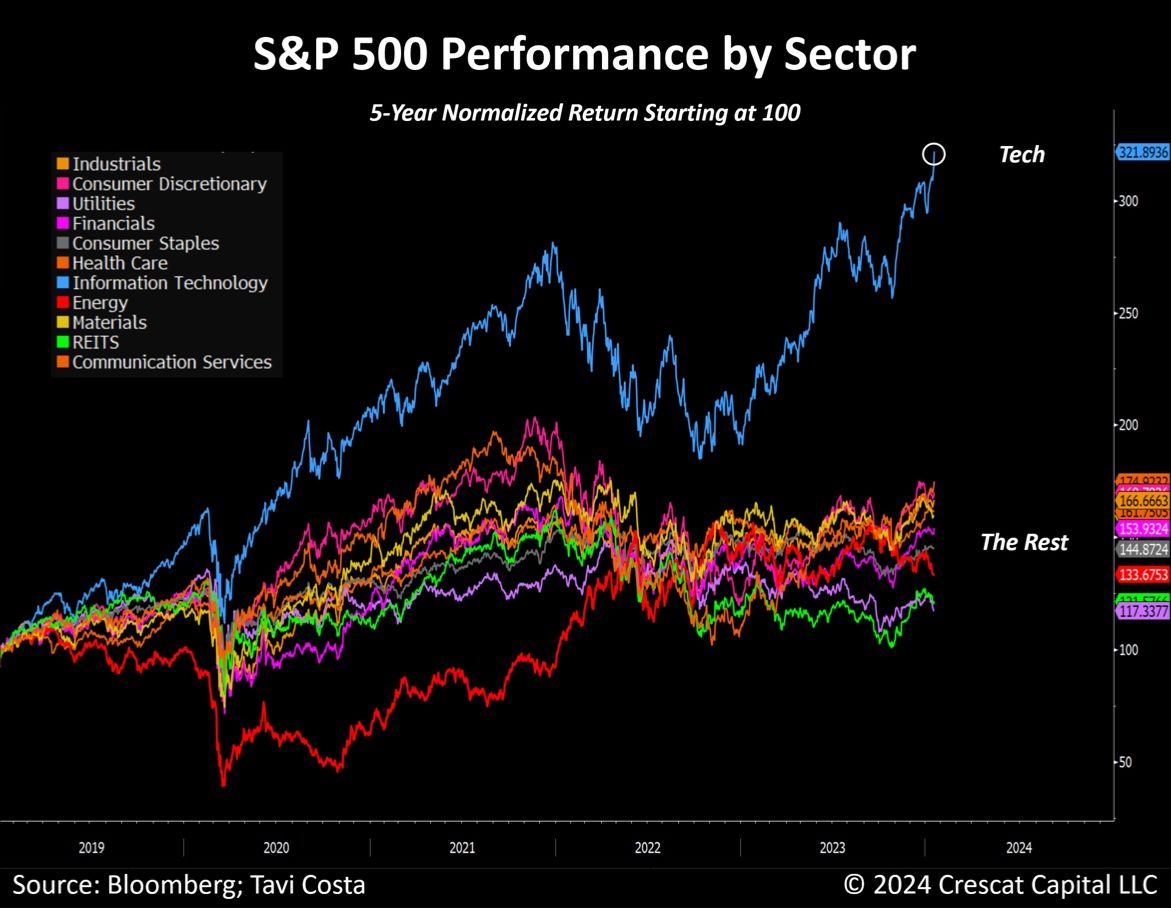
The disconnect becomes more evident when considering the 5-year performance across different sectors. While it may seem on the headlines that all is well in the equity market and the stocks can only go higher from here, a breakdown of the actual structure and flows shows that the market is being driven higher by fewer stocks.
Given that the big Mega-capitalization stocks are a place of safety where major asset managers can place large amounts of capital, and the bulk of expected earnings growth will come from those companies, it is not surprising we are seeing the divergence again.
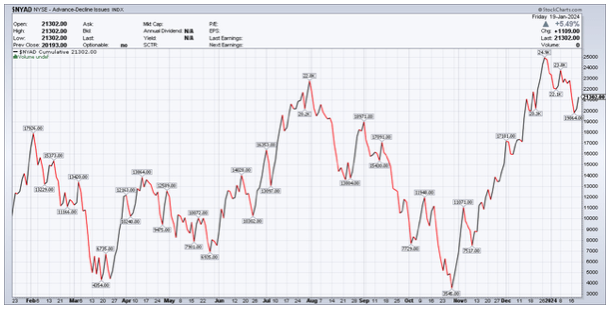
It is also the reason why the advance-decline on the NYSE, is now below its July peak.
While there seems to be little concern in the market currently, particularly given the low levels of volatility, the rally has once again become very narrow, with the A.I. stocks and the “Magnificent 7” leading the charge.
The fate of these giant technology companies is critical to the prospects for markets given the combination of their strong performance and huge index weightings. How big are the “Magnificent 7”? The following chart provides a useful perspective.
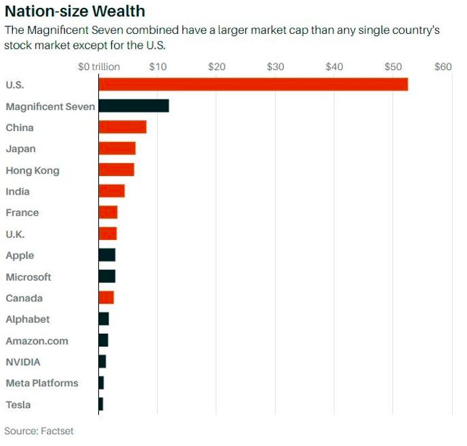
The combined market cap of the “Magnificent 7” is greater than the market cap of the publicly traded stocks of any nation other than the United States! Just 7 companies!!
But: Is It a Bull Market? Could the S&P 500 continue to move higher? The S&P 500 itself is no longer a representation of 500 stocks at this point.
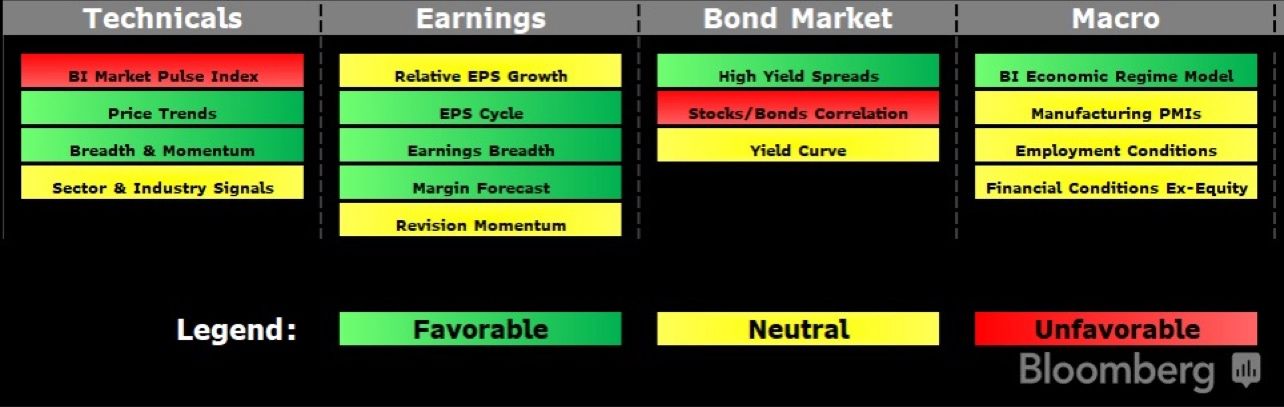
According to Bloomberg Intelligence tit is not a matter of soft/hard landing, it’s a liftoff !
Technicals cued recovery more than a year ago, earnings lined up in favor of a positive shift very early in 2023 and even the macro indicators started pointing to better times ahead for stocks in 4Q. Indicators of equity market health :
Meanwhile Earnings for S&P 500 companies are expected to rise 4.4% Y/Y in the fourth quarter, according to data from LSEG, which should provide additional optimism for the market.
FED : Will It Start Tapering ?
Is it really such a safe bet that the Federal Reserve is going to cut interest rates early and often this year? Considering the macro stats and the first one being inflation and jobless claim numbers, nothing closed to a slowdown.
If the economy looks to be strong, then there’s less need for a central bank to cut interest rates. Indeed, if it’s running that hot, it could be an actively bad idea and drive overheating. A central bank that admits that in 2021 it made the serious error of allowing inflation to take hold is not going to want to cut too soon and let prices take off again.
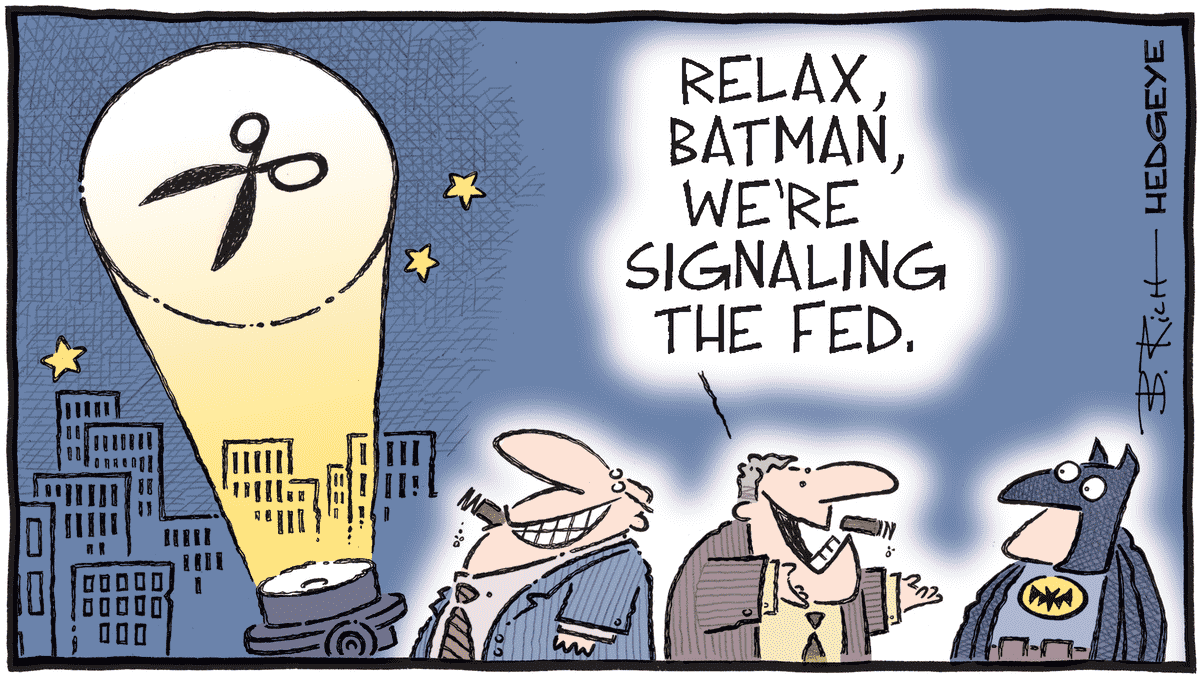
Recent Fed communication has emphasized Quantitative Tightening (QT), anticipating discussions in upcoming meetings leading to a June start for tapering, earlier than initially expected. But the market’s anticipation of the imminent end of QT is deemed exaggerated. The earlier taper initiation is expected to be coupled with a more gradual reduction. And QT concluding in early 2025 when reserves hover around $3.2 trillion.
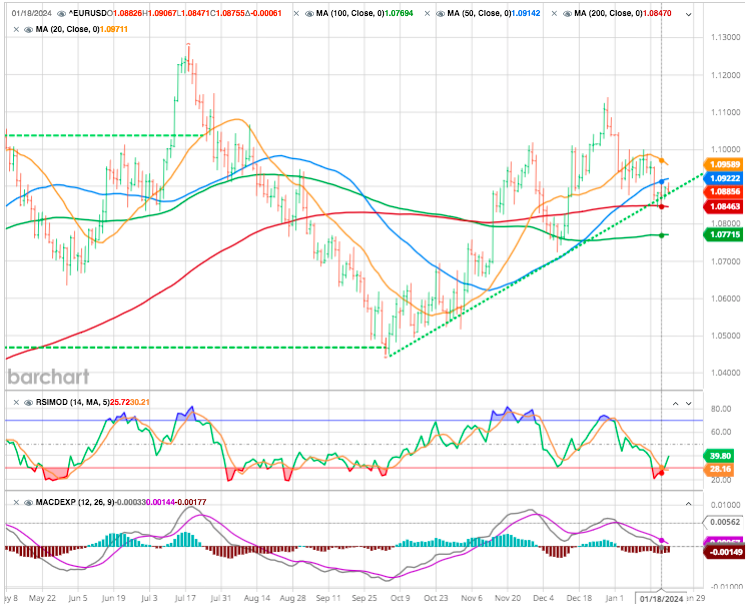
USD
That in turn implies further strength ahead for the dollar. The dollar’s exchange rate against the euro has recently been driven to the exclusion of almost everything else by the chances of a March cut. With the European Central Bank thought unlikely to lower rates before June, any such cut should directly weaken the dollar. Thus, the dollar will strengthen as the odds will be adjusted.
While many discount the linkage between the end of QT, the start of QE, and the markets, there is most definitely a psychological one. Markets will pay close attention to the Fed’s balance sheet. Actually while there has been previous debate on the impact of the Fed’s balance sheet changes on the markets, there is a very high correlation between the two, suggesting it is more than a coincidence.
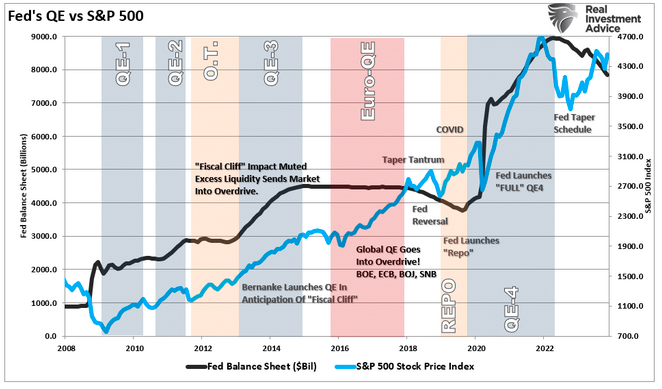
Back in 2010, then Fed Chairman Ben Bernanke introduced the concept of “neutral stimulus” to the financial markets by adding a “third mandate” to the Fed’s responsibilities – the creation of the “wealth effect.”
For investors, as each round of “Quantitative Easing” was introduced, the “neutral stimulus,” the stock market rose, the “potent stimulus.”
Happy trades
Bonus
From Bloomberg John Authers
ANATOMY OF AN ALL TIME HIGH
How did we get there? Friday ended with the S&P 500, the world’s most-followed index representing more than half the entire value of global equity markets, at an all-time high. It was its first record since Jan. 3, 2022, and arguably brought to an end a two-year bear market.
Interest rates are far higher than when that last peak was made; the fed funds rate has risen from 0.25% to 5.5%. Inflation is well-above target by many measures. Polls show that the US populace thinks the economy is in a dire place. The bond market predicts a close-to-inevitable recession. So how can stocks set a record?
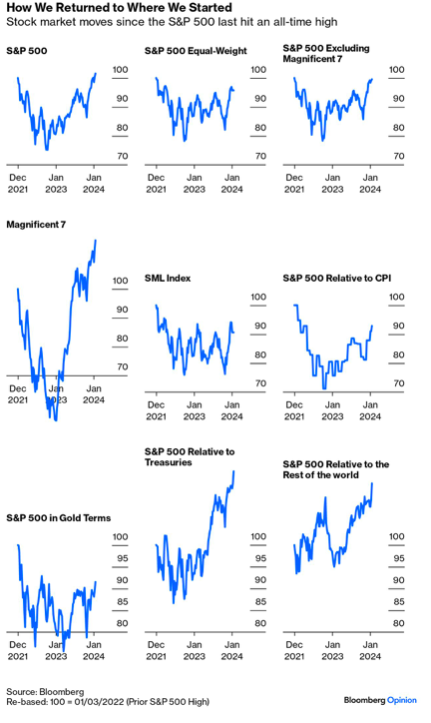
This dashboard should shed some light. The recent rally has been led by the so-called “Magnificent Seven” tech platform stocks, prompting worries that the market is too narrow and concentrated.
Those concerns are overstated. The equal-weighted version of the S&P 500, in which each of the 500 members gets the same weighting, has indeed lagged the cap-weighted version, but not by that much. While excluding the Magnificent Seven keeps the S&P from its record, it’s very tight.
Smaller companies have lagged, but if we use the S&P 600 index (known as the SML), the gap is not that great. S&P’s small-cap index excludes companies that have never made a profit, and avoids being weighed down by disaster stocks. Beyond that, the S&P has failed to get back to its 2022 high in terms of gold, or in real terms adjusting for US inflation. It has, however, completely walloped the stock markets of the rest of the world, and bonds:
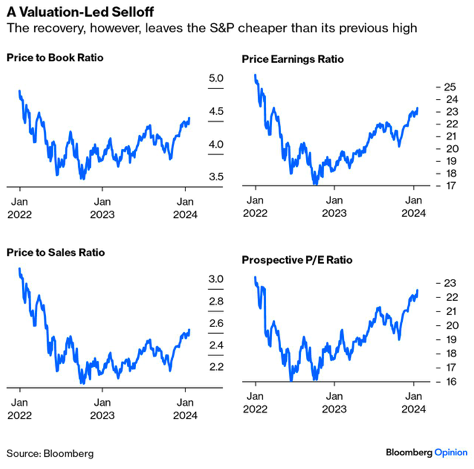
Is this rally about irrational exuberance, as Alan Greenspan might have put it? Possibly not. A range of sensible valuation metrics show multiples are rising, but still significantly cheaper than at the beginning of 2022:
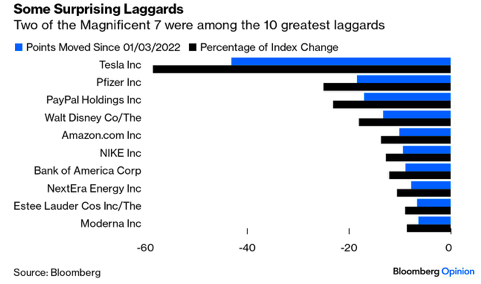
The leaders and laggards since Jan. 3, 2022, reveal that this rally is broader than credited. The effect of the most hyped stocks of the moment turns out to be quite complex. The company that has subtracted the most points since the last high is Elon Musk’s Tesla Inc. Amazon.com Inc. is also in this list. Pfizer Inc. and
Moderna Inc., the makers of mRNA vaccines, also appear in the 10 worst laggards. In the chart, the bars refer to the number of S&P points accounted for by each stock, and to their impact on the total percentage increase of the index:
Few will be surprised by the biggest leader: Nvidia Corp., maker of the chips that power artificial intelligence. Remove Nvidia, and the S&P is not back at its record. But the list of companies that contributed most to the S&P’s rise since its last high include Exxon Mobil Corp. and Warren Buffett’s Berkshire Hathaway. Old economy companies have been part of this:
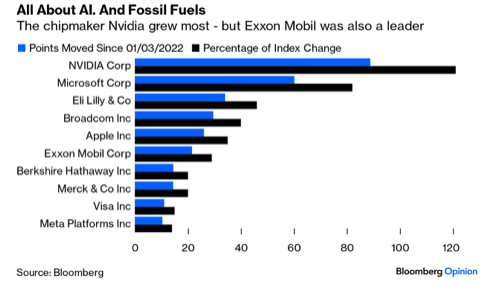
Indeed, the best performing sector has been energy, gaining 40%. So, this isn’t an excessively narrow rally, and it only looks that way because the same narrow group of companies sold off most at first, and then led the rebound. It’s been achieved on slightly more realistic valuations than were available at the beginning of 2022, when optimism did look excessive.
But: Is It a Bull Market?
Is this rally built to last, and is it a new bull market? Some will consider this meaningless sophistry. The S&P 500 has rallied by 35.3% since its nadir in October 2022, and is at a new high. How can this be a bear market?
A reminder :
In late 2007, in real time, concerns centered on anxiety over the economy and the credit market. Many felt that stock valuations were unrealistic amid such serious problems. They were proved right. Leaping in on the basis that a bull market had started would have lost you a lot of money. It makes more sense to talk of a bear market that lasted almost all decade, ending only in March 2009 when the trough of post-Global Financial Crisis despair was reached. Low interest rates, and exceptional access to credit enabled by new structured credit markets, postponed the denouement. But ultimately the market needed to set a new low, even below its 2002-03 nadir. In any case, the S&P only briefly and marginally exceeded its previous high, and never did so when adjusted for inflation.
In January 2022, stocks looked plainly cheap compared to bonds. They don’t any more. At times of late, the 10-year yield has actually been higher, for the first time in a decade. That’s what we might expect at the beginning of a bear market, not when we can declare a new bull run:
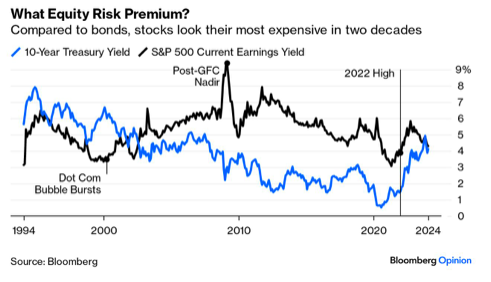
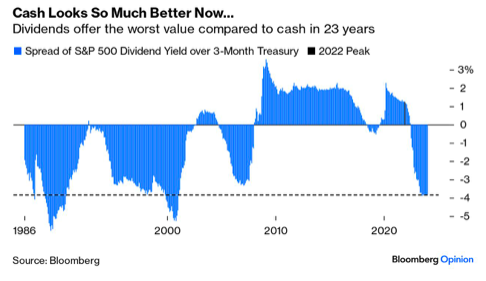
If we compare in terms of raw cash, with the dividend yield on stocks and the yield on three-month bills, so focusing on the most basic measures of cash flow, the picture is fairly similar. In the post-GFC decade, it became the norm for dividend yields to exceed the yields on bills. This is a potent illustration of how strong the support for stocks has been — if you get more of a cash return from dividends than you would get from very short T-bills, why not buy stocks? The January 2022 peak is marked. Stocks look far worse value on this measure now than they did then. Indeed, they look more expensive than at any time in two decades:
If higher productivity is ahead (which might come from AI), then it makes sense to pay more for stocks.
Some of the current optimism is grounded in hopes for AI. But the bond market is still center stage. If bond yields consolidate at about their current level, it’s hard to justify paying the valuations currently demanded of stocks. If bond yields are about to fall significantly and stay there, then stocks look more attractive (and a 2% outperformance of bonds is also more appealing).
Can that really happen? If bond yields stay elevated, presumably because inflation is sticky, then this new high will come to look like the high of October 2007 — a blip in a longer-term trend that helped sucker some in at the top. If the market is really right that bond yields will return to their box, then stocks can carry on into a true bull market. The former seems more likely to me, but neither can be discounted. Those are the stakes as US stocks celebrate their new record.
Stay tuned